


Introduction
Building on existing theoretical and empirical findings from a long tradition in subjective age (SA) research, this paper addresses the directions of longitudinal associations between domains of SA, wellbeing and physical health in the second half of life. SA is a core indicator of the individual ageing experience, with important anticipated consequences for successful ageing in older adults (Kastenbaum et al., Reference Kastenbaum, Derbin, Sabatini and Artt1972; Kleinspehn-Ammerlahn et al., Reference Kleinspehn-Ammerlahn, Kotter-Gruhn and Smith2008; Kotter-Gruhn et al., Reference Kotter-Gruhn, Kornadt and Stephan2016). It reflects the cultural and personal meanings that a person relates to his or her age (Laslett, Reference Laslett1989), and gains particular importance in the second half of life, where attitudes towards ageing are assumed to become more self-relevant than actual age (Kornadt and Rothermund, Reference Kornadt and Rothermund2011; Settersten and Mayer, Reference Settersten and Mayer1997). Research on SA can be traced back to as far as the 1950s (Blau, Reference Blau1956) and has since then consistently shown that from early middle age onwards, an increasing proportion of people feel younger than their actual age, and would like to be even younger (Montepare and Lachman, Reference Montepare and Lachman1989; Hubley and Hultsci, Reference Hubley and Hultsci1994; Daatland, Reference Daatland and Ballesteros2007; Barak, Reference Barak2009). Wanting to be an age close to one's actual age (ideal age) reflects more positive self-perceptions of ageing and higher age satisfaction (Hubley and Hultsci, Reference Hubley and Hultsci1994; Kaufman and Elder, Reference Kaufman and Elder2002). Both felt age and ideal age are in empirical studies typically treated as components of SA (Uotinen, Reference Uotinen2005), but ideal age is less often studied.
Two overlapping theoretical perspectives commonly explain the propensity of older adults towards a more youthful SA: the lifecourse perspective and the lifespan developmental psychological perspective (Diehl et al., Reference Diehl, Wahl, Barrett, Brothers, Miche, Montepare, Westerhof and Wurm2014; Barrett and Montepare, Reference Barrett, Montepare, Diehl and Wahl2015; Settersten and Hagestad, Reference Settersten, Hagestad, Diehl and Wahl2015; Westerhof and Wurm, Reference Westerhof, Wurm, Diehl and Wahl2015; Kotter-Gruhn et al., Reference Kotter-Gruhn, Kornadt and Stephan2016). A central premise in both approaches is personal agency, which underlines that individuals reflect on their own development and interpret their ageing as they move across the lifespan (Settersten and Mayer, Reference Settersten and Mayer1997; Diehl et al., Reference Diehl, Wahl, Barrett, Brothers, Miche, Montepare, Westerhof and Wurm2014). Individuals of the same chronological age are therefore likely to experience age(ing) in different ways. The lifecourse perspective emphasises the social construction of broader life phases and associated age-based social norms (Settersten and Hagestad, Reference Settersten, Hagestad, Diehl and Wahl2015). Especially in cultures and life domains with more negative views on ageing, identifying with younger ages and younger age groups allows older adults to enhance their self-esteem and wellbeing (Weiss and Lang, Reference Weiss and Lang2012). According to the lifespan developmental psychological perspective, younger SA occurs when adults attempt to maintain self-continuity by integrating ongoing experiences in terms of previously established perceptions of the self, also termed identity assimilation (Sneed and Whitbourne, Reference Sneed and Whitbourne2003; Westerhof et al., Reference Westerhof, Whitbourne and Freeman2012).
Older adults’ inclination towards younger SA is assumed to have important consequences for successful ageing. Feeling younger than one's actual age is associated with lower mortality (Uotinen et al., Reference Uotinen, Rantanen and Suutama2005; Stephan et al., Reference Stephan, Sutin and Terracciano2018), improved neurocognitive health (Kwak et al., Reference Kwak, Kim, Chey and Youm2018) and cognitive functioning (Stephan et al., Reference Stephan, Sutin, Caudroit and Terracciano2016), better physical, self-rated and mental health (Spuling et al., Reference Spuling, Miche, Wurm and Wahl2013), higher life satisfaction, higher morale, less loneliness and higher self-esteem (Barak and Stern, Reference Barak and Stern1986). An ideal age that is below one's actual age is associated with worse mental health (Uotinen et al., Reference Uotinen, Suutama and Ruoppila2003; Keyes and Westerhof, Reference Keyes and Westerhof2012) poorer subjective health, lower life satisfaction and poorer functioning (Sargent-Cox et al., Reference Sargent-Cox, Anstey and Luszcz2014). Hence, whereas feeling younger may serve as a compensatory, adaptive strategy in response to ageing (Sneed and Whitbourne, Reference Sneed and Whitbourne2003) and thus contribute to mental and physical wellbeing (Barak and Stern, Reference Barak and Stern1986; Keyes and Westerhof, Reference Keyes and Westerhof2012; Westerhof and Barrett, Reference Westerhof and Barrett2005), wanting to be younger may function as a maladaptive strategy (Keyes and Westerhof, Reference Keyes and Westerhof2012).
Heuristic model
Combining theoretical and empirical findings on SA, Westerhof and Wurm (Reference Westerhof, Wurm, Diehl and Wahl2015) proposed a heuristic model for a psychological pathway linking self-perceptions of ageing to subjective wellbeing and functional health. According to this model ‘positive self-perceptions of ageing help to accumulate psychological resources and guide behavioural regulation, which supports health and longevity’ (Westerhof and Wurm, Reference Westerhof, Wurm, Diehl and Wahl2015: 152). In other words, feeling younger contributes to higher subjective wellbeing across time, which in turn, may result in better health. Similarly, wanting to be an age close to one's actual age reflects more positive self-perceptions of ageing and higher age satisfaction, leading to improved life satisfaction and, in turn, to better health. The model also opens up for reversed effects, i.e. loss of subjective wellbeing or health may affect subsequent SA (see e.g. Markides and Boldt, Reference Markides and Boldt1983; Sargent-Cox et al., Reference Sargent-Cox, Anstey and Luszcz2012). Figure 1 provides an overview over the main psychological pathway (bold arrows) proposed by Westerhof and Wurm. So far, these longitudinal pathways have not been examined explicitly in empirical studies. There is a need for longitudinal studies with more than two measurement occasions to test the heuristic model and to disentangle the direction of longitudinal pathways between SA, wellbeing and health (Mock and Eibach, Reference Mock and Eibach2011; Kotter-Gruhn et al., Reference Kotter-Gruhn, Kornadt and Stephan2016).
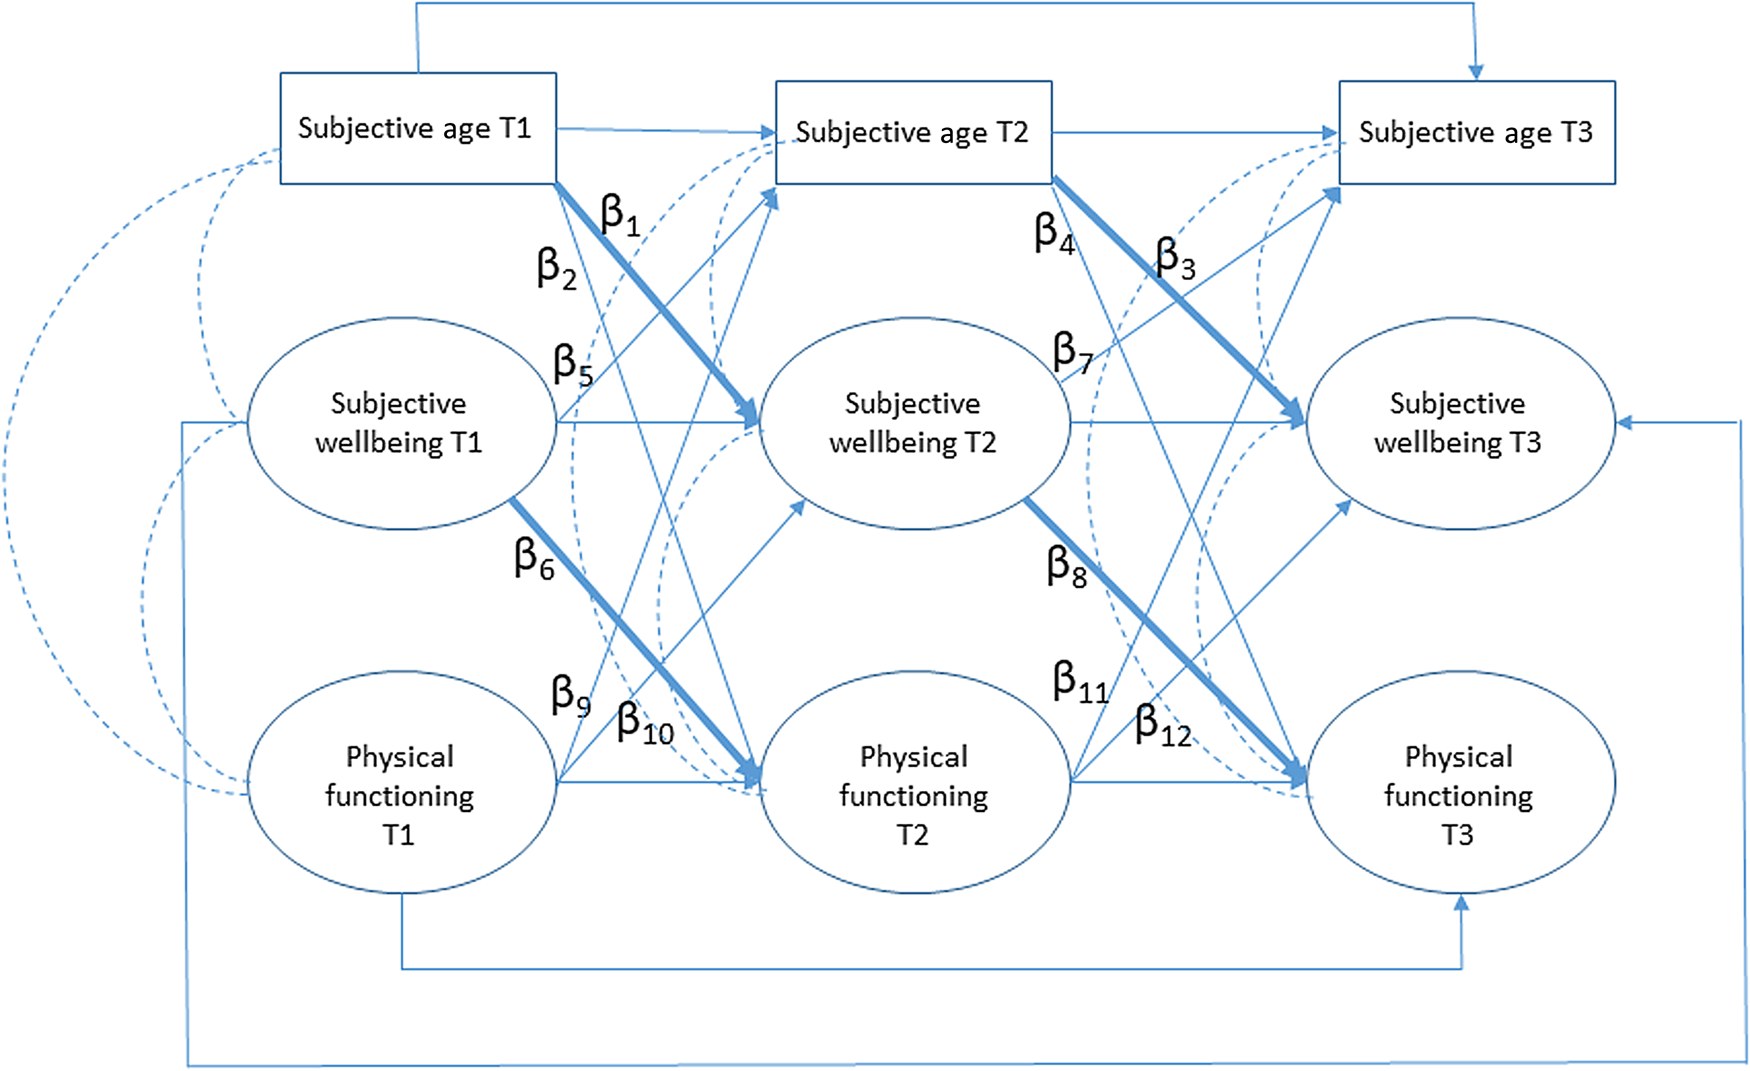
Figure 1. Operational model for the main proposed interrelations (bold arrows) of subjective-age discrepancies with subjective wellbeing and health over time (includes all correlations between constructs at the same measurement point).
Notes: T1: first wave of the Norwegian Lifecourse, Ageing and Generation study (NorLAG). T2: second wave of NorLAG. T3: third wave of NorLAG.
The current study addresses this need, using three-wave longitudinal survey data spanning a 15-year period, and aims to assess the direction of the longitudinal pathways between domains of SA, life satisfaction and physical functioning in older adults. Thus, our study contributes to the research field in at least three ways: (a) expanding the prevailing empirical focus on felt age by including ideal age; (b) using a structural equation approach to longitudinal three-wave cross-lagged models to disentangle the direction of longitudinal pathways between SA, life satisfaction and health; and (c) assessing the mediating role of life satisfaction in the temporal relation between SA and health. The results may provide new and more accurate information about the role of SA in adaptation and resilience in later life (Wurm et al., Reference Wurm, Diehl, Kornadt, Westerhof and Wahl2017).
Design and methods
Sample
We used the three waves (2002, 2007 and 2017) of the longitudinal Norwegian Lifecourse, Ageing and Generation study (NorLAG). Survey data collection consisted of an initial telephone interview followed by a self-completion questionnaire, which in 2017 was available in a Web-based as well as postal format. In addition, data from the public registers are linked to individual survey data. Study participation and linkages to public register data are based on informed consent. The first wave of NorLAG (NorLAG1) was collected during 2002 and 2003 and included respondents born between 1922 and 1961 (response rate 67%). The second wave of NorLAG (NorLAG2) was conducted during 2007 and 2008 and is part of the United Nations-initiated Generations and Gender Survey. In addition to including the gross sample of NorLAG1, NorLAG2 was supplemented with a refreshment sample and included respondents born between 1922 and 1988 (response rate 61%). Compared to NorLAG1, older respondents, those with low education, low income and poor health are more likely to drop out in the second wave. The third wave of NorLAG (NorLAG3) was collected in 2017. Eligible participants were those born between 1922 and 1966, who had responded to at least one of the two previous waves (NorLAG1 and/or NorLAG2). The response rate for NorLAG3 was 68 per cent. For detailed information about NorLAG's study design, samples, response rates and procedures, see Holmøy (Reference Holmøy2004), Bjørshol and Lagerstrøm (Reference Bjørshol and Lagerstrøm2010) and Torsteinsen and Holmøy (Reference Torsteinsen and Holmøy2019).
A total of 2,330 individuals born between 1922 and 1961 responded to all three waves of NorLAG, but the current analyses are based on 6,292 persons who responded to at least one wave, and who were not part of the supplementary sample in NorLAG2. Of these, 5,555 persons participated in NorLAG1, 4,502 in NorLAG2 and 3,021 in NorLAG3; 1,352 respondents were deceased by 2017, of whom 264 were deceased between the first and second waves, and 1,088 between the second and third waves of data collection. Table 1 illustrates the sample characteristics for respondents at each wave, baseline (NorLAG1) characteristics for those who responded to all three waves and for those who died during follow-up. There were no gender differences in the likelihood to respond to all three waves compared to those who responded to one or two waves (χ2(1) = 0.096, p = 0.757). Those who responded to all three waves were younger (t = 23.19, p < 0.001) and more likely to be higher educated (χ2(1) = 349,82, p < 0.001). Respondents who died during follow-up were more likely to be older, male and have basic education. In the analyses of the current paper, we used all available data at each time-point, meaning that respondents were part of the analyses if they had participated at least once.
Table 1. Study sample across three waves of the Norwegian Lifecourse, Ageing and Generation study (NorLAG) without the refreshment sample of the second wave (NorLAG2) (respondents born between 1922 and 1961)
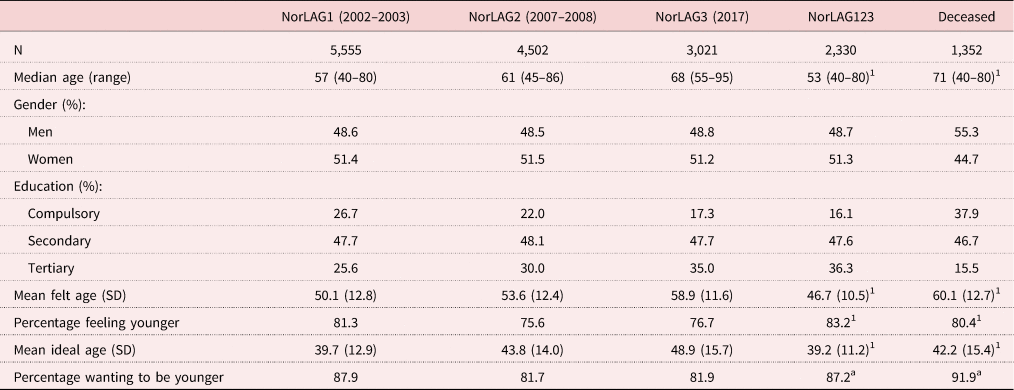
Notes: Respondents were born between 1922 and 1961. 1. Values at the first wave (NorLAG1). SD: standard deviation.
Measures
Chronological age and SA
Information on respondents’ chronological age at time of interview was derived from the public registers and linked to the survey data. NorLAG includes two dimensions of SA: felt age and ideal age. Felt age was assessed with the item: ‘What age do you usually feel?’ Ideal age was measured by asking: If you could choose your age, what age would you like to be? Both items were part of the self-completion questionnaire (postal or Web). In both instances, respondents wrote down the age in number of years, which provides information on the direction as well as the magnitude of the SA discrepancy. For each dimension we calculated the difference between SA and chronological age. Negative discrepancy values thus indicate that a person feels or wants to be younger than his or her chronological age.
Life satisfaction
Life satisfaction is one of the components of subjective wellbeing. Life satisfaction in NorLAG is measured with four items of the Satisfaction With Life Scale (Pavot et al., Reference Pavot, Diener, Colvin and Sandvik1991): In most ways my life is close to my ideal; The conditions of my life are excellent; So far I have gotten the important things I want in life; and I am satisfied with my life. This scale is designed to measure global cognitive judgements of one's life satisfaction (not a measure of either positive or negative affect). The fourth item (I am satisfied with my life) was measured through the telephone interview, whereas the remaining three items were part of the self-completion survey. Respondents indicated how much they agreed or disagreed with each of the four items using a five-point scale that ranges from 1 (strongly agree) to 5 (strongly disagree). For the purposes of the present paper, we recoded item values so that higher values indicated higher life satisfaction. Items can be summed into a summary scale ranging from 4 to 20, with higher values indicating higher life satisfaction. Cronbach's coefficient alpha was 0.81 in all three waves.
Physical functioning
Physical functioning was measured by the two physical functioning items of the Short Form-12, indicating the extent to which health limits the respondent in (a) climbing several flights of stairs and in (b) moderate activities, such as moving a table, vacuum cleaning, going for a walk or gardening (Ware et al., Reference Ware, Kosinski and Keller1996). Response categories are yes a lot (1), yes a little (2) and no not at all (3). The Short Form-12 was part of the telephone interview. For descriptive purposes in this paper, we summated items into a summary scale ranging from 2 to 6, with higher values indicating less limitations in physical functioning. The correlations between the two items of the physical functioning scale were 0.66 at NorLAG1, 0.68 at NorLAG2 and 0.63 at NorLAG3.
Possible confounders
Gender, chronological age and education (as a marker of socio-economic status) were used as covariates in the structural equation panel models. Previous studies have provided limited and conflicting support for the association of gender and education with measures of SA. However, all three covariates tend to be related to measures of wellbeing and functional health and were therefore included in the models as possible confounders of the relationships between SA, life satisfaction and physical functioning. Information about the respondents’ gender and level of education (Norwegian Standard Classification of Education Revised 2000) was derived from the public registries that are linked to the NorLAG survey data. Educational attainment consists of five categories: compulsory education, basic upper secondary education, final upper secondary education, first-stage tertiary education (undergraduate) and graduate/postgraduate education. In the current paper, education was grouped into three categories: compulsory (1), secondary (2) and tertiary (3).
Statistical analyses
We used descriptive statistics (t-test, χ2-test, Pearson correlations and analysis of variance) and conducted multi-level modelling for longitudinal data, with random intercept and random slope models using maximum likelihood estimation to describe time-related change in felt-age and ideal-age discrepancies across the three waves.
To disentangle the pathways between SA, life satisfaction and physical functioning over time, we applied structural equation modelling (SEM). SEM analyses were conducted with Mplus (Muthén and Muthén Reference Muthén and Muthén2012). We used a full information maximum likelihood (FIML) estimator (MLR, maximum likelihood estimation with robust standard errors) to account for non-normal data and missing observations, which means that all available data are included in the analyses, regardless of whether respondents had missing observations. FIML is generally considered a superior method for dealing with missing data in SEM, especially compared to list-wise deletion (Enders and Bandalos, Reference Enders and Bandalos2001). We conducted bootstrapping based on 5,000 bootstrapped samples to obtain precise estimation of the standard errors (SE) and 95 per cent confidence intervals (CI) of the effects, as these are likely to be biased if a model contains mediators (Preacher and Hayes, Reference Preacher and Hayes2008). Figure 1 shows the main anticipated pathways from the domains of SA to life satisfaction and physical functioning. We specified three-wave, three-variable cross-lagged panel models for felt-age and ideal-age discrepancies. SEM is particularly suitable for these purposes as it can cope with reversed causation and confounding variables (Zapf et al., Reference Zapf, Dormann and Frese1996). For all models, the reversed pathways were also included in the analyses, i.e. from health and life satisfaction to subsequent SA, and we controlled for gender, education and chronological age at baseline. Another advantage of SEM is that it takes measurement error into account and allows for the explicit modelling of autocorrelation (Bollen, Reference Bollen1989). We estimated correlations between error terms over time, which provides partial compensation for the effect of unmeasured variables related to SA, life satisfaction and physical functioning, thereby reducing the risk of spurious results. The correlations between constructs measured at the same measurement occasion were also included. Prior to the cross-lagged models we assessed the validity of the measurement models for life satisfaction and physical functioning within the waves, and imposed equality constraints on the corresponding factor loadings across the three waves to examine measurement-invariance. All models included autocorrelation between the measurement errors of similar items across all three time-points.
We used the following criteria to evaluate the fit between the hypothesised models and observed data: (a) average residual correlations as measured by the root mean square error of approximation (RMSEA), where RMSEA below 0.05 represents a close fit, RMSEA between 0.05 and 0.08 indicates a reasonable model fit and RMSEA higher than 0.10 indicates an unacceptable model; (b) Tucker–Lewis Index (TLI) and Comparative Fit Index (CFI) above 0.95; and (c) standardised root mean square residual (SRMR) less than or equal to 0.08 (Hu, Reference Hu1999).
Results
A description of the sample characteristics and the core variables at each of the three waves is shown in Table 1. Chronological age at Time 1 (T1; 2002–2003) ranged from 40 to 80 years at time of interview, with a median age of 57 years. The majority of respondents reported feeling younger (76–81% across the three waves) and wanting to be younger than their actual age (82–88% across the three waves). Figure 2 illustrates the mean scores for felt-age and ideal-age discrepancies for men and women across two cohorts (1922–1945 and 1946–1961). The curves for felt-age discrepancies indicated that discrepancies were slightly increasing over time in all groups, with overlapping curves for men and women from the oldest cohort. Compared to the patterns for felt-age discrepancies, the curves for ideal-age discrepancies showed larger variation across cohorts and gender. Younger cohorts had a somewhat steeper increase in ideal-age discrepancies over time compared to older cohorts.

Figure 2. Mean scores for (a) felt-age and (b) ideal-age discrepancies across the three waves of the Norwegian Lifecourse, Ageing and Generation study (NorLAG), for men and women across two birth cohorts.
Notes: NorLAG1: first wave of NorLAG, 2002–2003. NorLAG2: second wave of NorLAG, 2007–2008. NorLAG3: third wave of NorLAG, 2017.
Table 2 shows the means, standard deviations and bivariate correlations of the core study variables. At T1, respondents felt on average 7.5 years younger than their actual age and wanted, on average, to be 17.9 years younger. At T3, approximately 15 years later, the corresponding average discrepancies were 8.9 and 18.9 years, respectively. Bivariate correlations between felt-age and ideal-age discrepancies ranged between 0.20 and 0.27 across the three measurement occasions. Higher age was correlated with larger felt-age as well as larger ideal-age discrepancies. Women had smaller felt-age and ideal-age discrepancies, and lower levels of physical functioning compared to men. The bivariate correlations of felt-age discrepancies with gender and education were, however, small and not statistically significant for T1. Higher levels of education were associated with smaller discrepancies in both felt age and ideal age, and educational attainment was positively correlated with life satisfaction and physical functioning. The negative bivariate correlations of felt-age discrepancies with life satisfaction and physical functioning indicated that feeling younger than ones actual age was associated with higher life satisfaction and better physical functioning. The positive bivariate correlations of ideal-age discrepancies with life satisfaction and physical functioning illustrated that wanting to be increasingly younger than your chronological age was associated with lower life satisfaction and worse physical functioning.
Table 2. Descriptives and bivariate correlations of the study variables
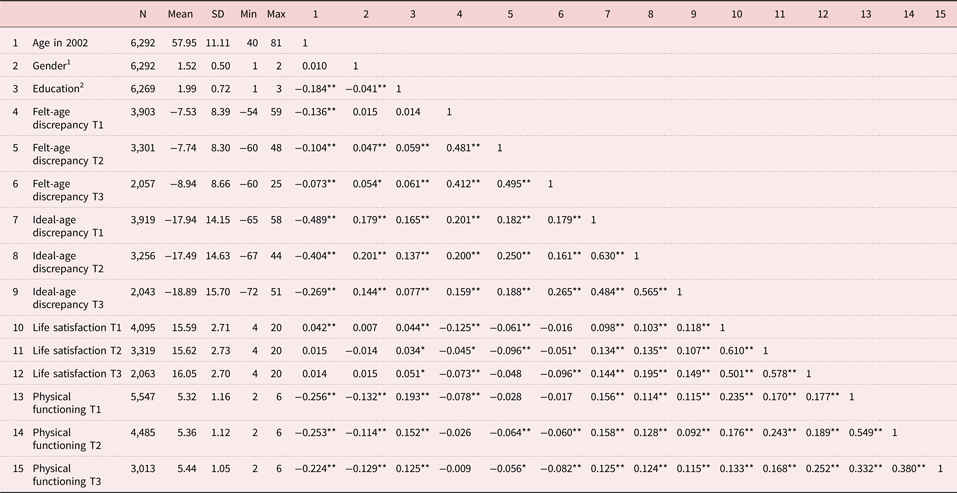
Notes: 1. Men = 0, women = 1. 2. Compulsory = 1, secondary = 2, tertiary = 3. SD: standard deviation. Min: minimum. Max: maximum. T1: first wave of the Norwegian Lifecourse, Ageing and Generation study (NorLAG). T2: second wave of NorLAG. T3: third wave of NorLAG.
Significance levels: *p < 0.05, **p < 0.01.
Additional multi-level analyses showed that, over a period of 15 years, felt-age and ideal-age discrepancies increased over time. For felt age, the average increase was 0.95 additional year younger for each wave, a total of 1.9 years over a 15-year period (see Table S1 in the online supplementary material). For ideal age, there was an average increase of 1.64 additional years younger per wave. The random slopes (6.33 and 17.12) suggested significant individual differences in the direction and rate of change in both felt-age and ideal-age discrepancies. In addition to an average increase over time, some individuals remain stable, whereas some show a decrease and others an increase in SA discrepancies.
Three-wave, three-variable cross-lagged panel models
SEM analyses supported the validity of the measurement models for life satisfaction and physical functioning. For both latent constructs (life satisfaction and physical functioning), a model allowing for error correlations and constraining the factor loadings to be equal across time did yield good model fit. Fit statistics for life satisfaction were: RMSEA = 0.025 (95% CI = 0.022, 0.028), CFI = 0.987, TLI = 0.981, SRMR = 0.039. Fit statistics for physical functioning were: RMSEA = 0.012 (95% CI = 0.000, 0.027), CFI = 0.999, TLI = 0.997, SRMR = 0.015.
Table 3 shows the standardised coefficients for the cross-lagged effects (β), the 95 per cent CI and associated p-values, and provides an overview of the fit-statistics for the cross-lagged models of felt-age and ideal-age discrepancies with life satisfaction and physical functioning. Both cross-lagged models showed good model fit. An illustration of the statistically significant (p < 0.05) longitudinal pathways between felt-age discrepancies, life satisfaction and physical functioning is shown in Figure 3. None of the cross-lagged effects involving felt-age discrepancies were statistically significant. In other words, felt-age discrepancies affected neither life satisfaction nor physical functioning over time. These cross-lagged pathways are therefore not displayed in Figure 3. The reversed cross-lagged effects, from health or life satisfaction to felt-age discrepancies, were not statistically significant either.
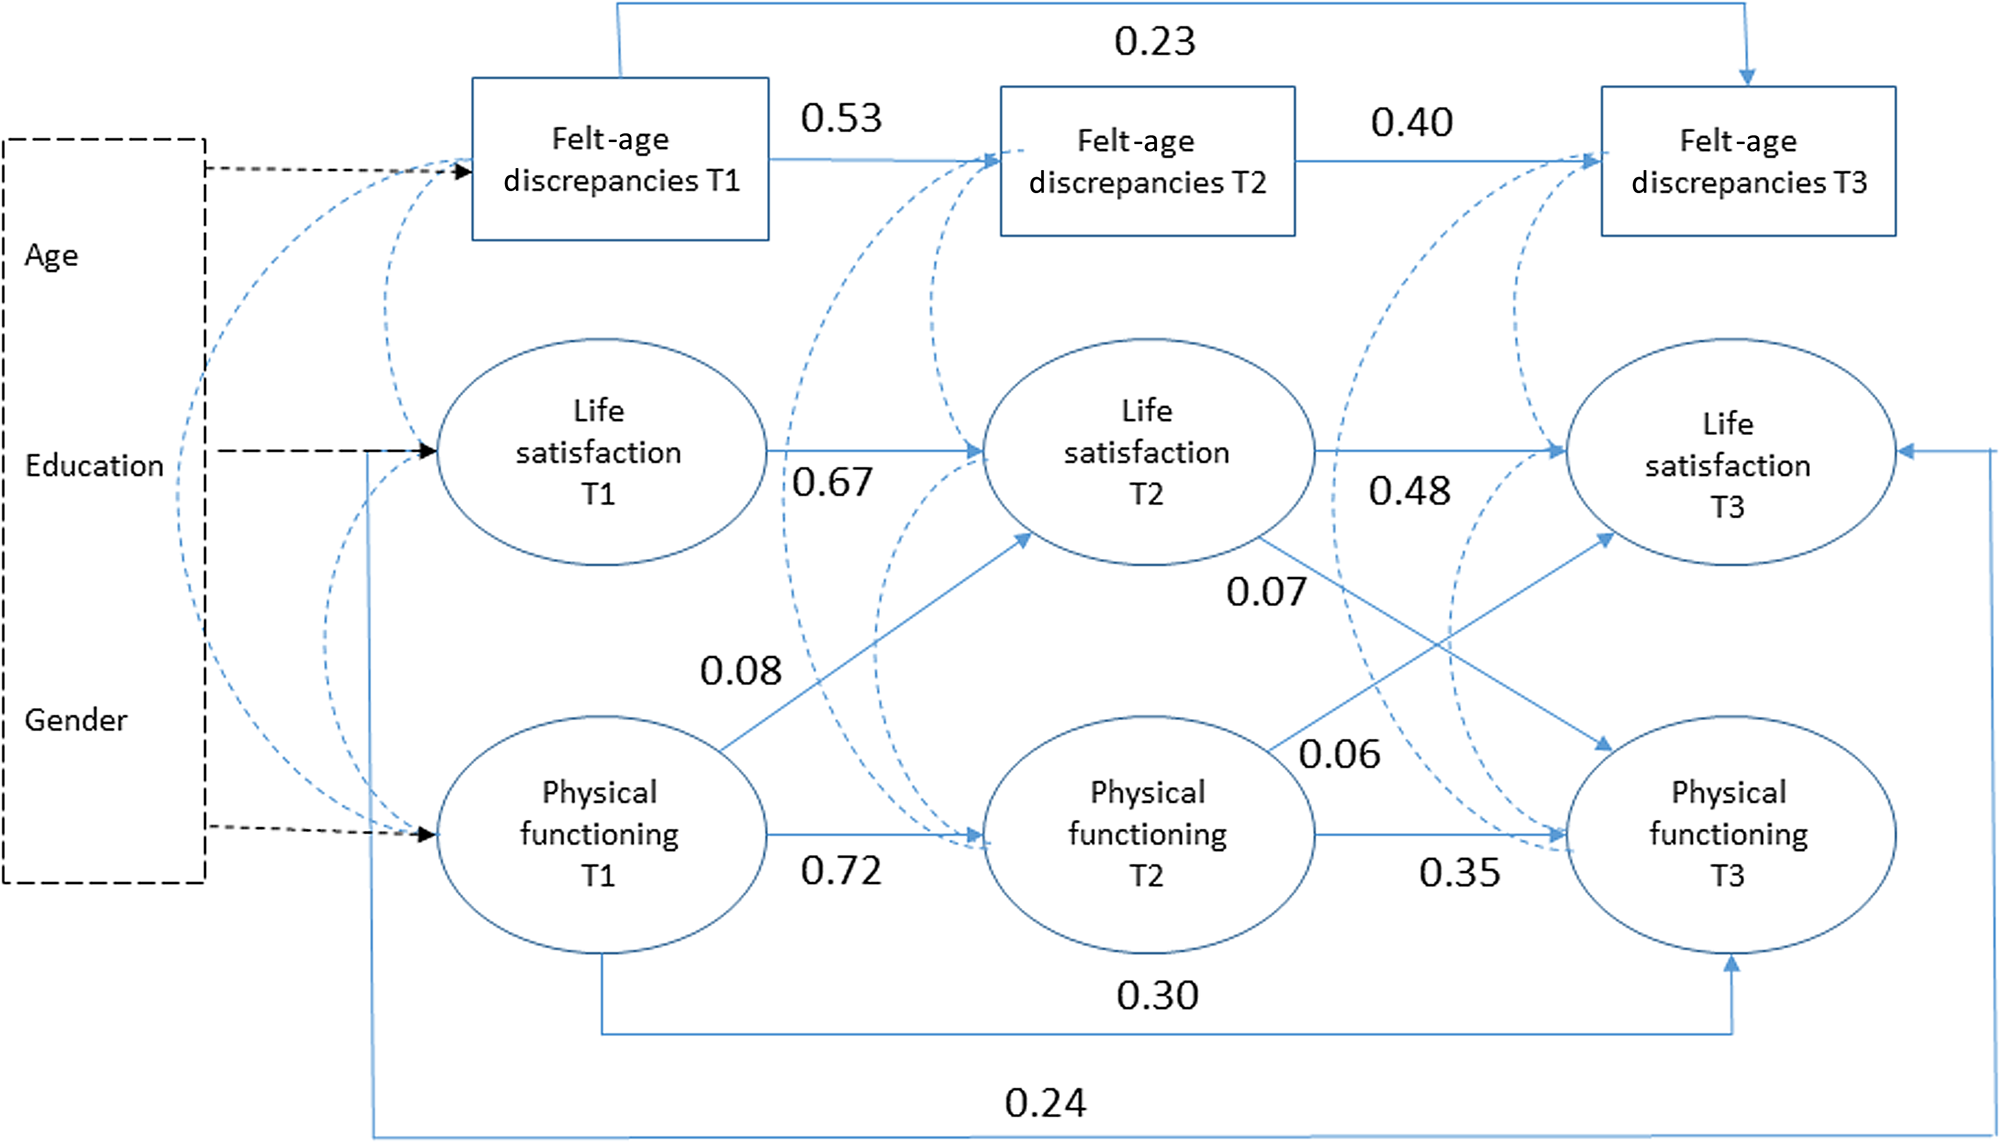
Figure 3. Three-wave cross-lagged model for felt-age discrepancies, life satisfaction and physical functioning (standardised coefficients).
Notes: Cross-lagged models were adjusted for gender, education and chronological age at baseline. Measurement errors are not shown. All cross-lagged effects were estimated. Only statistically significant paths are shown. T1: first wave of the Norwegian Lifecourse, Ageing and Generation study (NorLAG). T2: second wave of NorLAG. T3: third wave of NorLAG.
Table 3. Standardised cross-lagged effects (β) between two domains of subjective age, life satisfaction and physical functioning, and fit statistics
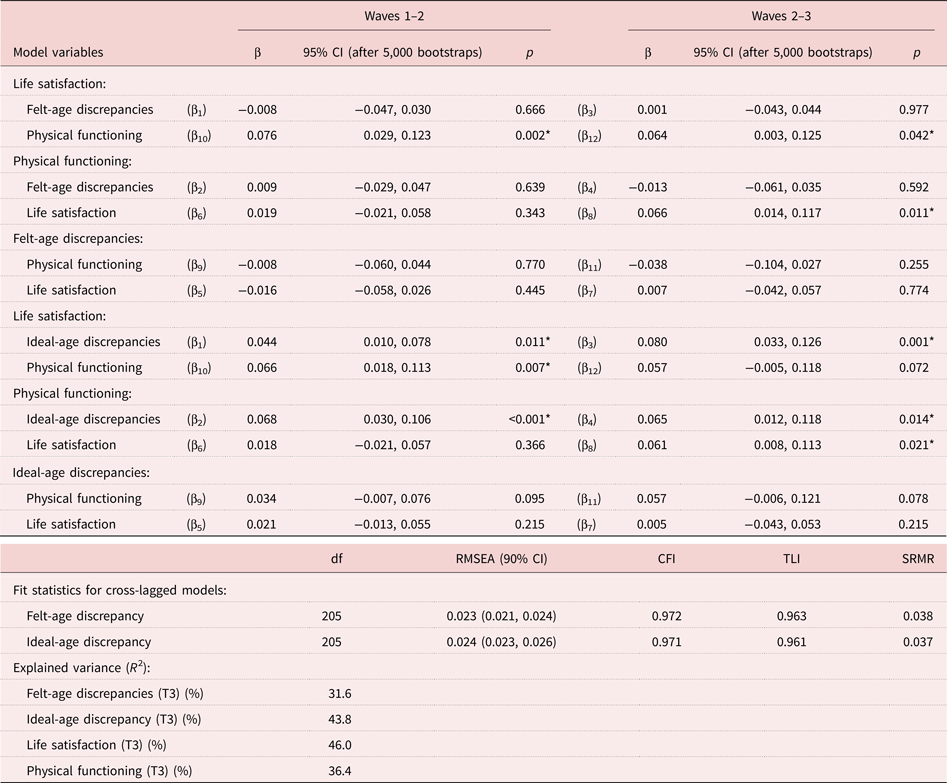
Notes: Cross-lagged panel models were adjusted for age, gender and education. All estimates are based on robust maximum likelihood (MLR) with full information maximum likelihood (FIML) estimation. (βx) refers to pathways in Figure 1. CI: confidence intervals. df: degrees of freedom. RMSEA: root mean square error of approximation. CFI: Comparative Fit Index. TLI: Tucker–Lewis Index. SRMR: standardised root mean square residual. T3: third wave of the Norwegian Lifecourse, Ageing and Generation study.
Significance level: p < 0.05.
Figure 4 shows the standardised coefficients for the statistically significant (p < 0.05) cross-lagged effects of ideal-age discrepancies. The anticipated temporal effects from ideal-age discrepancies to subsequent life satisfaction and physical functioning were statistically significant. Wanting to be an age closer to your actual age was associated with higher life satisfaction and better physical functioning five and ten years later. The indirect effect of ideal-age discrepancies on physical functioning through life satisfaction was, however, not statistically significant (βindirect = 0.003; 95% CI = −0.001, 0.006). We found no evidence for reversed effects, i.e. from physical functioning or life satisfaction to subsequent ideal-age discrepancies. The total explained variance was 31.6 per cent for felt-age discrepancies, 43.8 per cent for ideal-age discrepancies, 46.0 per cent for life satisfaction and 36.4 per cent for physical functioning.
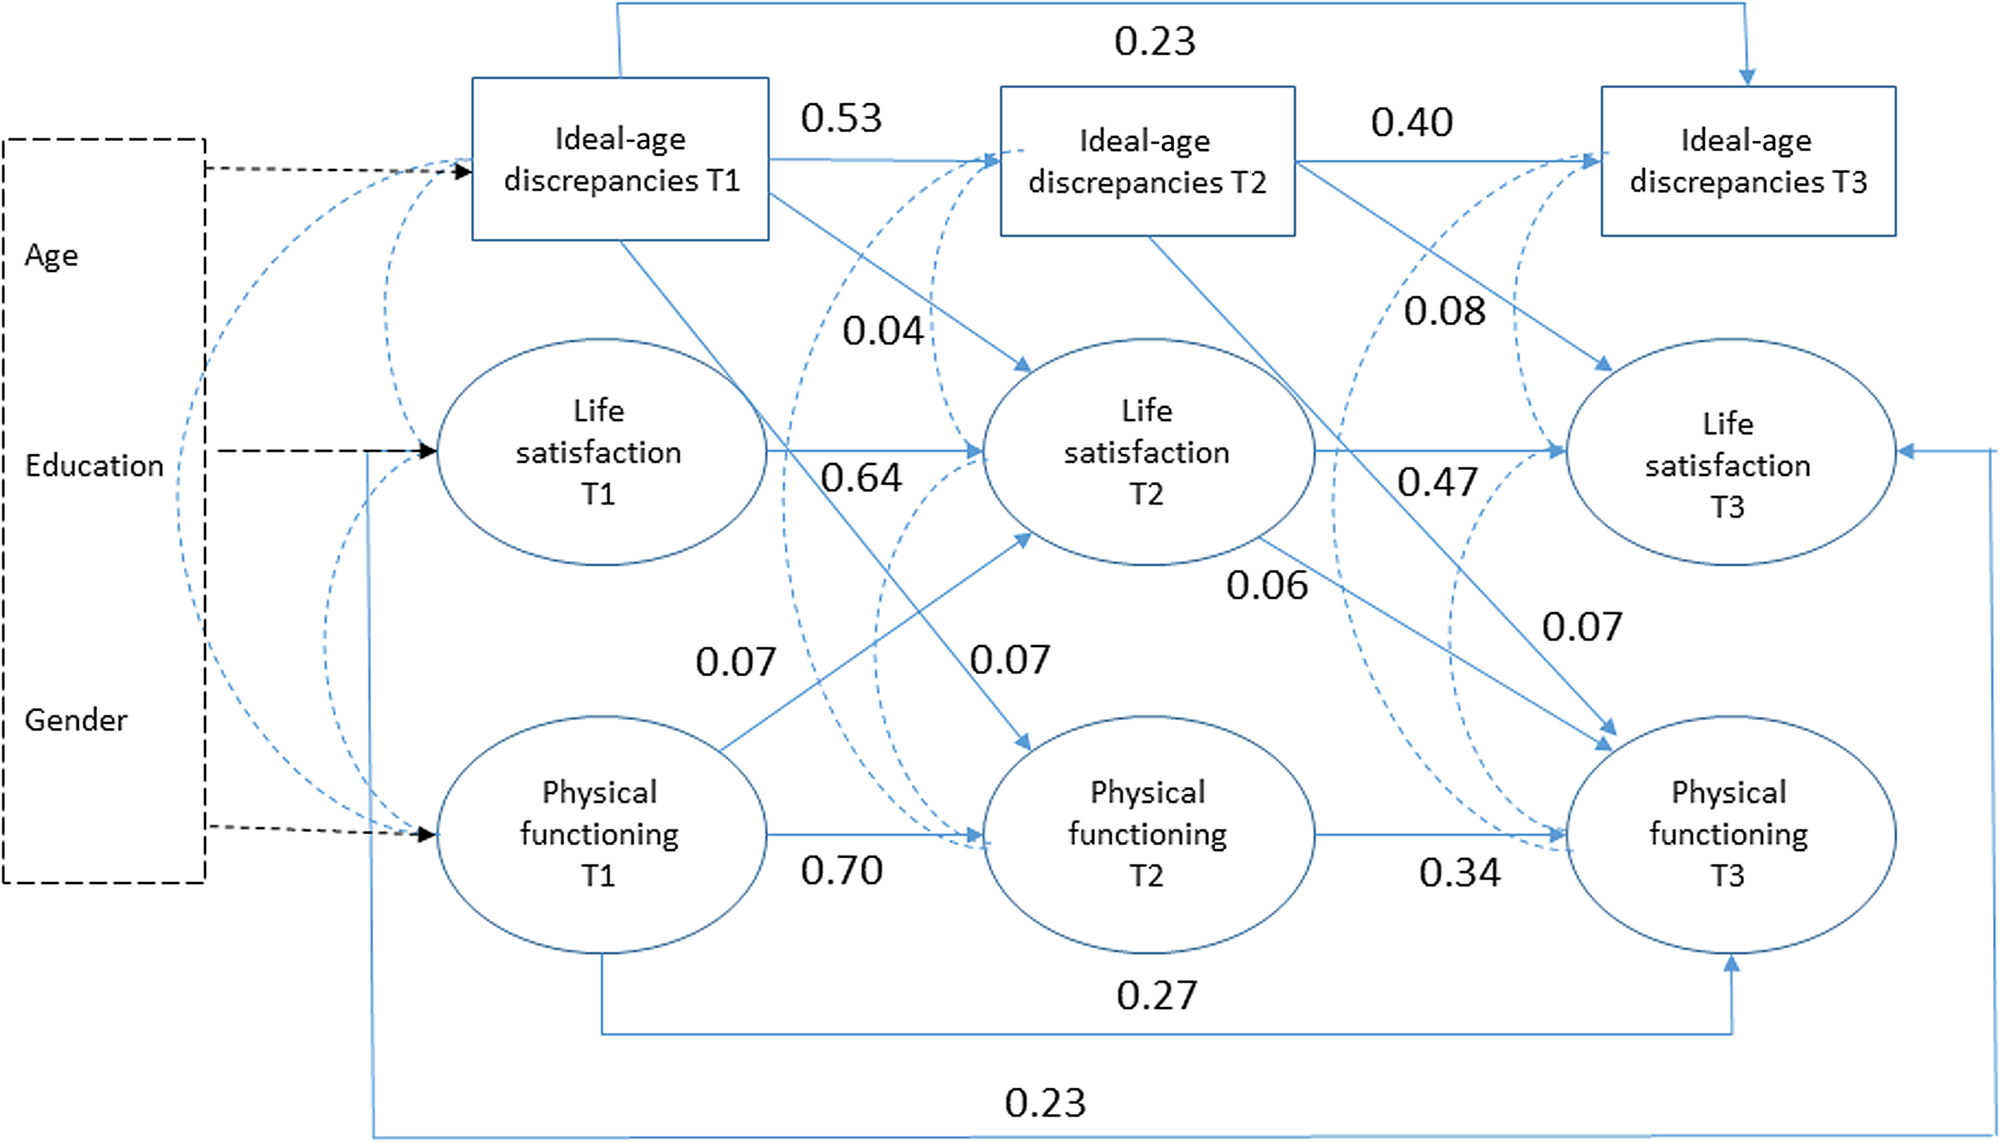
Figure 4. Three-wave cross-lagged model for ideal-age discrepancies, life satisfaction and physical functioning (standardised coefficients).
Notes: Cross-lagged models were adjusted for gender, education and chronological age at baseline. Measurement errors are not shown. All cross-lagged effects were estimated. Only statistically significant paths are shown. T1: first wave of the Norwegian Lifecourse, Ageing and Generation study (NorLAG). T2: second wave of NorLAG. T3: third wave of NorLAG.
Discussion and implications
Using large-scale three-wave national survey data spanning 15 years, the findings from the current study provided partial support for the heuristic model suggested by Westerhof and Wurm (Reference Westerhof, Wurm, Diehl and Wahl2015). Wanting to be younger than your actual age contributed to lower life satisfaction over time, and subsequently to lower physical functioning. This longitudinal association was present even after controlling for potential reciprocal effects and possible known confounders. The results can also be interpreted in terms of age satisfaction (i.e. wanting to be your actual age or an age close to your actual age). Greater age satisfaction was associated with higher life satisfaction over time, and contributed to better physical functioning. Felt-age discrepancies, however, were not associated with life satisfaction and physical functioning over time. Below we discuss our results in relation to findings from previous studies and interpret them in terms of lifecourse and lifespan developmental psychological perspectives.
Tendency towards younger SA
Consistent with the existing literature, respondents in the present study reported feeling younger (Gana et al., Reference Gana, Alaphilippe and Bailly2004; Rubin and Berntsen, Reference Rubin and Berntsen2006; Kleinspehn-Ammerlahn et al., Reference Kleinspehn-Ammerlahn, Kotter-Gruhn and Smith2008) and wanting to be younger (Uotinen et al., Reference Uotinen, Rantanen, Suutama and Ruoppila2006) than their chronological age. Average felt-age discrepancies in our study were between −7.5 and −8.9 years. The size of these discrepancies corresponds to findings from the study on Midlife in the United States (MIDUS), including age groups 25–74 years (Keyes and Westerhof, Reference Keyes and Westerhof2012), as well as the study from Uotinen et al. (Reference Uotinen, Rantanen, Suutama and Ruoppila2006) which comprised persons aged 65–85 years. On the other hand, they were smaller than the felt-age discrepancies found in the study by Kleinspehn-Ammerlahn (Reference Kleinspehn-Ammerlahn, Kotter-Gruhn and Smith2008), which included older age groups (70–104 years). Average ideal-age discrepancies in our study were between −17.9 and −18.9 years. This level of ideal-age discrepancies is in line with findings from studies using somewhat older (Uotinen et al., Reference Uotinen, Rantanen, Suutama and Ruoppila2006) as well as younger (Keyes and Westerhof, Reference Keyes and Westerhof2012) samples. Our study also indicated that, over a 15-year period, people felt, on average, increasingly younger and wanted to be increasingly younger than their actual age. Stability in discrepancy scores would require respondents to report older SAs at each subsequent wave, corresponding to the elapsed number of years. Although average felt age as well as ideal age in our study increased over time, it did not compensate fully, leading to an average increase in SA discrepancies. The increase in ideal-age discrepancies is consistent with findings from Kleinspehn-Ammerlahn (Reference Kleinspehn-Ammerlahn, Kotter-Gruhn and Smith2008), who reported a reduction in age-satisfaction as people grow older. The increase in felt-age discrepancies differs from previous longitudinal findings which reported relatively stable felt-age discrepancies over time (Uotinen et al., Reference Uotinen, Rantanen, Suutama and Ruoppila2006; Kleinspehn-Ammerlahn et al., Reference Kleinspehn-Ammerlahn, Kotter-Gruhn and Smith2008). Potential explanations for this different finding may be related to the national context (Norway versus Germany), the longer follow-up period (15 years rather than six years) or it may be due to the sample in our study being somewhat younger (i.e. younger than age 65 at baseline).
Longitudinal pathways between SA, life satisfaction and health
The cross-lagged analyses in our study indicated evidence for a temporal psychological pathway from smaller ideal-age discrepancies to higher life satisfaction and better subsequent physical functioning. This tendency is in line with the proposed heuristic model, stating that positive self-perceptions of ageing help to accumulate psychological resources that support health (Westerhof and Wurm, Reference Westerhof, Wurm, Diehl and Wahl2015). It is also consistent with other recent empirical findings on the psychological pathway suggesting that self-perceptions of ageing affect physical functioning (Carmel et al., Reference Carmel, Tovel and Raveis2017). The effects are, however, relatively small, and the direct test of the mediating temporal effect from ideal-age discrepancies → life satisfaction → physical functioning was not statistically significant.
Our findings illustrated that dissatisfaction with age(ing), which may reflect an inability of identity-accommodation, constitutes a maladaptive pathway that becomes more dysfunctional as people age. Wanting to be younger may also reflect identity assimilation, holding on to the identity of a younger self and thus only selecting information and/or behaviour that enables the maintenance of this younger identity. Such assimilation may be the result of older adults’ confrontation with age stereotypes (Kotter-Grühn and Hess, Reference Kotter-Grühn and Hess2012). To the extent that this induced behaviour is maladaptive, it results in reduced wellbeing and health over time. This interpretation is in line with findings from Wurm et al. (Reference Wurm, Warner, Ziegelmann, Wolff and Schüz2013), who found that negative self-perceptions of ageing undermined older adults’ compensatory behaviours while they coped with a serious health event. Self-perceptions of ageing are strongly affected by age stereotypes (Levy, Reference Levy2009). The stereotype age norms prevailing in society, in this case Norway, may make it difficult to adopt an older identity without losing a feeling of continuation of one's self-perception (Settersten and Hagestad, Reference Settersten, Hagestad, Diehl and Wahl2015). Wanting to be an age significantly younger than one's actual age could thus reflect de-identification with one's chronological age group. This, in turn, has detrimental effects on all areas of life, including wellbeing and physical functioning. The evidence for the longitudinal pathways in the current study suggest support for interventions or preventive health-promotion programmes targeting adults’ negative views on ageing (Brothers and Diehl, Reference Brothers and Diehl2017; Levy and Slade, Reference Levy and Slade2018).
In contrast to ideal-age discrepancies, our study did not indicate any evidence for a pathway from felt-age discrepancies to life satisfaction and physical functioning, or vice versa, over time. This difference in findings for the two domains of SA underlined that felt-age discrepancies and ideal-age discrepancies measure two distinct components of SA. The lack of temporal associations of felt-age discrepancies with life satisfaction and physical functioning is somewhat inconsistent with findings from previous studies on, for example, mortality. A possible explanation is that the current study is the first rigorous longitudinal study of the temporal effects of felt-age discrepancies using three waves of survey data. Another explanation may be that pathways from felt-age discrepancies become relevant for wellbeing and health only when confronted with major life transitions or specific forms of loss (Diehl et al., Reference Diehl, Wahl, Barrett, Brothers, Miche, Montepare, Westerhof and Wurm2014).
Strengths and limitations
Important strengths of this study include the long-term follow-up with more than two measurement occasions and large-scale national survey data, which enabled a strong test of the longitudinal pathways from felt age as well as ideal age to life satisfaction and physical functioning in the second half of life. Another strength lies in the use of SEM as an analytical technique that accounts for the potential reciprocal nature of SA. The results from the current study consistently supported effects from SA to subsequent wellbeing and health, and found no evidence for temporal effects from life satisfaction or health to subsequent SA. The use of SEM has also illustrated that, although the construct of ideal-age discrepancies is associated with life satisfaction, it holds unique variance as well, and this way affects life satisfaction and physical functioning over time.
The current study has used a traditional approach of assessing SA, asking a single question for each of the two domains. Recent studies have advocated multi-dimensional or context-specific measures of SA that focus on specific life domains when asking people about their SA, such as physical and mental performance or SA in the workplace (Kornadt et al., Reference Kornadt, Hess, Voss and Rothermund2018). These studies emphasise how individual assessments of SA may vary across life domains or multiple contexts that are affected by various degrees of age stereotypes. Unfortunately, adopting new (and longer) measures of SA in an already-established longitudinal ageing study such as NorLAG would have been at the expense of already-existing measures and severely limited possibilities for assessing long-term longitudinal change in SA and its consequences for wellbeing and health. In addition, our study included data from one country, Norway, and findings may therefore be country specific, or representative for European countries with expansive welfare state arrangements across the whole lifecourse. For example, previous studies have suggested that the associations of SA with health and wellbeing may be less strong in countries with extensive welfare provisions, which tend to compensate to some degree for inequality in individual resources and characteristics (Westerhof et al., Reference Westerhof, Miche, Brothers, Barrett, Diehl, Montepare, Wahl and Wurm2014).
The lack of evidence for causal effects from felt-age discrepancies to subsequent wellbeing and health may also be due to the length of the observation period (the lag). Time lags of five and ten years may be too long, which could lead to an underestimation of the true causal impact of felt-age discrepancies (or the reciprocal effects). Selective attrition may be another explanation for limited causal effects. Respondents answering the questionnaires at more than one wave may represent a ‘survivor’ sample, where those with major declines in health and/or wellbeing drop out. This would lead to an underestimation of causal associations of SA with life satisfaction and physical functioning. However, the use of FIML in our analyses has limited the potential impact of selective attrition on the study findings.
In conclusion, our findings support the psychological pathway from satisfaction with age(ing) to subjective wellbeing and physical functioning over time. Which contexts and life transitions are likely to trigger (even) larger felt- and ideal- age discrepancies in men and women remains an empirical question for future research. This requires a different analytical approach than the current paper. Large-scale longitudinal ageing studies that have been developed from a lifecourse perspective are particularly well suited to study under what circumstances and for whom SA discrepancies induce maladaptive behaviour and reduced wellbeing or physical functioning over time. Such research on SA will help to further our understanding of its role in resilience and adaptation in later life.
Supplementary material
The supplementary material for this article can be found at https://doi.org/10.1017/S0144686X2000032X.
Data
The Norwegian Lifecourse, Ageing and Generation (NorLAG) data collections (doi:10.187/12norlag3_1) have been financed by The Research Council of Norway, four ministries, The Norwegian Directorate of Health, The Norwegian State Housing Bank, Statistics Norway and NOVA, OsloMet. NorLAG data are part of the ACCESS Life Course infrastructure funded by the National Financing Initiative for Research Infrastructure at the Research Council of Norway (grant numbers 195403 and 269920).
Conflict of interest
The authors declare no conflicts of interest.
Ethical standards
Norwegian Lifecourse, Ageing and Generation (NorLAG) data collections are conducted by Statistics Norway in line with legal regulations of the Personal Data Act. Ethical approval over and above data collection purposes is not required because the research data are considered anonymous.


 Open access