


INTRODUCTION
Dictatorships often engage in mass repression to control society. Several authoritarian regimes have demographically targeted repression to purge intellectuals, the educated, or middle-class members of society to weaken opposition movements. Whereas the political legacies of such repression are more often studied (Balcells Reference Balcells2012; Lupu and Peisakhin Reference Lupu and Peisakhin2017; Rozenas and Zhukov Reference Rozenas and Zhukov2019), the long-run developmental consequences—and the mechanisms of persistence—are less clear (Davenport et al. Reference Davenport, Nygård, Fjelde and Armstrong2019). Does mass repression have long-term developmental effects, and if so, why do the consequences persist?
I argue repression of educated members of society and skilled laborers undermines long-term economic development by undermining human capital. A paucity of skilled intellectuals in the aftermath of state violence places communities on diverging development paths: places more adversely impacted compensate for low-education levels with behaviors that reinforce low income—such as underinvesting in education, health, and specialized training—since doing so is too costly when starting from a level of extreme poverty and low education. The consequence of mass repression is a poverty trap.
Identifying the long-term effect of repression on economic welfare is challenging because state violence is strategically allocated. Both cross-national and within-country analyses may be biased by intervening events, diverging pre-trends, or the endogeneity of repression to local economic conditions (Sun Reference Sun2019).
I surmount identification issues by exploiting an administrative redistricting during the Democratic Kampuchea (DK) regime in Cambodia, which placed similar, nearby villages into the control of radically different cadres. DK divided a single combat theater into two governing zones, the West and the Southwest, along National Highway 4 (NR4) in Kampong Speu province. Villages on either side of the natural border were then governed by either Ta Mok in the Southwest zone—a brutal loyalist to the extreme doctrine of the dictator Pol Pot—or Sy in the West, who was a relatively more moderate communist.Footnote 1 Conditional on village proximity to the border, villages were arbitrarily assigned exposure to more or less intense state repression.
Using a geographic regression discontinuity design, I find villages in the more repressive zone are significantly poorer today ( $ 0.42\sigma $
, 20% of the control group mean). The results replicate while using administrative and nighttime lights data, at the village and individual level, and at different points in time. The estimates suggest a persistent wealth gap between former zones. The results are robust to alternative estimation windows, weighting kernels, and are not likely to be an artifact of spatial noise (Kelly Reference Kelly2020).
$ 0.42\sigma $
, 20% of the control group mean). The results replicate while using administrative and nighttime lights data, at the village and individual level, and at different points in time. The estimates suggest a persistent wealth gap between former zones. The results are robust to alternative estimation windows, weighting kernels, and are not likely to be an artifact of spatial noise (Kelly Reference Kelly2020).
Next, I evaluate channels of persistence. I argue repression that demographically targets the educated, which is not uncommon in authoritarian contexts or under coerced labor regimes more generally, creates a skill gap between generations, leaving a lacuna of trained and schooled individuals in a locality. The consequences reverberate overtime through a poverty trap mechanism, wherein people in poverty take actions that keep them poor because of constraints created by their lower income status.
I show evidence consistent with the poverty trap explanation, wherein the human capital shock from the regime’s repression reinforces behavior that keeps income lower in affected areas. I find literacy and education rates are much lower in the former Southwest (0.50 $ \sigma $
) in 1998. Specifically, I show age cohorts whose secondary schooling years overlapped with the Khmer Rouge experience the largest drop in education in the former Southwest (extreme) zone. Consistent with qualitative evidence that links generational skill gaps to contemporary Cambodian poverty (Jeong Reference Jeong2014; Kerbo Reference Kerbo2014), I find persons living in the former Southwest are more likely to be informally employed, earn less, and have lower productivity. Further, I show intergenerational consequences by finding child health is lower in the Southwest, which is a key predictor of future socioeconomic status.
$ \sigma $
) in 1998. Specifically, I show age cohorts whose secondary schooling years overlapped with the Khmer Rouge experience the largest drop in education in the former Southwest (extreme) zone. Consistent with qualitative evidence that links generational skill gaps to contemporary Cambodian poverty (Jeong Reference Jeong2014; Kerbo Reference Kerbo2014), I find persons living in the former Southwest are more likely to be informally employed, earn less, and have lower productivity. Further, I show intergenerational consequences by finding child health is lower in the Southwest, which is a key predictor of future socioeconomic status.
I draw from a variety of data sources to evaluate other causal mechanisms linking poverty to historical repression. Scholarship on the developmental legacies of coercive institutions suggest several persistence channels, including institutional path dependence (political competition, public goods provision (Dell Reference Dell2010), and conflict over property rights (Guardado Reference Guardado2018) and cultural persistence (social trust; Lowes and Montero Reference Lowes and Montero2021).
Using data on elections, newly collected data on land disputes, survey data on community trust, and georeferenced data on public goods access, I find no evidence of persistence via commonly cited pathways. The finding suggests poverty traps are a unique channel that may be added to the library of mechanisms linking coercion to contemporary development.
My study contributes to three sets of literature. First, I add to debates about the legacies of state repression (Balcells Reference Balcells2012; Lupu and Peisakhin Reference Lupu and Peisakhin2017; Rozenas and Zhukov Reference Rozenas and Zhukov2019). As Davenport et al. (Reference Davenport, Nygård, Fjelde and Armstrong2019, 374) recently argued, “substantially more research is needed to uncover whether and how repression hurts economies.” Research on the developmental impact of repression is divided. Some show positive impacts of state violence for decedents of victims and surrounding communities (Becker et al. Reference Becker, Grosfeld, Grosjean, Voigtländer and Zhuravskaya2020; Toews and Vézina Reference Toews and Vézina2020), while others show null (Charnysh and Finkel Reference Charnysh and Finkel2017; Rogall and Yanagizawa-Drott Reference Rogall and Yanagizawa-Drott2013) or negative long-term effects (Acemoglu, Hassan, and Robinson Reference Acemoglu, Hassan and Robinson2011; Lichter, Löffler, and Siegloch Reference Lichter, Löffler and Siegloch2021; Meng and Qian Reference Meng and Qian2009; Naumenko Reference Naumenko2019; Zeng and Eisenman Reference Zeng and Eisenman2018).
My study shows repression can cause underdevelopment when victims are targeted in a way that changes underlying factors of production—specifically human capital. I highlight how the state’s objectives during repression determine the direction of the relationship. The argument is also related to the large literature on the economic consequences of civil war, where scholars debate whether civil conflict can improve economic well-being by reducing inequality (Scheidel Reference Scheidel2018), or if it undermines development by reducing human capital (Blattman and Miguel Reference Blattman and Miguel2010; Chamarbagwala and Morán Reference Chamarbagwala and Morán2011; Justino Reference Justino2011).
Next, my findings elucidate the mechanisms by which coercive institutions have persistent economic effects (Cirone and Pepinsky Reference Cirone and Pepinsky2022; Simpser, Slater, and Wittenberg Reference Simpser, Slater and Wittenberg2018). The durable impacts of historical institutions have been well-established, but the pathways by which defunct coercive regimes continue to shape development are ambiguous. Using a variety of data sources, I test several plausible candidate causal pathways to show the uniqueness of the poverty trap mechanism. Understanding persistence channels is critically important because it implies much different solutions to persistence; for instance, technical interventions such as cash transfers may better address poverty traps, whereas fundamental reforms are required to address institutional path dependence.
Finally, my study highlights the long-term importance of regional executives in dictatorships (Carter and Hassan Reference Carter and Hassan2021; Reuter and Robertson Reference Reuter and Robertson2012; Rundlett and Svolik Reference Rundlett and Svolik2016). Authoritarian politics scholars have increasingly highlighted the importance of subnational administration in autocracies, especially how dictators delegate control to loyalists. My study shows the consequences of regional executive loyalty in repressive regimes are substantial and persistent, providing an additional normative impetus for understanding how autocrats manage agency problems with their subnational subordinates.
STATE REPRESSION AND ECONOMIC DEVELOPMENT
Repression is the “original sin” of dictatorship (Svolik Reference Svolik2012, 10). State violence has clear short-term economic implications: population transfers, mass killings, or detentions impact local labor markets along with individuals and their families. However, since such violence is transitory, effects may only persist if the fundamentals of economic growth—land, labor, capital, or social and formal institutions—change as a result of repression.
Since the economic legacy of repression is contingent on changes in factors of production, scholars have found mixed evidence in a variety of contexts. Some show positive impacts of state violence for decedents of victims and surrounding communities due to changing preferences (Becker et al. Reference Becker, Grosfeld, Grosjean, Voigtländer and Zhuravskaya2020) or relocation (Toews and Vézina Reference Toews and Vézina2020). Genocide may increase development in the short run through property theft (Charnysh and Finkel Reference Charnysh and Finkel2017), or Malthusian channels (Rogall and Yanagizawa-Drott Reference Rogall and Yanagizawa-Drott2013); however, effects do not persist. Others document negative legacies, either leveraging instrumental variables (Meng and Qian Reference Meng and Qian2009; Naumenko Reference Naumenko2019; Zeng and Eisenman Reference Zeng and Eisenman2018) or selection on observables (Acemoglu, Hassan, and Robinson Reference Acemoglu, Hassan and Robinson2011) for identification.
Understanding the legacy of repression on development requires a particular focus on the technology of coercion along with who the state is attempting to victimize. Transitory episodes of mass arrests that target citizens indiscriminately may not permanently alter underlying factors of production, whereas lethal repression that targets persons based on certain socioeconomic traits may have more lasting effects by changing the composition of the labor force, creating multiple developmental equilibria.
A common form of demographically targeted repression is coercion of educators, educational institutions, and middle income persons. Several authoritarian regimes have demographically targeted repression in a manner intended to eliminate higher income or educated segments of society. Franquist Spain purged public school teachers (Balcells and Villamil Reference Balcells and Villamil2020) as did Mao Zedong’s Anti-Rightist Campaign in China (Zeng and Eisenman Reference Zeng and Eisenman2018). Francisco Macias Nguema’s rule of Equatorial Guinea included the closure of all private schools and the use of repression to support coerced labor (Fegley Reference Fegley1981). Joseph Stalin’s dekulakization was intended to “break the back of the independent peasantry” (Naimark Reference Naimark2010, 54), and targeted more middle-income peasants. In the early stages of genocide, the Ottoman Empire and Nazi Germany both targeted intellectuals within minority groups.
Even less extreme dictatorships have targeted skilled workers and educators. Argentina’s last dictatorship targeted secondary schools and architects, due to the regime’s belief that persons in these sectors produced subversives (Rock Reference Rock1993, 228–30). Pinochet’s dictatorship in Chile similarly defunded universities, creating a crunch on higher education (Bautista et al. Reference Bautista, Gonzales, Martinez, Munoz and Prem2020).
Repression of the educated, however, is not a thing of the past: Hungary, Turkey, and Zimbabwe have all engaged in state repression of higher education and teachers (Hansen Reference Hansen2019; Rankin Reference Rankin2021; Wall Reference Wall2002). Outside of dictatorships, insurgent groups including the Islamic State (IS), the Free Aceh Movement (GAM), the Shining Path, the Taliban, and anglophone separatists in Cameroon, have similarly repressed educated persons and formalized schooling.
Repression that demographically targets more educated, intellectual, and professional classes may directly undermine human capital in a locality by eliminating the learned members of society, causing developmental divergences through poverty traps. Poverty traps are situations where poverty is so extreme that individuals cannot afford to take poverty-reducing actions. For instance, if education levels are already low and individuals are poor, the opportunity cost of seeking additional training may be larger than the return to schooling, since another year spent in school means a year out of the labor market (Azariadis and Drazen Reference Azariadis and Drazen1990). Alternatively, low income and education may force an individual into a low-earning job, since the effort required to find alternative means of employment are too expensive for the already poor. Poverty may lead individuals to become unhealthy, and worse health could reinforce low income (Banerjee and Duflo Reference Banerjee and Duflo2011). This explanation posits that multiple developmental equilibria exist, and that a locality or person may find themselves in one equilibrium versus another due to path-dependent processes sprung by historical factors.
Repression may undermine development through a variety of other mechanisms. Coercion can change social capital (Lichter, Löffler, and Siegloch Reference Lichter, Löffler and Siegloch2021; Lowes and Montero Reference Lowes and Montero2021; Nunn and Wantchekon Reference Nunn and Wantchekon2011), formal government institutions (Acemoglu, Johnson, and Robinson Reference Acemoglu, Johnson and Robinson2001), local elite strength (Dell Reference Dell2010), or cause property conflict (Guardado Reference Guardado2018), hindering development. The variety of possible mechanisms and related papers are displayed in Table 1.
Table 1. Causes of Persistent Underdevelopment from Coercive Institutions
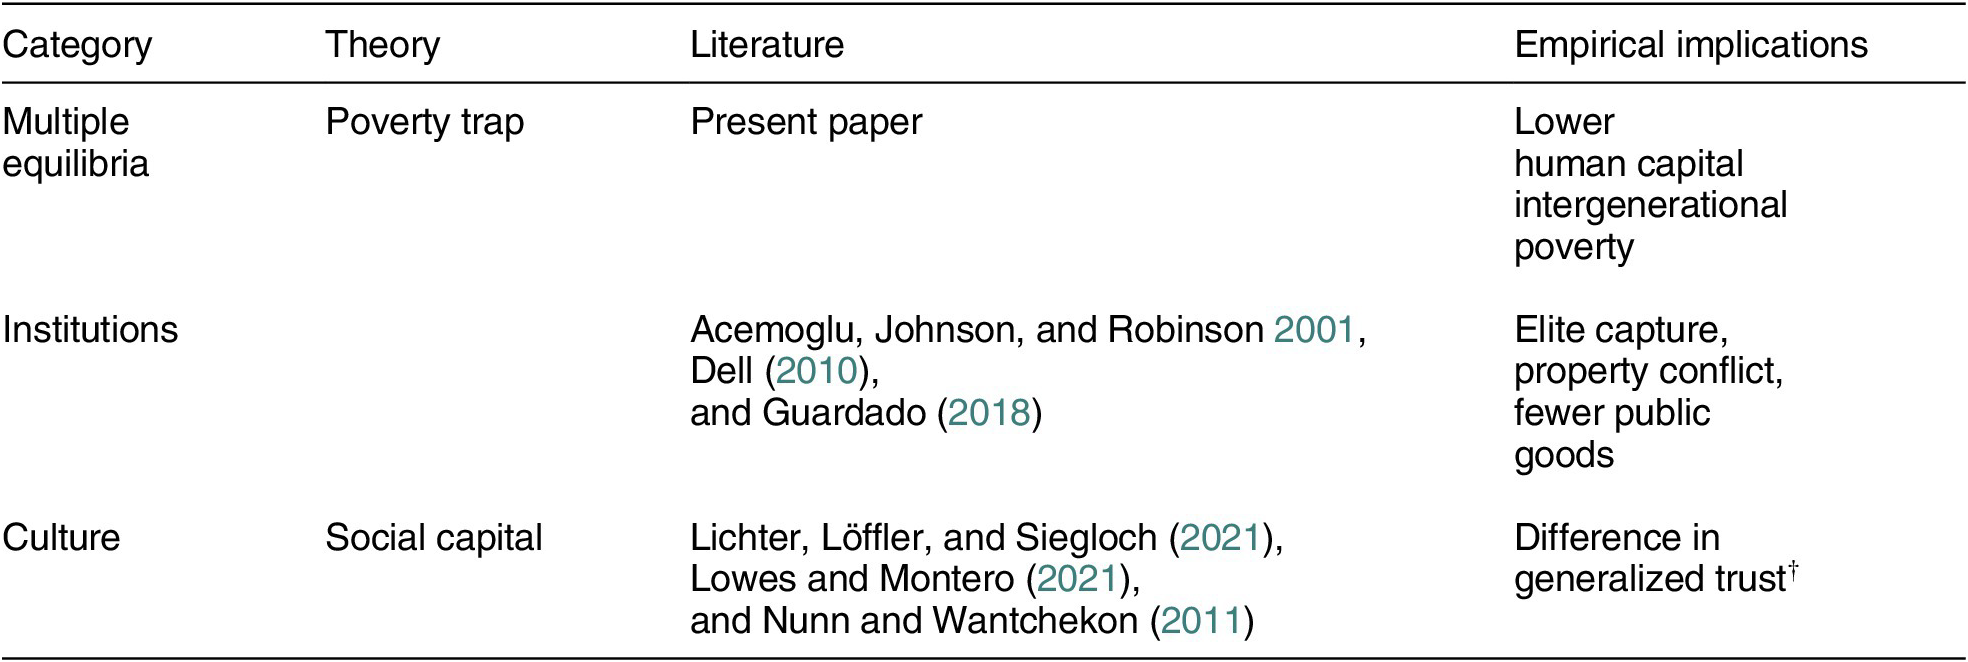
Note: Three categories drawn from Nunn (Reference Nunn2014). $ {}^{\dagger } $
Scholars are divided on the direction of the trust effect after exposure to coercive institutions; Lowes and Montero (Reference Lowes and Montero2021) argue the legacy of violence after the Congo Free State increased trust, in line with the large literature on civil conflict legacies, whereas Lichter, Löffler, and Siegloch (Reference Lichter, Löffler and Siegloch2021) and Nunn and Wantchekon (Reference Nunn and Wantchekon2011) argue coercion reduced trust in the long term.
$ {}^{\dagger } $
Scholars are divided on the direction of the trust effect after exposure to coercive institutions; Lowes and Montero (Reference Lowes and Montero2021) argue the legacy of violence after the Congo Free State increased trust, in line with the large literature on civil conflict legacies, whereas Lichter, Löffler, and Siegloch (Reference Lichter, Löffler and Siegloch2021) and Nunn and Wantchekon (Reference Nunn and Wantchekon2011) argue coercion reduced trust in the long term.
CONTEXT: DEMOCRATIC KAMPUCHEA (DK)
I study a historically important case of demographically targeted repression: the DK regime in Cambodia. During the regime’s short tenure of less than 4 years, nearly one in five Cambodians are estimated to have died. Due to the gravity of the event, it is important to understand the impacts of the DK regime in its own right.
Aside from its intrinsic importance, the DK case is of interest because it presents an opportunity to uniquely identify multiple equilibria—poverty traps—as the causal mechanism connecting state repression to long-term development. The observable implications of poverty traps could be explained by institutional or cultural changes that occur as a result of state violence. Many coercive regimes institute extractive rules of the game that outlast the regime, are controlled by the same economic elites overtime, and reshape cultural norms. These forces may link patterns of individual behavior that reinforce poverty, such as underinvesting in health and education, rather than poverty traps, which are individual feedback loops. Figure 1 outlines the logic: in all three subfigures, poverty in the past shapes poverty in the future (poverty + t), but in Figure 1b,c, the repression shapes poverty overtime through its impact on culture and institutions.
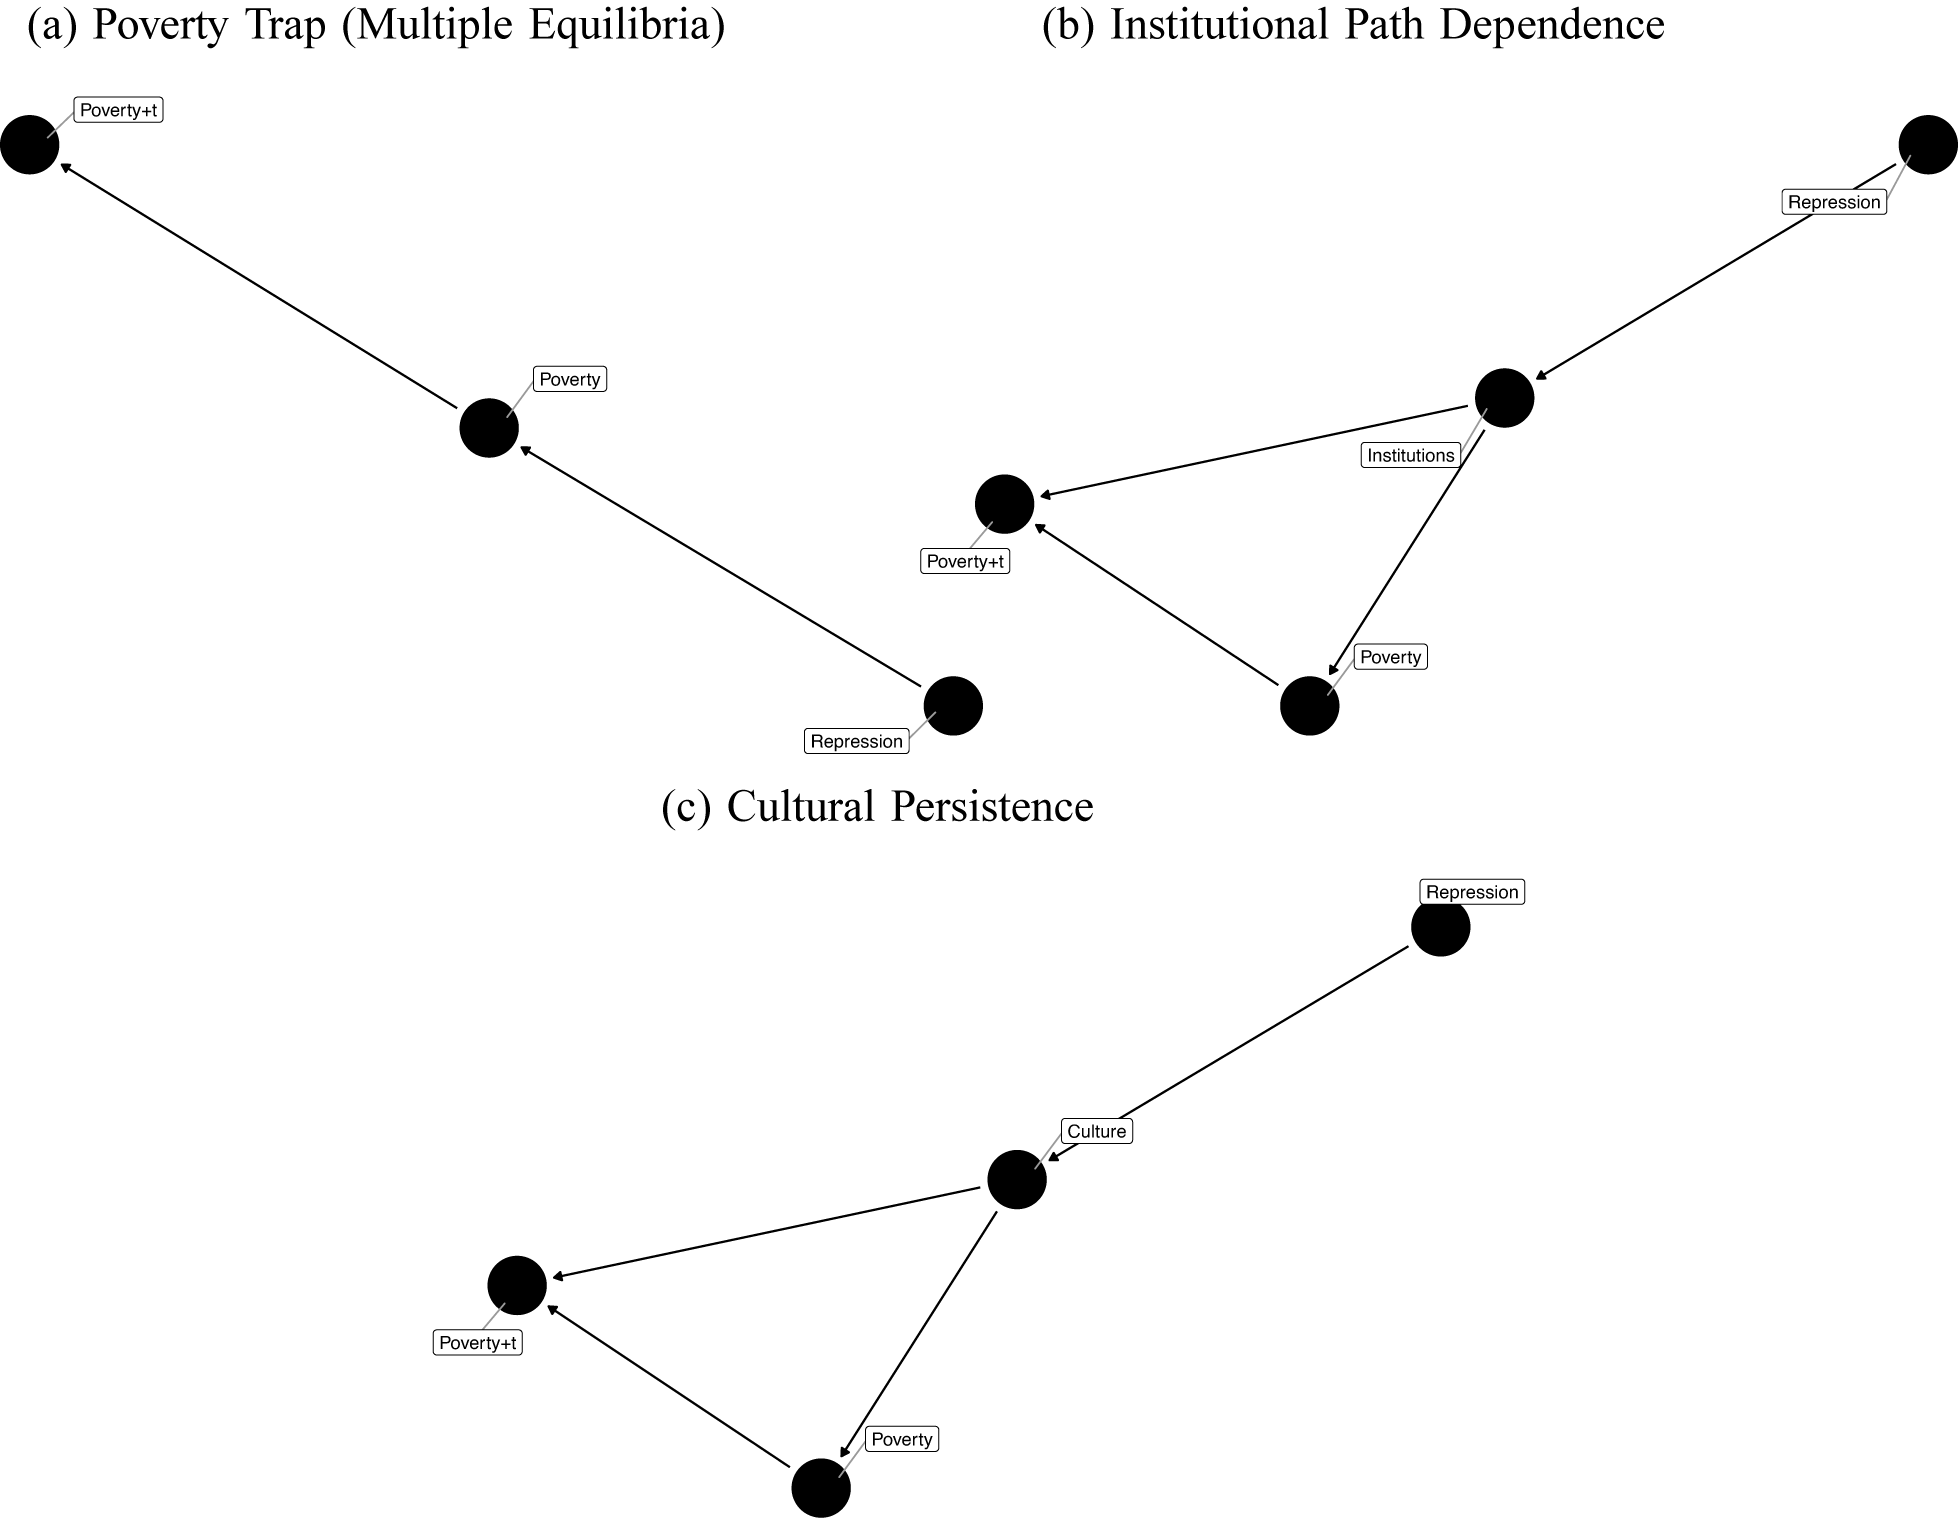
Figure 1. Theoretical Pathways Linking Repression to Long-Run Poverty
Note: Directed acyclic graphs diagraming competing causal pathways linking repression to long-run poverty. Multiple equilibria via the poverty trap, wherein repression causes poverty which feedbacks into itself over time, is depicted in panel a. Institutional and cultural channels (panels b and c) illustrate paths where poverty feeds into itself, but culture and institutions explain persistent effects. Persistence is denoted with the poverty $ \hskip0.3em +\hskip0.3em t $
for any
$ \hskip0.3em +\hskip0.3em t $
for any $ t\hskip0.3em >\hskip0.3em 0 $
.
$ t\hskip0.3em >\hskip0.3em 0 $
.
In the DK case, institutional and cultural persistence are implausible explanations for the persistence of poverty from repression at the subnational level. The typical institutions-based story is implausible because formal rules created by DK did not survive the regime, and the extreme faction of DK was supplanted by the moderate faction, now represented by the Cambodian People’s Party (CPP). Next, since the identifying variation I explore is in terms of intensity rather than existence, it is unlikely that cultural norms sharply diverge based on subnational exposure to violence: to the extent experiencing horrific violence can alter fundamental beliefs about the trustworthiness of others, some exposure to mass repression is likely sufficient to generate changes in trust. In the penultimate section, I examine the plausibility of all three causal diagrams outlined in Figure 1.
In the next four subsections, I explain the historical context behind the regime, motivating the identification strategy and the channel of persistence.
DK: Administration and Legacy
From 1975 to 1979, DK abolished private property and currency, collectivized agriculture, closed formal schools, and forced citizens into highly stratified labor groups according to their age, sex, residence, and educational background. The regime’s development strategy hinged on a significant increase in rice production, which would be supported by building irrigation infrastructure through forced labor. Nominally, the regime pursued a mass literacy campaign, but labor requirements and the purging of former educators served a cross purpose. The regime relied on coercion to enact its social reorganization (Becker Reference Becker1998; Kiernan Reference Kiernan2008; Vickery Reference Vickery1984).
The DK regime was ideologically fragmented on a spectrum of moderate communists to repressive extremists. Fissures were consequential; after capturing Phnom Penh, it took months for combat commanders to come together to form a government. The fractionalization across ideology was highly regionalized: during the civil war from 1970 to 1975, commanders operated largely in isolation, even wearing different uniforms.
DK Zones: The Southwest and West
To manage tensions between regional commanders, the central party leadership divided the country into several different zones, which closely overlapped with combat theaters and at times ignored pre-existing provincial boundaries. The leaders of zones were called zone secretaries. Zones were organized with rigid hierarchy internally, but the ability of the central government to coordinate policy between zones was constrained by the influence of the zone secretaries within their territory (Vickery Reference Vickery1984, 68). Mass killing directives were handed down by party leadership, but zone secretaries ultimately carried out orders (Ea Reference Ea2005, 126). Since secretaries had a great deal of de facto authority, the implementation of regime mandates varied across zones based on the idiosyncrasies of personal leadership (Becker Reference Becker1998, 176).
I focus on a salient border that divided very different commanders: Mok in the Southwest and Sy in the West. Mok and Sy shared jurisdiction during the civil war, and their two respective zones were one area of operation during the civil war. After a major dispute concerning the brutality of Mok’s approach to the revolution, their jurisdiction was divided into two separate zones which they commanded in isolation, divided along National Road 4 (NR4).
The border road—NR4—was constructed cheaply by the United States in the 1950s, with the goal of connecting the port city of Sihanoukville to the capital Phnom Penh in the least costly way possible. In congressional hearings about the U.S.’s construction of the road, officials concede “[t]he principal justification was a political justification” unrelated to economics: the United States constructed the road as a favor to France and as a way to reduce Cambodian dependency on Vietnam for trade. Indeed, one engineer remarked “[t]he decision to give support to the construction of this highway in the first instance was not based on detailed studies of such matters as the volume of traffic and the precise economic benefits expected to result, nor indeed were they considered to be the determining factors under the circumstances” (House of Representatives 1961). Consistent with a lack of meticulous planning, the road quickly fell into disrepair, straining the US–Cambodian relationship (Howland and Kennedy Reference Howland and Kennedy1999).Footnote 2
Whereas the idea of the road was driven by political considerations, the exact location was less of a reflection of local economics and more of a matter of convenience. Figure 2 maps the Southwest and West zone. Binding geographic constraints outside of Kampong Speu (dashed lines) caused the road to bisect the province. The simplest route to connect the port and the capital was through a narrow stretch of flat land, across Kampong Speu. Building the road slightly differently would have led to the route to cross over elevated terrain (dark shading), adding cost and complexity to the project. As such, the location of the highway is largely arbitrary within Kampong Speu, since the terrain features that induced the road to be built in such a way are beyond the borders of the province. Within Kampong Speu, terrain, river, and road access appear largely similar on either side of NR4.
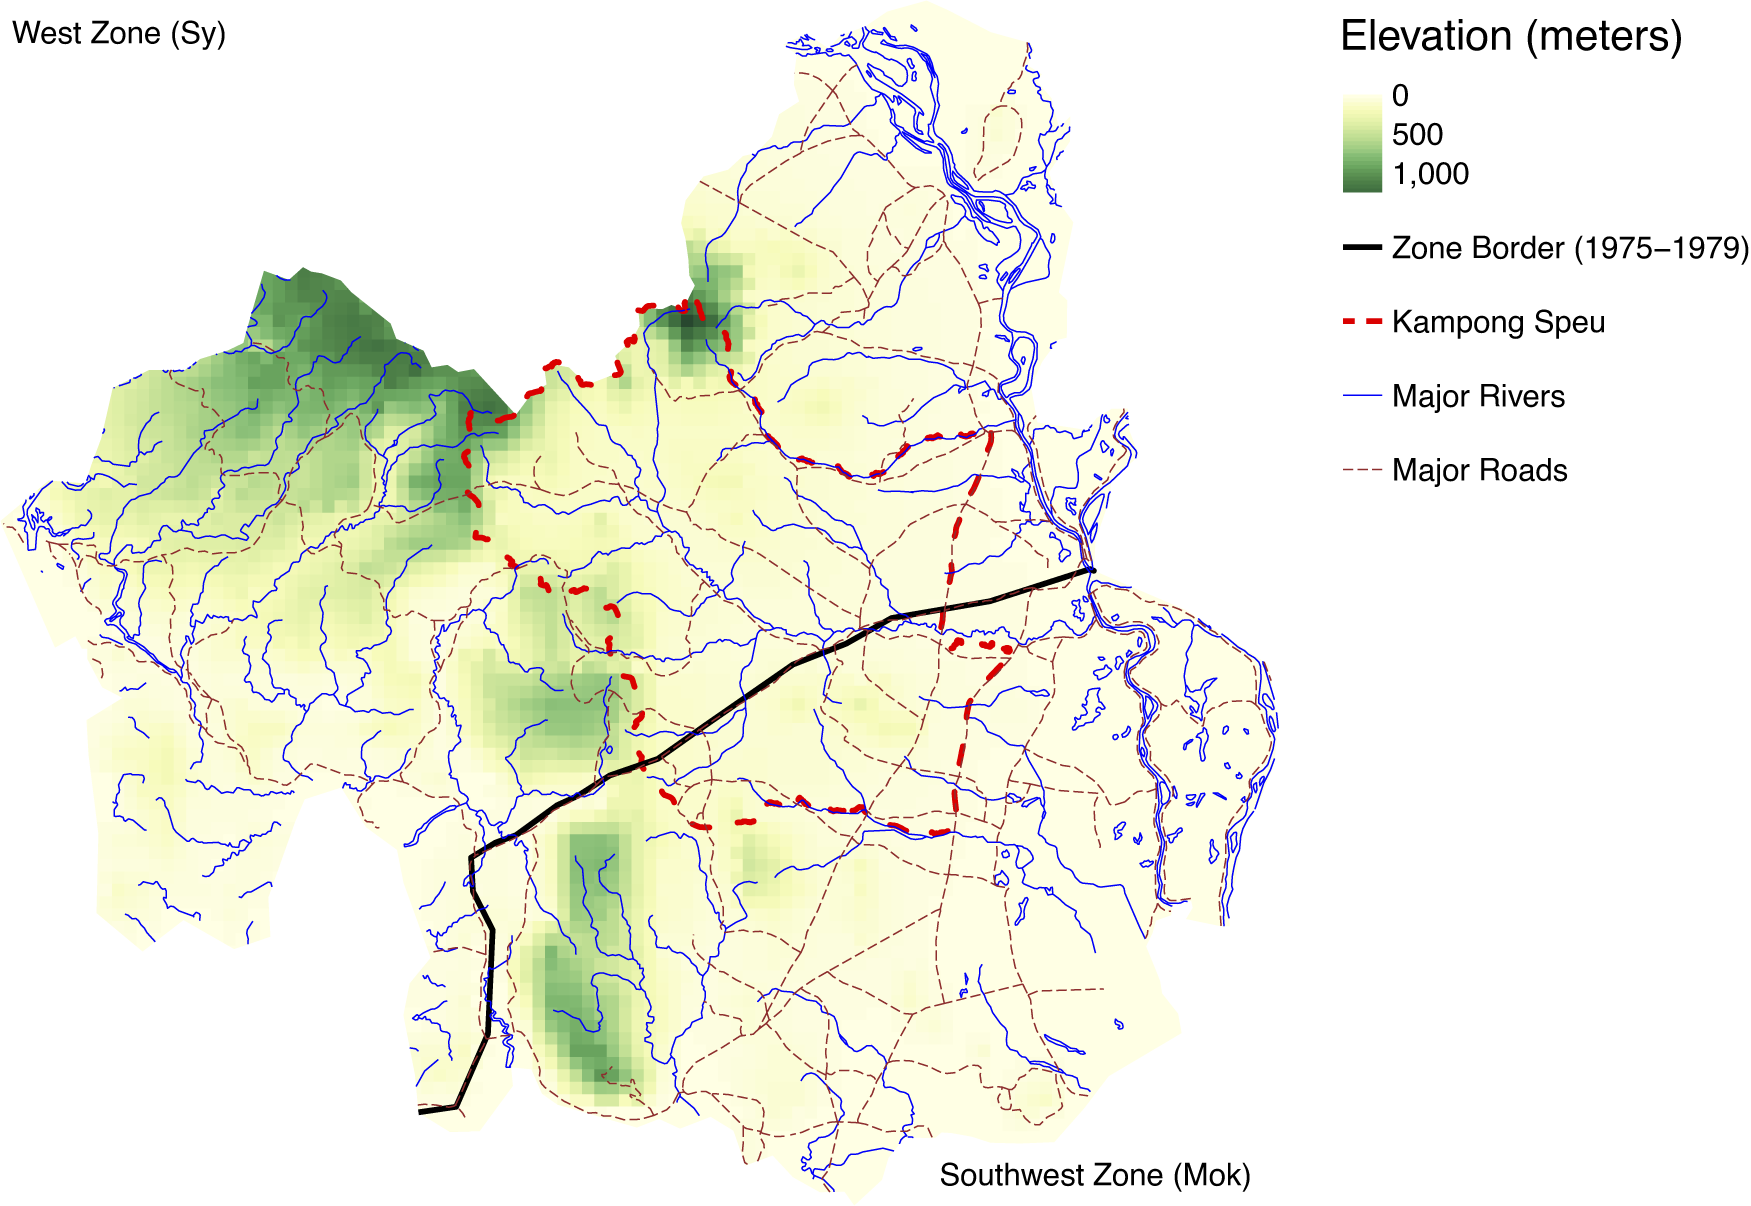
Figure 2. West and Southwest Zones during Democratic Kampuchea Regime
Note: Zone border from Yale Genocide Studies Program (https://gsp.yale.edu/dk-zones-english). Shading shows elevation (in meters) in grid cells across the zones. Red dashed line is the provincial boundary of Kampong Speu, which was salient pre and post (but not during) the DK era. The thick black line shows the border between the West and Southwest zone, drawn over National Road 4, which was only a political border during the DK era. Brown dashed lines are major roads and thin blue lines are rivers.
The road was a natural choice for a border for DK since it provided a visible marker to divide rivals. Clear lines of demarcation of authority between areas was important because zone leaders were conflictual—trespassing on zones were known to cause skirmishes between troops in places were lines were less clear, such as the boundary between the Southwestern and Eastern zone (Vickery Reference Vickery1984, 77). One natural solution to this problem was the use of natural landmarks as borders, like roads, which DK also used to divide smaller Damban regions such as Damban 1 and 4 in the Northwest zone (Vickery Reference Vickery1984, 111), or rivers, such as the Mekong, which divided the North-Central and East zone in Kampong Cham.
Repression in the Southwest versus West
Both primary and secondary sources, along with descriptive quantitative evidence, point to a difference in repression intensity between the West and Southwest zones. Whereas Mok is credited with being among the most ruthless toward “new people”—individuals who were educated, urbanites, or in other ways connected to the Lon Nol or Sihanouk regime—Sy in comparison was less brutally violent toward these groups.
Sy and Mok are illustrative of the ideological divide within DK, which shaped how violent and repressive their rule was during the regime (Becker Reference Becker1998; Commission 1984). Sy was an intellectual, member of old reformist socialist groups, and less ruthless than the more extreme factions. In contrast to Mok and other extremists, he believed old regime members could be incorporated into DK rather than executed. During the civil war, interviewees report “Sangha Hoeun and Chou Chet [Sy] re-educated and taught these people [Lon Nol soldiers]. I saw this; they did not kill them. But Mok did kill such people, and he became angry with what the other two were doing” (Kiernan Reference Kiernan1989, 28).
Mok executed the moderate communist Sangha Hoeun, which created a strong division between him and Sy: an interviewee reported Sy “…didn’t agree with that [the execution of Sangha Hoeun] so he was transferred and the Southwest Zone was divided into two, and the Western Zone created” (Kiernan Reference Kiernan1980a, 511). Consistent with Sy’s approach of incorporating old regime members rather than executing them, party meeting reports in 1977 indicate that a “fair number” of cooperatives were staffed by individuals who were not members of the peasant class in Sector 32 of the West (Carney Reference Carney and Jackson1992, 86). Sector 32 of the West was Sy’s headquarters, which covered the half of Kampong Speu that was split into his zone. Staffing cooperatives with non-peasants is suggestive of Sy choosing to incorporate the social groups that Mok executed into government.Footnote 3
Primary source interviews corroborate the qualitative differences in cruel repression between Mok and Sy. One interviewee remarked “Mok was cruel since 1971–1972. Different from Chou Chet [Sy] and Phouk Chlag. Mok was fierce (khlang), a killer (Kiernan Reference Kiernan1980b, 2).”Footnote 4 A former Communist Party of Kampuchea (CPK) district chief expanded upon how the differences in ferociousness—khlang—impacted the intensity of DK cruelty: he said Sy was “not very harsh (khlang)…Sy didn’t set targets: when he took me to Tonle Sap, on the boat with me, he said ‘friend, grow 1,000 ha of rice here, if there is enough water. If water is short, well, it depends on the concrete situation.”’ (Kiernan Reference Kiernan1980c, 11). Given the excessive death caused by unrealistic project goals during the regime, this distinction suggests a critical difference in repression intensity. One interviewee who lived in Sector 32 of the West—Sy’s headquarters—reports “no killings” in 1975, and described the area as “softer” since “they didn’t kill many people in R32” (Kiernan Reference Kiernan1980d, 2).
Meanwhile, the Southwest committed most to the development of cooperatives according to the revolution’s ideology (Kiernan Reference Kiernan2008, 87–90). The zone was the “power core” of the regime (Vickery Reference Vickery1984, 86). Mok staffed his zone with close family members, who would remain loyal to his orders. Sector 33, run by Mok’s son, exemplifies the pattern: the area, in modern Kampong Speu province, was “the toughest sanctuary of the Khmer Rouge movement” (Vickery Reference Vickery1984, 98); affiliates of the old regime were forced to work in the fields (Vickery Reference Vickery1984, 93) and refugee reports suggest “new people” received less rations (Vickery Reference Vickery1984, 99). A U.S. embassy report quoted a refuge who said “[a]n error, if discovered, means death in the south” (Kiernan Reference Kiernan2008, 194).
Descriptive evidence is consistent with interviewee accounts of the differences between Mok and Sy. I use data on sibling deaths from the 2000 Demographic Health Survey round to estimate annual mortality trends by zone in Kampong Speu. I develop a predictive model of mortality based on gender, age, and residence (out of sample) and then use the model to compute expected mortalities by year. Figure 3 plots the difference between observed and expected mortalities by zone. In 1975, there is a differential spike in excess mortality in the Southwest, which corresponds with the year Pol Pot gave the order to begin murdering the educated and intellectuals indiscriminately (Kiernan Reference Kiernan2008).Footnote 5
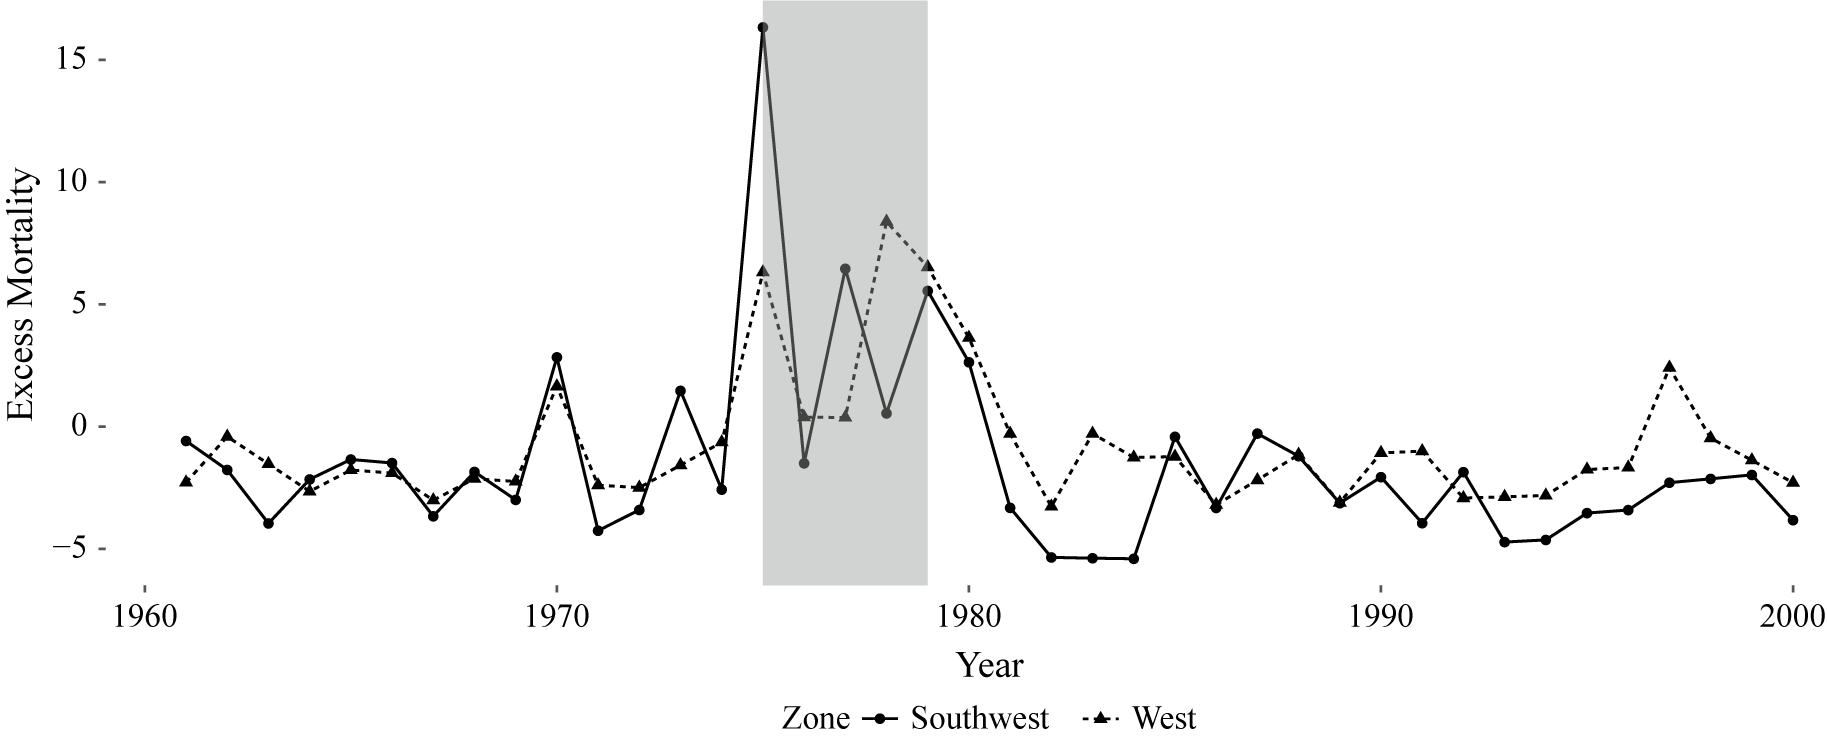
Figure 3. Estimated Mortality Trends by Zone
Note: Shaded region denotes the Khmer Rouge period (1975–79). Vertical axis is the difference between total and expected mortality. Horizontal axis is the year of reported death. Data from 2000 DHS survey round in Cambodia. Details on estimation of excess mortality in E.5 in the Supplementary Material.
To be clear, the West was not free of repression. Refugees report enforcement of the DK’s family separation policy, executions, and starvation (Kiernan Reference Kiernan1980b; Reference Kiernan1980c). From the reports that families were separated, one can reasonably infer education and labor policies did not sharply differ between Sy and Mok: indeed, such a difference would be such an affront to the official DK line it would have been easily observed and broadly recorded. The distinction between governance cannot be understood as night and day, violent or not. Instead, the difference between Sy and Mok is better characterized as a difference in the intensive margin of violence.
Long-Run Poverty
Poverty has persisted since DK-era repression (Kerbo Reference Kerbo2014). A key dimension of the poverty trap in Cambodia is characterized by a generational skill gap caused by executions. Intergenerational transfers of knowledge were either severely inhibited or eliminated due to the execution of middle aged intelligentsia, educators, and skilled workers (Jeong Reference Jeong2014). The paucity of educated mentors pushed individuals into precarious lines of work with lower economic returns which did not require education to obtain. Therefore, many worked on family farms without seeking specialized training or higher forms of education after the regime (Islam et al. Reference Islam, Ouch, Smyth and Wang2016), a trend which continues to drive poverty across the country (Kerbo Reference Kerbo2014).
RESEARCH DESIGN
Data
I study the degree of local poverty and economic activity at the village (phum) level in Kampong Speu province. Villages are the smallest unit; in Kampong Speu province, the median size of a village was 401 persons and 78 households in 1998. The compact size of villages provide a reasonable approximation of households distance to the border that separated the West and Southwest.Footnote 6
I compare the Southwest and the West within Kampong Speu for three reasons. First, the regions represent the ideological polarization within the regime; Mok was the staunchest ally of the party’s genocidal faction, and Sy was a typical moderate communist. Second, the border between zones did not overlap with other political boundaries unlike other DK zones, meaning a discrete change in the outcomes can be attributed to different zone leadership rather than differences between provinces. This mitigates the “compound treatment problem” commonly found in research designs that rely on geography. Third, the density of observations within a narrow bandwidth around the border means villages in the Southwest are being compared to an appropriate counterfactual, which is not true at other boundaries where villages are further from borders, or where the natural borders were excessively wide, like divisions created using the Mekong River.
Poverty data are from the Cambodian National Poverty Identification System (IDPoor). The data are collected in 2011 through a 16 question household survey conducted by elected village representatives who use questions regarding assets, living standards, means of transport, employment, education, and health to score household poverty on a continuous scale which is subsequently used to construct poverty categories. I measure the percentage of poor households. Further detail on the data collection process of IDPoor is available in Figure A.1 in the Supplementary Material.
Second, I use data on the nighttime luminosity of villages to estimate GDP within a $ 2\hskip0.3em \mathrm{km}\times 2 $
km grid cell surrounding the village center (Ghosh et al. Reference Ghosh, Powell, Elvidge, Baugh, Sutton and Anderson2010). Luminosity proxies both formal and informal economic activity, which is important given the role of informal commerce. I use the inverse hyperbolic sine (IHS) transformation to account for skewness and zeros.Footnote 7
$ 2\hskip0.3em \mathrm{km}\times 2 $
km grid cell surrounding the village center (Ghosh et al. Reference Ghosh, Powell, Elvidge, Baugh, Sutton and Anderson2010). Luminosity proxies both formal and informal economic activity, which is important given the role of informal commerce. I use the inverse hyperbolic sine (IHS) transformation to account for skewness and zeros.Footnote 7
Empirical Strategy
The nature of assignment into the Southwest versus West suggests a regression discontinuity (RD) approach which compares modern outcomes between nearby villages on either side of the boundary. The RD estimator is
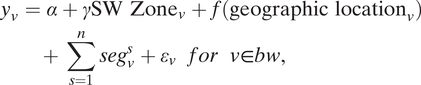 $$ {\displaystyle \begin{array}{l}{y}_v=\alpha +\gamma {\mathrm{SW}\ \mathrm{Zone}}_v+f\left({\mathrm{geographic}\ \mathrm{location}}_v\right)\\ {}\hskip1.7pc +\hskip2px \sum_{s=1}^nse{g}_v^s+{\varepsilon}_v\hskip5.55pt for\hskip5.55pt v\in bw,\end{array}} $$
where $ {y}_v $
is the outcome of interest, and
$ {y}_v $
is the outcome of interest, and $ {\mathrm{SW}\ \mathrm{Zone}}_v $
is a binary indicator scored 1 if a village was in the Southwest and 0 otherwise.
$ {\mathrm{SW}\ \mathrm{Zone}}_v $
is a binary indicator scored 1 if a village was in the Southwest and 0 otherwise. $ f({\mathrm{geographic}\ \mathrm{location}}_v) $
is the forcing variable, which I define as the distance between the village v and the border that divided the Southwest and West.Footnote 8 I evaluate Equation 1 using distance in a linear and quadratic form.
$ f({\mathrm{geographic}\ \mathrm{location}}_v) $
is the forcing variable, which I define as the distance between the village v and the border that divided the Southwest and West.Footnote 8 I evaluate Equation 1 using distance in a linear and quadratic form.
I follow Dell (Reference Dell2010) and include boundary segment fixed effects $ {\sum}_{s=1}^nse{g}_v^s $
, which are computed by splitting the border into n segments s and then scoring 1 if a village is closest to segment s. Segment fixed effects compare villages that lie in the same neighborhood around the border, avoiding imprecise comparisons that may occur if villages have similar absolute distances at extreme ends of the boundary.Footnote 9
$ {\sum}_{s=1}^nse{g}_v^s $
, which are computed by splitting the border into n segments s and then scoring 1 if a village is closest to segment s. Segment fixed effects compare villages that lie in the same neighborhood around the border, avoiding imprecise comparisons that may occur if villages have similar absolute distances at extreme ends of the boundary.Footnote 9
The robust error term is $ {\varepsilon}_v $
. I adjust standard errors for spatial heteroskedasticity and autocorrelation (HAC), following the data-driven procedure developed by Kelly (Reference Kelly2020) for selecting a HAC spatial kernel based on the spatial structure of each respective outcome. I estimate Equation 1 within narrow MSE optimal bandwidths
$ {\varepsilon}_v $
. I adjust standard errors for spatial heteroskedasticity and autocorrelation (HAC), following the data-driven procedure developed by Kelly (Reference Kelly2020) for selecting a HAC spatial kernel based on the spatial structure of each respective outcome. I estimate Equation 1 within narrow MSE optimal bandwidths $ bw $
(Calonico, Cattaneo, and Titiunik Reference Calonico, Cattaneo and Titiunik2014), however, results are robust to alternative bandwidth choices. I include the distance to the provincial capital as an adjusting covariate in some regressions to account for proximity to the provincial center.
$ bw $
(Calonico, Cattaneo, and Titiunik Reference Calonico, Cattaneo and Titiunik2014), however, results are robust to alternative bandwidth choices. I include the distance to the provincial capital as an adjusting covariate in some regressions to account for proximity to the provincial center.
The RD approach is advantageous relative to a selection on observables strategy. Since DK demographically targeted repression against the more well-off, repression levels are likely correlated with positive developmental trajectories, leading to an upward biased estimate of the effect on repression. Since administrative microdata before the regime was destroyed by DK cadres, one cannot adequately adjust for pre-existing development levels.
Since my RD design compares villages which were arbitrarily split into more or less extreme administrative zones, in expectation, confounding factors ought to be similar between villages within a narrow bandwidth, conditional on location. So long as the design assumptions hold, my strategy identifies a local average treatment effect (LATE) of exposure to an extreme DK administrator. I turn to discussing these assumptions now.
Design Assumptions and Inferential Threats
My design relies on two core assumptions: the smoothness of confounders at the discontinuity, and the absence of strategic line drawing to sort observations in a particular way.
Balance Tests
The assumption that confounders are smooth at the discontinuity is reasonable given the arbitrary placement of the road with respect to Kampong Speu. The historical record suggests one confounding feature: the Pol Pot faction wished to divide territory in a way to give Mok control over more productive areas and Sy with less well-endowed land, a goal that would be accomplished by splitting the relatively soil-poor Kampong Speu in two, leaving Mok with the entirety of the soil-rich Kampot province and leaving Sy with the more desolate Koh Kong and the more rugged areas in the far-north of Kampong Speu (Chandler, Kiernan, and Boua Reference Chandler, Kiernan and Boua1988; Vickery Reference Vickery1984).
Geographic variables are “slow moving” in the sense that they vary little within small bandwidths; given the arbitrary placement of the road, there is no reason to believe differences in productivity are sharp at the discontinuity despite the fact Mok was given more rich endowments in the far South outside of Kampong Speu.
I test balance on agro-economic, climatic, and topographic area when crossing from one side of the border to another on $ 1\hskip0.3em \mathrm{km}\times 1 $
km grid cells. Figure 4 shows the mean and variance of temperature and rainfall, forest and cropland cover, ruggedness, elevation, and soil fertility are similar on either side of the boundary. Critically, since the Cambodian economy was agriculture based in the lead-up to the Khmer Rouge, the similarity of factors of production on either side of the border suggest villages had similar access to sources of productive income.
$ 1\hskip0.3em \mathrm{km}\times 1 $
km grid cells. Figure 4 shows the mean and variance of temperature and rainfall, forest and cropland cover, ruggedness, elevation, and soil fertility are similar on either side of the boundary. Critically, since the Cambodian economy was agriculture based in the lead-up to the Khmer Rouge, the similarity of factors of production on either side of the border suggest villages had similar access to sources of productive income.
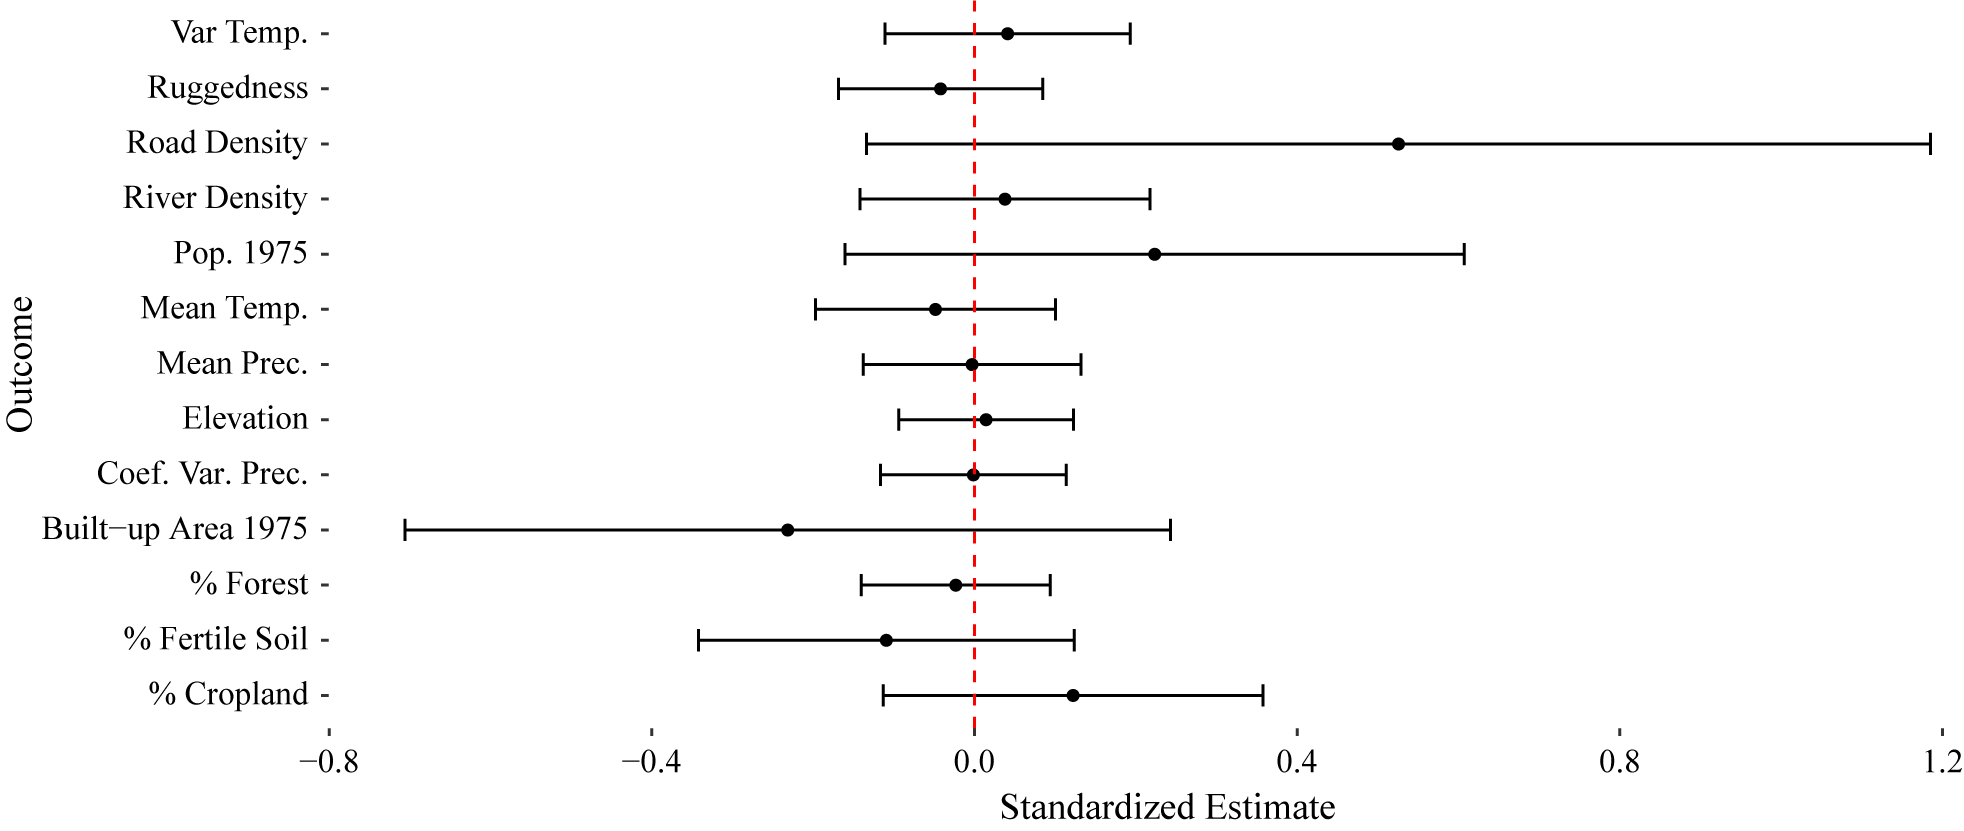
Figure 4. Balance Tests: $ 1\hskip0.3em \mathrm{km}\times 1 $
km Grid Cells
$ 1\hskip0.3em \mathrm{km}\times 1 $
km Grid Cells
Note: Unit of analysis is the $ 1\hskip0.3em \mathrm{km}\times 1 $
km grid cell. Outcomes standardized reported in horizontal axis and vertical axis refers to each respective outcome. Spatial heteroskedasticity and autocorrelation consistent standard errors used to construct equivalence confidence interval (ECI). Equivalence range selected using the sensitivity approach
$ 1\hskip0.3em \mathrm{km}\times 1 $
km grid cell. Outcomes standardized reported in horizontal axis and vertical axis refers to each respective outcome. Spatial heteroskedasticity and autocorrelation consistent standard errors used to construct equivalence confidence interval (ECI). Equivalence range selected using the sensitivity approach $ \epsilon \pm 0.36\sigma $
. The null hypothesis is that areas differ from one another with at least a magnitude of 0.36
$ \epsilon \pm 0.36\sigma $
. The null hypothesis is that areas differ from one another with at least a magnitude of 0.36 $ \sigma $
(Hartman Reference Hartman2021).
$ \sigma $
(Hartman Reference Hartman2021).
DK destroyed micro data from the 1962 Cambodian census, making balance tests on predetermined socioeconomic variables difficult. I use three data sources to probe for pre-existing economic differences from satellite data: estimated population, built-up areas, and road networks in 1975. As Figure 4 shows the equivalence confidence interval contains zero for these outcomes, however, the substantive size of the estimate could suggest some degree of initial imbalance. There is no reason to regard this imbalance as systematic evidence of manipulation rather than chance: first, it would make little sense for a border to be strategically drawn to give built-up areas—the locations DK was most concerned about repressing—to a moderate. Second, to the extent road density could be higher in the former Southwest, increased market access should boost development for former-Southwest villages, suggesting bias in the opposite direction of my main prediction. Balance tests are substantively similar with nonparametric estimator within an MSE optimal bandwidth (Figure A.1 in the Supplementary Material).
Sorting Test
Another possibility is that the road was chosen as the border because it would give Mok more authority. This concern is somewhat mitigated by the fact that the border was a natural landmark: had DK drawn a particular line, the potential for strategic line drawing would be more first order. If it was the case NR4 was chosen strategically with respect to localities, one would expect a discontinuity in the number of villages at the boundary, specifically with more villages under the authority of Mok rather than Sy. I test for strategic sorting of villages along the border, and I find the density of the running variable is continuous (Figure A.2 in the Supplementary Material).
BASELINE RESULTS
Table 2 contains results from Equation 1, which shows a substantively large and statistically significant difference between villages in the Southwest and West. Columns 1–4 refer to the poverty outcome, whereas 5–8 refer to night lights. Columns 1, 2, 5, and 6 use a linear forcing variable and columns 3, 4, 7, and 8 use the squared term. Descriptive RD plots are in E.6 in the Dataverse Appendix.Footnote 10
Table 2. Effect of Southwest on Village Development
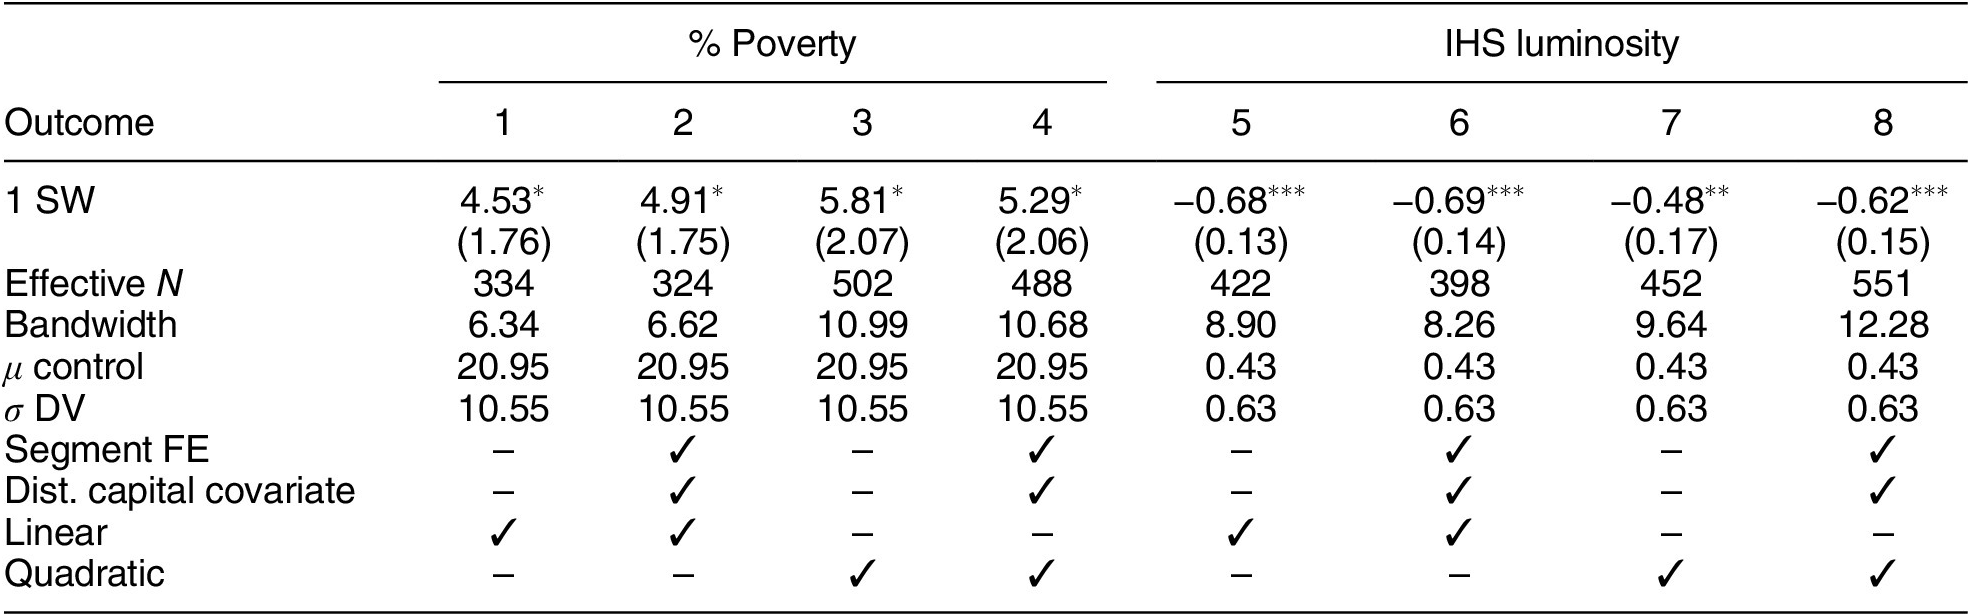
Note: % Poverty is the count of level 1 and level 2 poverty divided by the number of households per village as measured by IDPoor in 2011. Nighttime lights are the inverse hyperbolic sine of the sum of estimated GDP from luminosity in a $ 2\hskip0.3em \mathrm{km}\times 2 $
km grid cell surrounding the village centroid. See Table F.1 in the Dataverse Appendix for the partial derivatives and uncertainty for adjusting covariates.
$ 2\hskip0.3em \mathrm{km}\times 2 $
km grid cell surrounding the village centroid. See Table F.1 in the Dataverse Appendix for the partial derivatives and uncertainty for adjusting covariates. $ {}^{***}p<0.001 $
,
$ {}^{***}p<0.001 $
, $ {}^{**}p<0.01 $
,
$ {}^{**}p<0.01 $
, $ {}^{*}p<0.05 $
.
$ {}^{*}p<0.05 $
.
The results imply a meaningful increase in poverty and reduction in luminosity at the discontinuity. Conservative estimates in columns 1 and 3 suggest poverty increased by 4%—0.41 standard deviations and 20% of the control average—in the Southwest. Meanwhile, nighttime lights decreased by 0.6 standard deviations in the Southwest, which is consistent with the increase in poverty, and is robust to alternative aggregation techniques (Figure B.6 in the Supplementary Material). The inclusion of segment fixed effects and alternative functional forms of the running variable do not meaningfully impact the estimates, nor does adjusting for distance to Chbar Mon, the provincial capital.
Threats to Inference
Confounding (Observable and Unobservable): Sensitivity Analysis
Although regression discontinuity is a credible research design, my study is observational, and adjusting for pre-existing covariates may be important to account for precision or omitted variable bias. First, I show results are robust to covariate adjustment: including the density of roads and built-up area in 1975 does not meaningfully impact the estimates (C.1 in the Supplementary Material). Second, I do a sensitivity analysis to assess how severe unobservable selection would need to be in order to overturn the main findings (Cinelli and Hazlett Reference Cinelli and Hazlett2020). In general, I find an unobservable feature would need to explain at least 10% of the residual variation in exposure to Mok and modern development. Since such a confounder would need to be up to four times stronger than built up area in 1975, a strong predictor, it is implausible that a covariate so large is driving the finding (B.4 in the Supplementary Material).
Road Effect: A Placebo Case Study
Roads themselves may be engines of commerce. To the extent distance to a road matters for development, my main specification flexibly controls for this by including a polynomial in village proximity to the highway. Since my focus is on the local discontinuity in development driven by being on one side of the road versus the other, for the road to explain away the main result, it must be the case that being on one side determines a change in development.
Roads may divide areas which follow different developmental trajectories due to separation and isolation from one another, in which case, a spatial discontinuity in development may emerge by virtue of the border being a road rather than differences in administration. I test this possibility using National Road 3 (NR3) in Kampot Province as a placebo case study. NR3 bisected Kampot in a similar way as NR4, but the entire province was in the Southwest zone during DK. Available qualitative evidence suggests the road separated different communities before the regime; “[i]n some places the line of demarcation between the two kinds of peasantry was apparently quite clear…north of the road running between Chhouk and Kampot the population was isolated, hostile to everything urban, and, incidentally, revolutionary from long before 1970, while south of that road the peasants interacted with the market, were familiar with urban ways, and considered themselves part of wider Cambodian society” (Vickery Reference Vickery1984, 4).
I find no evidence of a discontinuity along NR3, suggesting that roads do not generically predict discrete shifts in development across space. The absence of an effect in the context of NR3 increases our confidence that the main finding is driven by the administrative boundary NR4 represented rather than the fact it is a road (B.5 in the Supplementary Material).
Civil Conflict Legacy: Falsification Test
The legacy could be driven by civil conflict legacies rather than state repression. This explanation is implausible, since both zones were one combat theater during the civil war (1970–75). Civil war violence outside of state repression must change underlying factors of production to have a persistent effect (Blattman and Miguel Reference Blattman and Miguel2010). In Cambodia, the most plausible way this could occur would be if explosive remnants of war (ERW, landmines or bombs) were differently allocated between zones, degrading land (Lin Reference Lin2022). I find no evidence of differential ERW (B.5 in the Supplementary Material).
Robustness
I probe the robustness of my findings in several ways.
DHS Wealth Data To validate my measure of poverty at the village level with administrative data, I replicate my findings using survey data at the individual level collected by the Demographic Health Survey from 2000 to 2014. I show rural household wealth is lower in the former Southwest (B.1 in the Supplementary Material).
Two-Dimensional Forcing Variable Nonlinear spatial trends could be mistaken for discrete change in income levels if the univariate forcing variable masks higher-order changes across latitude–longitude space. I include a two-dimensional forcing variable (B.1 in the Supplementary Material) and estimate the RD along border points to account for this (B.2 in the Supplementary Material).
Power Analysis One may be concerned that the number of observations is small in a narrow neighborhood, reducing the statistical power of the tests. Since the effect size I uncover is substantial, not many observations are required. I show that I have sufficient power within an MSE optimal bandwidth to detect the main effects (B.2 in the Supplementary Material).
Falsification Test Spatial autocorrelation could explain the finding if village development clusters geographically. I show the bias-corrected CCT standard errors are robust to spatial noise simulations which create synthetic outcome data following the same spatial structure of the true data (Kelly Reference Kelly2020) (Figure B.8 in the Supplementary Material).
Donut RD I estimate a series of donut-hole RDs, dropping observations close to the border, and find similar results even after 10% of the data are dropped (Figure B.8 in the Supplementary Material). The result guards against the possibility that when approaching the road, villages experience a differential positive development shock unrelated to DK.
MECHANISMS
Repression and Poverty Traps: Conceptual Framework
Violence targeted at higher educated segments of society creates a skill gap between generations, leaving younger people without mentors who can transfer skills and knowledge. This type of violence can be found across autocracies and coerced labor regimes: autocrats prefer low-skilled loyalists to competent persons to extend their survival (Egorov and Sonin Reference Egorov and Sonin2011) and under coerced labor, principals are more violent toward productive and skilled persons, who have a larger outside option (Acemoglu and Wolitzky Reference Acemoglu and Wolitzky2011). The mechanism I study is therefore plausible in other contexts.
In the next sections, I show how poverty becomes self-perpetuating and persistent due to repression: a poverty trap. Educational attainment is lower in the former Southwest, with a particularly strong drop among the age cohort whose secondary schooling years were interrupted by the regime. This created an intergenerational poverty trap in two ways. Individuals in the Southwest were pushed into informal employment, which earns less income. The evidence is consistent with a model of poverty wherein individuals at time t remain poor in $ t+1 $
because their low income forces them into making decisions that reinforce their poverty, such as working low-earning jobs (Banerjee and Duflo Reference Banerjee and Duflo2011). Further, children born after the regime in the Southwest have worse health outcomes, which strongly predicts future income. This evidence highlights the intergenerational nature of the poverty trap: although children born in the former Southwest were never repressed by DK, they face deprivation because their parents were driven into poverty, perpetuating the cycle.
$ t+1 $
because their low income forces them into making decisions that reinforce their poverty, such as working low-earning jobs (Banerjee and Duflo Reference Banerjee and Duflo2011). Further, children born after the regime in the Southwest have worse health outcomes, which strongly predicts future income. This evidence highlights the intergenerational nature of the poverty trap: although children born in the former Southwest were never repressed by DK, they face deprivation because their parents were driven into poverty, perpetuating the cycle.
Human Capital Declined after DK
First, I evaluate whether trends in schooling by age changed in the Southwest zone. If human capital differentially declined in the Southwest due to the Khmer Rouge, one should observe relatively similar levels of schooling among age cohorts who finished schooling before the regime along with a sharp decline in schooling among villagers whose school-age years overlapped with the regime. I test this argument using a difference-in-differences design leveraging microdata on individual schooling and age from Cambodian Labor Force Surveys in 2000/2001. The common trends assumption is plausible in this setting, since all villagers educated before DK were in the same province, meaning the institutional differences between regions only emerged after the regime. I placebo test this assumption, regressing schooling on a series of separate cohort dummies among persons past schooling age in 1975, finding no evidence of large or significant breaks in educational trends (Table D.6 in the Supplementary Material).
I estimate the following model:
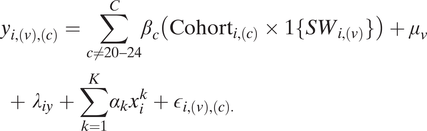 $$ \begin{array}{rl}{y}_{i,(v),(c)}={\displaystyle \sum_{c\ne 20-24}^C}{\beta}_c\left(\right.{\mathrm{Cohort}}_{i,(c)}\times 1\{S{W}_{i,(v)}\}\left)\right.+{\mu}_v\hskip4.5em +\hskip0.35em {\lambda}_{iy}+{\displaystyle \sum_{k=1}^K}{\alpha}_k{x}_i^k+{\epsilon}_{i,(v),(c).}& \end{array} $$
The outcome is years of schooling, $ {y}_{i,(v),(c)} $
, measured for individual i in village v among age cohort c. The coefficients of interest are
$ {y}_{i,(v),(c)} $
, measured for individual i in village v among age cohort c. The coefficients of interest are $ {\beta}_c $
, which capture the differential effect of an individual living in the Southwest zone in an age cohort who would have had primary or secondary schooling after DK, relative to the age cohort who would have completed primary or secondary schooling before the regime (aged 20–24 in 1975). Note
$ {\beta}_c $
, which capture the differential effect of an individual living in the Southwest zone in an age cohort who would have had primary or secondary schooling after DK, relative to the age cohort who would have completed primary or secondary schooling before the regime (aged 20–24 in 1975). Note $ {\beta}_c $
captures both pre-trends in educational differences among older cohorts and the dynamic effect of having overlapped with Mok’s rule during schooling age. I include birth-decade-by-commune fixed effects
$ {\beta}_c $
captures both pre-trends in educational differences among older cohorts and the dynamic effect of having overlapped with Mok’s rule during schooling age. I include birth-decade-by-commune fixed effects $ {\lambda}_{iy} $
which absorb decadal educational trends over space, village fixed-effects (
$ {\lambda}_{iy} $
which absorb decadal educational trends over space, village fixed-effects ( $ {\mu}_v $
) to adjust for village-invariant factors, and K individual controls
$ {\mu}_v $
) to adjust for village-invariant factors, and K individual controls $ {\sum}_{k=1}^K{\alpha}_k{x}_i^k $
including age and its square and respondent gender. Standard errors are clustered at the village.
$ {\sum}_{k=1}^K{\alpha}_k{x}_i^k $
including age and its square and respondent gender. Standard errors are clustered at the village.
Figure 5 graphically displays the identification approach and results. Figure 5a shows the average years of schooling by cohort per zone, illustrating a (fitted) parallel trend in the pre period. Education levels then sharply decline in the former Southwest zone among 12- to 17-year olds (in 1975 years). Figure 5b corroborates the descriptive trend, showing the absence of a difference among older age cohorts between zones and a transitory decline in educational attainment for persons who were schooling age when the regime began. The evidence suggests schooling fell among school-aged Cambodians in the Southwest.
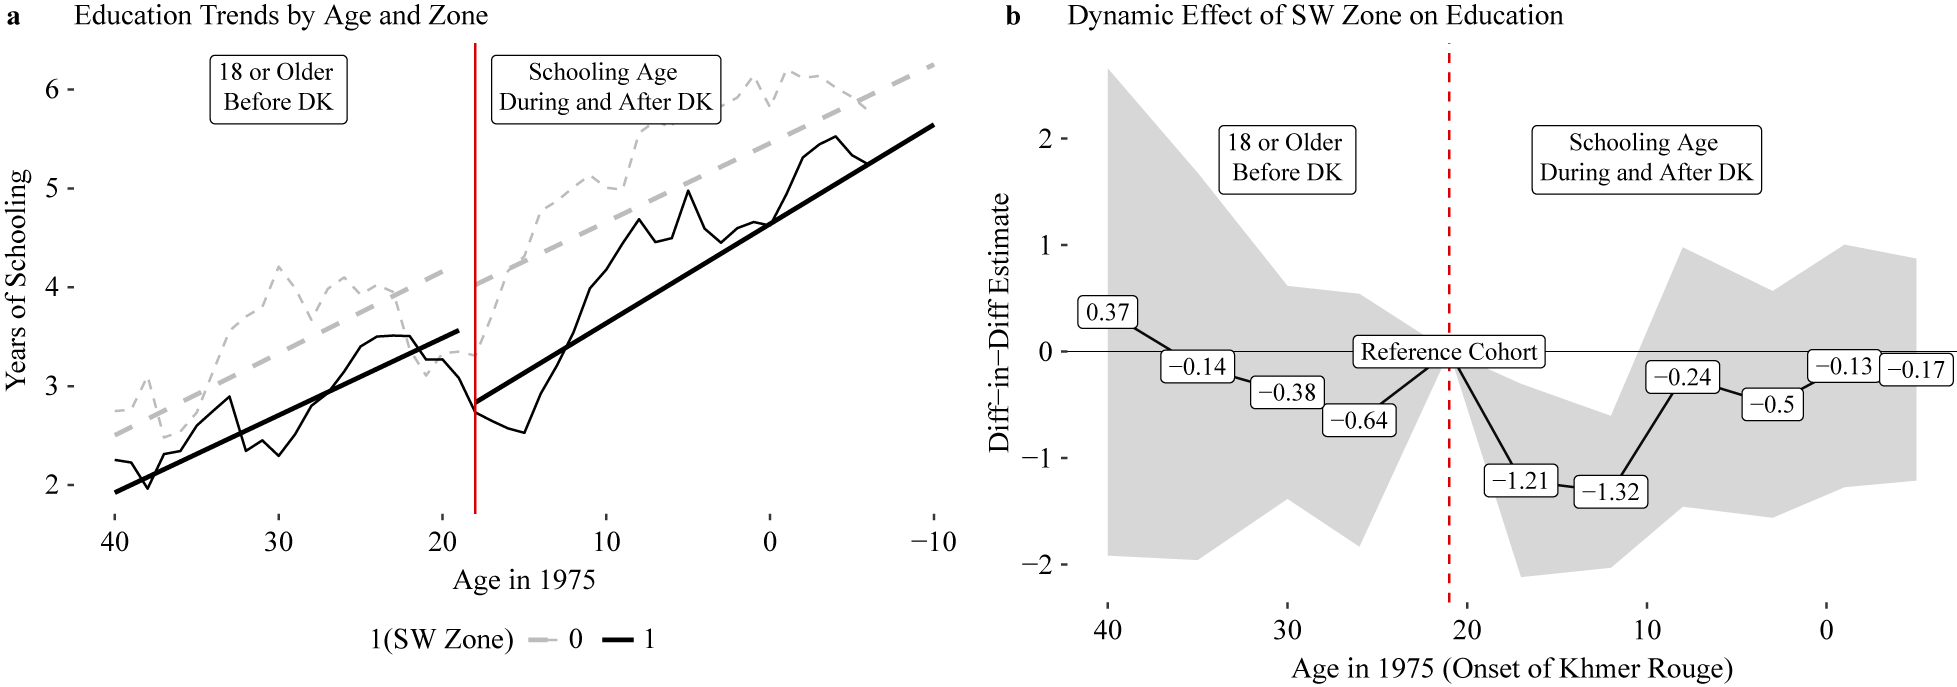
Figure 5. Educational Attainment by Age Cohort and Zone
Note: X-axis records birth cohorts in reference to 1975—individuals born in 1985 are scored−10, whereas birth in 1965 is 10. Y-axis is years of education completed. Controls include age, age $ {}^2 $
, gender, decade-by-commune fixed effects, and village fixed effects. Panel a is the raw trend—averages of schooling by age cohorts and zone, with the 5-year moving average and linear fit separated by the pre- and post-period. Panel b plots difference-in-differences coefficients (
$ {}^2 $
, gender, decade-by-commune fixed effects, and village fixed effects. Panel a is the raw trend—averages of schooling by age cohorts and zone, with the 5-year moving average and linear fit separated by the pre- and post-period. Panel b plots difference-in-differences coefficients ( $ {\beta}_c $
per Equation 2). See Table F.2 in the Dataverse Appendix for partial derivatives and uncertainty for adjusting covariates.
$ {\beta}_c $
per Equation 2). See Table F.2 in the Dataverse Appendix for partial derivatives and uncertainty for adjusting covariates.
If human capital decline persists overtime, one should observe lower human capital levels at the village level between zones. Table 3 shows the share of persons who have never attended school increases, whereas the literacy rate (of those over 15 years of age) declines. The estimates are largely commensurate with one another; whereas the percentage of persons who never attended school increases by 7% in the baseline, the share of literate persons over 15 declines by 8%. The results are substantively large, near 0.5 $ \sigma $
in the baseline estimates. In Table D.1 in the Supplementary Material, I show years of education decline by a year on average, and school attendance declines by 6% in 1998. The result is robust to adjusting for distance to schools (Table D.2 in the Supplementary Material). The education gap persists into 2008 through tertiary and secondary education (Table D.4 in the Supplementary Material).
$ \sigma $
in the baseline estimates. In Table D.1 in the Supplementary Material, I show years of education decline by a year on average, and school attendance declines by 6% in 1998. The result is robust to adjusting for distance to schools (Table D.2 in the Supplementary Material). The education gap persists into 2008 through tertiary and secondary education (Table D.4 in the Supplementary Material).
Table 3. Human Capital: Education and Literacy in 1998
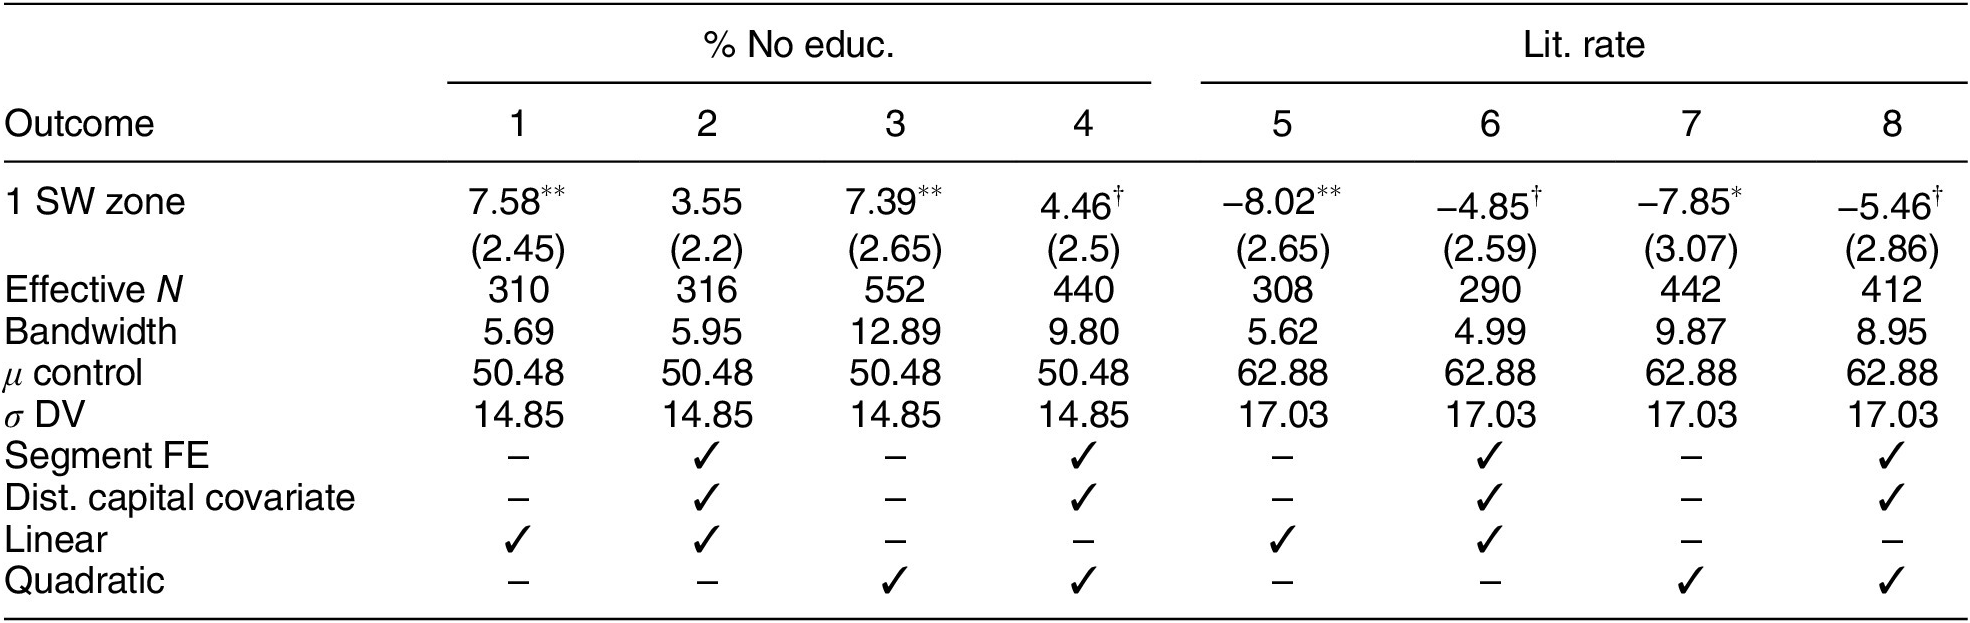
Note: See Table 2. Outcomes are the percentage of the population without education and percentage over the age of 15 who can read and write. See Table F.3 in the Dataverse Appendix for full model results. $ {}^{***}p<0.001 $
,
$ {}^{***}p<0.001 $
, $ {}^{**}p<0.01 $
,
$ {}^{**}p<0.01 $
, $ {}^{*}p<0.05 $
,
$ {}^{*}p<0.05 $
, $ {}^{\dagger }p<0.10 $
.
$ {}^{\dagger }p<0.10 $
.
The impacts of repression on schooling could vary by gender: parents may invest less in schooling daughters in the aftermath of repression, pushing female family members into care-taking roles instead of education. The pattern of lower educational attainment for females is consistent across Cambodia. Notably, this mechanism would not be a rival account to a poverty trap, rather, it would be a dimension by which the poverty trap is perpetuated. I find no consistent evidence of this pattern (Table D.5 in the Supplementary Material).
Labor Market Outcomes
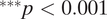
Qualitative evidence suggests the absence of educated and skilled persons drove individuals to work in low-paying jobs (Jeong Reference Jeong2014). In the Cambodian context, less schooling strongly predicts individuals being “own account workers”—self employed, typically working agricultural jobs on small-scale family farms or in otherwise informal roles. This line of work is highly labor intensive, has a low level of productivity, and involves low levels of skill and technology (Arnold Reference Arnold2008). If the decline in education caused by DK repression reshaped local labor markets by pushing individuals into low-earning informal agricultural work, one may expect an increase in the probability an individual is an own-account worker and a commensurate decline in earnings and productivity.
Table 4 shows findings consistent with this pattern. Rural persons in the Southwest are far more likely to be own account workers—self-employed informal laborers (column 1). Consistent with broader patterns of employment and earnings, column 2 shows lower income from work as well. Finally, column 3 shows earnings per hour are also lower, meaning productivity for workers also diminishes. The evidence is consistent with qualitative accounts of how state repression shaped labor markets and workers in the wake of the human capital shock from the regime. In Table D.8 in the Supplementary Material, I show own-account workers are less educated and earn less.
Table 4. Labor Market Effects of Repression
Note: Unit of analysis is employed working aged (11–59) individuals. Data from 2000 to 2001 Labor Force Survey. Pr(self-employed) is scored 1 for persons who are own account workers. Income is individual wages, remuneration, earnings, and tips reported from the last month in 10,000 riels and productivity is riels divided by working hours. Estimates are obtained using Calonico, Cattaneo, and Titiunik (Reference Calonico, Cattaneo and Titiunik2014) nonparametric RD within MSE optimal bandwidths and a triangular kernel. Covariates in local linear regressions include survey wave fixed effects, age, age squared, and gender of individual. Robust errors clustered at the village reported in (); wild cluster bootstrapped errors reported in []. $ {}^{***}p<0.001 $
,
$ {}^{***}p<0.001 $
, $ {}^{**}p<0.01 $
,
$ {}^{**}p<0.01 $
, $ {}^{*}p<0.05 $
,
$ {}^{*}p<0.05 $
, $ {}^{\dagger }p<0.10 $
. See Table F.4 in the Dataverse Appendix for full model results.
$ {}^{\dagger }p<0.10 $
. See Table F.4 in the Dataverse Appendix for full model results.
Intergenerational Consequences
Economic impacts can reverberate across generations by reducing child health. Childhood health determines later-life income levels and is partially determined by maternal economic well-being (Bleakley Reference Bleakley2010). I evaluate how the DK shock impacted subsequent generations by exploring the health of children between zones with four rounds (2000, 2005, 2010, and 2014) of Demographic Health Survey (DHS) data. Parents who lost schooling and were therefore poor as a result of Mok’s rule may have less healthy children as a result of their low income. Finding worse health outcomes for youth may highlight how repression creates persistent, negative human capital consequences beyond schooling and across generations that were never exposed to violence.
DHS randomly selects a subset of respondents and measures three critical dimensions of child health for persons aged 3–5: height for age (a measure of stunting), weight for age (a measure of wasting), and weight for height (a measure of being underweight). I create an index of health scores using the first principal component of these measures and evaluate each measure individually, and then estimate a version of Equation 1 which includes wave year fixed effects and maternal controls among rural households to maximize comparability.
Table 5 shows the health index declines by nearly 0.8 $ \sigma $
. The effect is driven by underweight and wasting children, rather than stunting, which suggests childhood food poverty drives health differences. In Table D.7 in the Supplementary Material, I show the effect is orders of magnitude larger for mothers without formal schooling, and that the difference between zones attenuates when mothers have some education, suggesting the education shock from the regime plays a crucial role in explaining health differences.
$ \sigma $
. The effect is driven by underweight and wasting children, rather than stunting, which suggests childhood food poverty drives health differences. In Table D.7 in the Supplementary Material, I show the effect is orders of magnitude larger for mothers without formal schooling, and that the difference between zones attenuates when mothers have some education, suggesting the education shock from the regime plays a crucial role in explaining health differences.
Table 5. Intergenerational Effects: Child Health between Zones
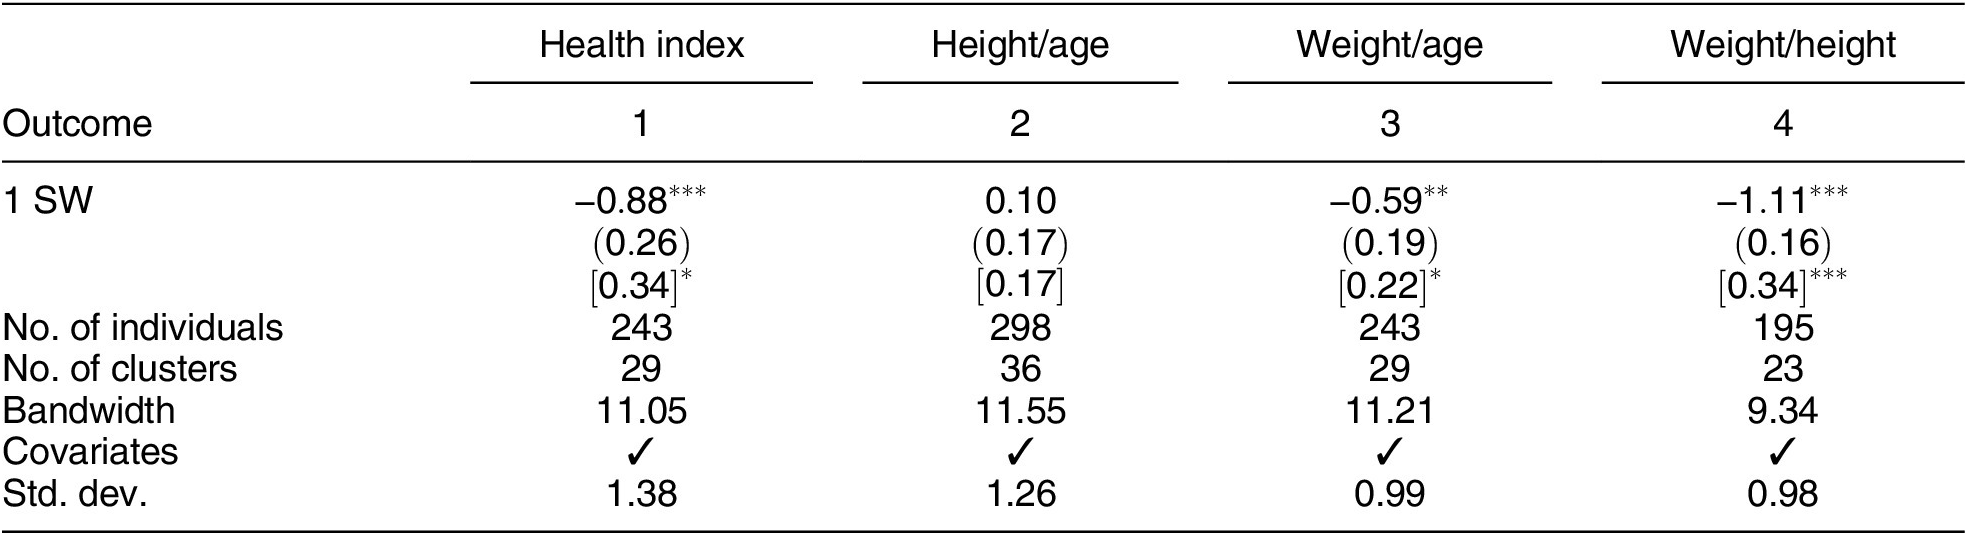
Note: Unit of analysis is the 3- to 5-year-old individual from the 2000–2014 DHS survey waves—the children of the generation exposed to the Khmer Rouge. Health index (column 1) is the first principal component of individual health measures. Height/age is the standard deviations from the median of individual height for age (stunting), Weight/age is the standard deviations from the median of weight for age (wasting), and Weight/height is the standard deviations from the median of weight for height (underweight). Analysis within rural households to maximize comparability. Controls include the age of the mother, its square, and survey fixed effects. Robust standard errors clustered at the survey area reported in parentheses. Cluster standard errors reported in parentheses and wild cluster bootstraps reported in brackets. See Table F.5 in the Dataverse Appendix for full model results. $ {}^{***}p<0.001 $
,
$ {}^{***}p<0.001 $
, $ {}^{**}p<0.01 $
,
$ {}^{**}p<0.01 $
, $ {}^{*}p<0.05. $
Alternative Mechanisms
Social Capital
Cultural persistence via social trust has been shown to be an important persistence channel linking coerced labor to modern development (Lichter, Löffler, and Siegloch Reference Lichter, Löffler and Siegloch2021; Lowes and Montero Reference Lowes and Montero2021; Nunn and Wantchekon Reference Nunn and Wantchekon2011). I use data from Cambodia’s Violence Against Women survey, which asks respondent’s three questions about communal trust and social cohesion including: (1) “Do neighbors in COMMUNITY NAME generally tend to know each other well?,” (2) “If there were a street fight in COMMUNITY NAME would people generally do something to stop it?,” and (3) “If someone in your family suddenly fell ill or had an accident, would your neighbors offer to help?” I code 1 if a respondent answers “yes” and 0 otherwise. There is little variation across villages in different zones along these dimensions, with respondent’s reporting affirmative answers at high and nearly identical rates between zones (Table 6). This suggests social capital cannot explain the developmental divergence.
Table 6. Social Cohesion and Trust
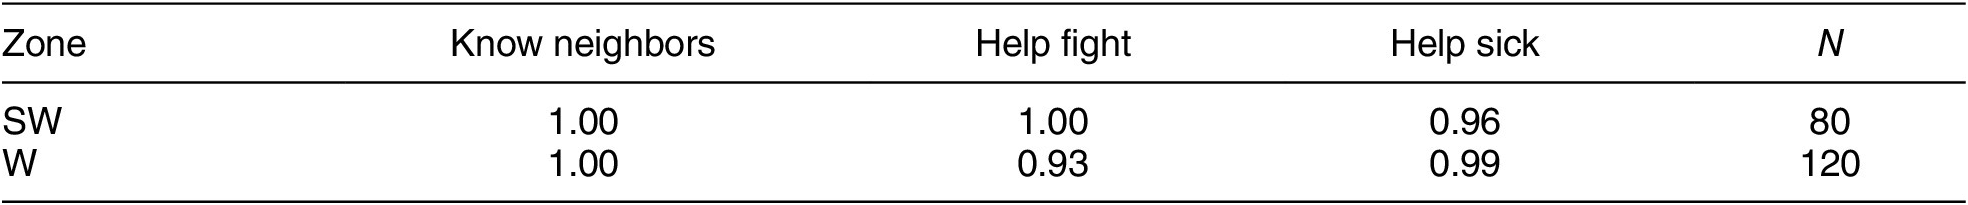
Source: WHO Women’s Health and Life Experiences Survey. Outcomes are the share of respondents reporting that they know their neighbors well (Know neighbors), whether the respondent believes people in the community would provide help if a fight broke out on the street (Help fight) and whether neighbors would help if one become sick or had an accident (Help sick). Each cell reports the proportion of respondents who reply in the affirmative divided by total respondents. SW is the Southwest zone and W is the West zone.
Property Rights
Weak property rights institutions are another channel commonly cited in the literature (Acemoglu, Johnson, and Robinson Reference Acemoglu, Johnson and Robinson2001; Dell Reference Dell2010). Since neither the DK ban on private property nor collectivization has persisted, it is unlikely formal institutional persistence explains contemporary maldevelopment. However, the destruction of records of land ownership could have increased the contestability of land, creating tenure insecurity and poverty. Social conflict as a result of extractive institutions has been shown to be a crucial persistence mechanism (Guardado Reference Guardado2018).
To measure respect for property rights, I collect data on the count of village land disputes from Commune Database Online. This measure captures a highly salient aspect of respect for property in the Cambodian context, where the highly agrarian economy has seen increasing poverty due to land grabs and unclear titling (Kerbo Reference Kerbo2014). I find no difference in land disputes at the discontinuity (Table 7).
Table 7. Land Disputes
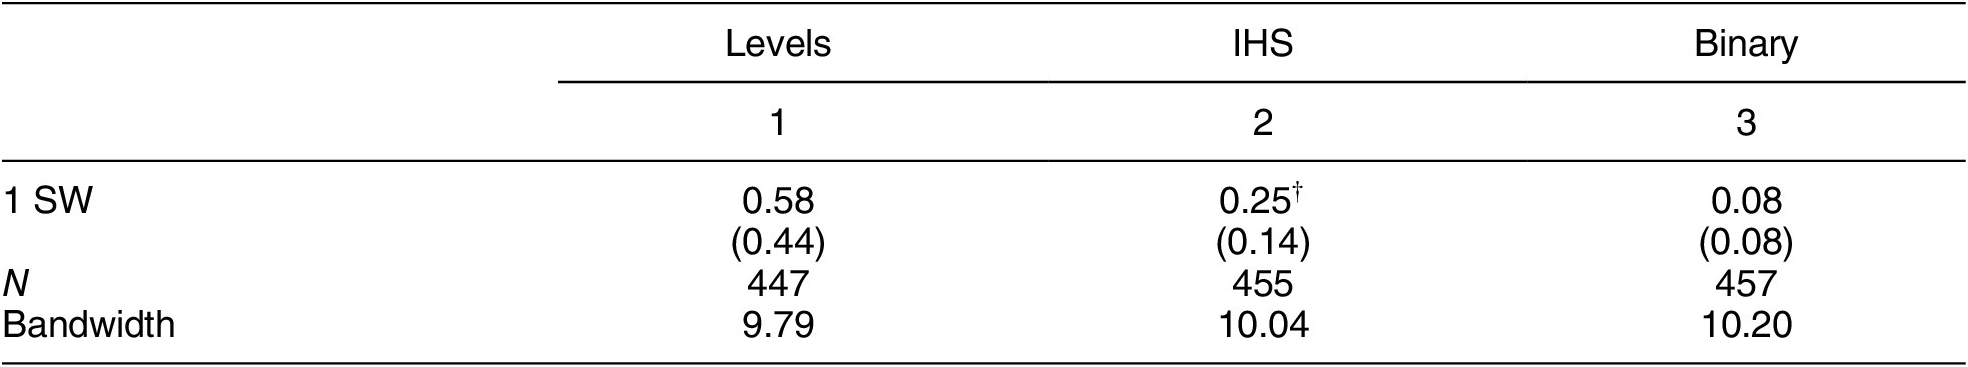
Note: RD estimates evaluating changes in land disputes. Outcomes are level of land disputes in 2008–2010 reported by the Commune Database Online. Column 1 is the count (levels), column 2 is the inverse hyperbolic sine of the count (IHS), and column 3 is a binary indicator for any dispute (binary). Standard errors reported in parentheses.
Political Legacy
A third class of explanations relates to the political dominance of former regime elites; historical coercive institutions may create politically uncompetitive environments, which outlast initial conditions. As explained, this mechanism is unlikely, as Mok and his cadres were driven from the region during Vietnam’s invasion. I measure the competitiveness of commune council elections in 2012 and 2017 (Herfindahl index, higher values represent less competitiveness) and the vote share for the ruling CPP in 2012/2017. Data are only reported at the commune level, of which there are 87 in Kampong Speu. Since the units are much larger than villages, I include all communes in the RD, but also include district fixed effects to absorb spatial heterogeneity.
Results in Table 8 show local elections are largely similar between zones. To the extent competitiveness of elections is different, elections appeared more competitive in the Southwest in 2017, where vote shares were less concentrated by 3.6 points. As such, political competition and partisan support are unlikely explanations. Another observable implication of elite capture and corruption—a key persistence mechanism in the study of extractive institutional persistence—is lower levels of public goods. In Table C.2 in the Supplementary Material, I show villages on either side of the border have similar access to hospitals, schools, and commune centers.
Table 8. Commune Council Elections (2012/2017)
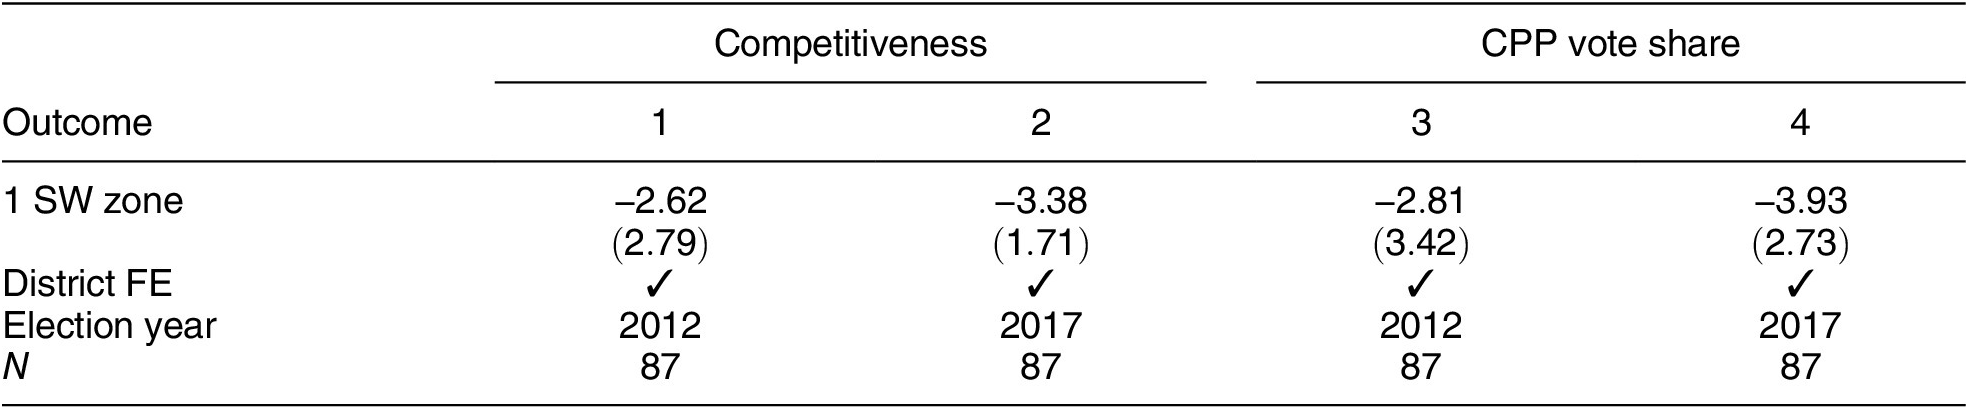
Note: RD estimates evaluating the political impact of the Southwest zone on commune council elections. Competitiveness is the share of vote shares squared (higher values mean more concentration and lower values more competitive). CPP vote share is the count of votes to CPP, the dominant ruling party, out of total votes. SHAC errors reported in parentheses.
Migration
Migration could explain my findings if a substantial proportion of wealthy individuals fled the (former) Southwest zone after the regime for the West. While this would not invalidate the design, it would mean the primary persistence channel was selective migration of more well-off civilians rather than an intergenerational human capital shock.
I treat migration as a post-treatment variable, and back out how large selective migration would need to be in order to explain the result under weak assumptions and a conservative trimming exercise. Selective migrants would need to occupy the entire top 25% of the wealth distribution in the rural West to explain the result—an implausibly high proportion considering low rates of rural—rural migration (See Table C.4 and Figure C.1 in the Supplementary Material for results and Section G in the Dataverse Appendix for explanation).
CONCLUSION
Does mass repression have a developmental legacy? If so, why do the consequences persist overtime? I argue mass repression which demographically targets the educated and intellectuals can destroy human capital in more intensely repressed localities, creating a poverty trap. I find evidence by exploiting an administrative redistricting which arbitrarily placed villages under very different rulers during the Khmer Rouge regime, creating quasi-random variation in the intensive margin of state repression. I show substantial impacts on wealth, household poverty, and human capital at the individual and village level, which spillover to the next generation via health. Whereas evidence is consistent with a poverty trap, I find no evidence in support of other important persistence channels linking coercive regimes to long-run development.
The results show the legacy of increased exposure to repression at the intensive rather than the extensive margin. Since villages in the former West zone were also repressed, albeit less severely, the counterfactual of what development would have looked like absent any repression is not estimated. However, as in Dell (Reference Dell2010), the intensive margin estimates presented here are likely a lower bound on the impact of Khmer Rouge rule at the extensive margin. Assuming the human capital destroyed in the West was more destructive to long-run development than the absence of any repression, my results showing more intense repression led to $ 0.40\sigma $
increase in poverty and a
$ 0.40\sigma $
increase in poverty and a $ 0.50\sigma $
reduction in human capital are conservative estimates of how much total wealth was lost from repression. The results are on par with the developmental impact of King Leopold’s concessions in the Congo (Lowes and Montero Reference Lowes and Montero2021).
$ 0.50\sigma $
reduction in human capital are conservative estimates of how much total wealth was lost from repression. The results are on par with the developmental impact of King Leopold’s concessions in the Congo (Lowes and Montero Reference Lowes and Montero2021).
My study shows that state repression can create multiple developmental equilibria across space, adding human capital shocks to the library of mechanisms that may link coercive institutions to worse development in the modern day (Gailmard Reference Gailmard2021). My study also shows when other theories of persistence do not generalize, and provides a within-case explanation that is plausible in contexts where governing institutions eradicate well-off or intellectual groups. Since coerced labor institutions throughout history use more violence against the highly capable, and since several dictatorships and insurgencies throughout history have targeted intellectuals, the channel I identify may be at play in many other settings, which are key avenues for future research.
The findings suggest a focus on the technology of coercion and the targets of repression is a useful starting point for making sense of developmental impacts of state violence. Since DK executed higher class civilians, factors of production changed in a way that created poverty cycles. However, as other research has shown, the impacts of repression on the economy are not homogenous or unidirectional. Unpacking how and why repression shapes poverty in the long term is not only crucial to understanding the roots of development and consequences of conflict, but it can also help scholars begin to understand why autocrats choose certain tools over others to control populations. Recent work by Sun (Reference Sun2019) is a start in this direction, illustrating how the impact of repression on wages determines the state’s counterinsurgency strategy. New avenues may interrogate why the state would chose a repression strategy that destroys wealth, or the conditions wherein the negative economic impact of repression may spur “repression traps,” wherein by creating conditions favorable for insurgent recruiting through violence, the state is forced to further rely on violence (Davenport et al. Reference Davenport, Nygård, Fjelde and Armstrong2019).
Future scholarship may consider whether or how the lingering impacts of autocratic repression moderate the effects of democratic transitions on development. Sequencing of events may shape the effect of repression in the long term; the Cambodian case is one where repression was followed by occupation and more dictatorship. Studying how the legacy of repression on development may change—or stay the same—after regime change may further elucidate mechanisms of, or solutions to, the developmental legacy of draconian dictatorships.
SUPPLEMENTARY MATERIAL
To view supplementary material for this article, please visit https://doi.org/10.1017/S0003055423000382.
DATA AVAILABILITY STATEMENT
Research documentation and data that support the findings of this study are openly available at the American Political Science Review Dataverse: https://doi.org/10.7910/DVN/RK5GOH.
ACKNOWLEDGMENTS
I thank Jennifer Gandhi, Natalia Bueno, Renard Sexton, Adam Glynn, Miguel Rueda, Marcel Roman, participants at the Virtual Workshop on Authoritarian Regimes (VWAR), and discussants and participants at MPSA and APSA (2021), the Emory Comparative Politics Workshop, the Emory Comparative Authoritarian Politics Symposium (ECAPS), and Southeast Asia Research Group (SEAREG) (Winter 2021) for comments on previous drafts, and Ben Keirnan for references and interview notes. All errors are my own.
CONFLICT OF INTEREST
The author declares no ethical issues or conflict of interest in this research.
ETHICAL STANDARDS
The author affirms this research did not involve human subjects.


 Open access