


As the population ages, osteoporosis and obesity are increasingly becoming major public health concerns. Both are considered as progressive diseases of complex aetiology. The first is characterised by low bone mineral density (BMD) and increased risk of frequent fractures, whereas the second is defined as the excessive accumulation and storage of fat. Previous studies have indicated that these disorders were interrelated( Reference Patel, Rodriguez and Yasmeen 1 – Reference Zhao, Jiang and Papasian 3 ). Many studies have reported that adipose tissue influences osteoporosis and osteoporotic fractures; therefore, adipose tissue maybe considered as a link between obesity and BMD( Reference Zhao, Jiang and Papasian 3 – Reference Kim, Yang and Cho 7 ). Several investigations have found significant positive( Reference Cobayashi, Lopes and Taddei 8 , Reference Castro, Joseph and Shin 9 ) or negative( Reference Salamat, Salamat and Abedi 6 ) effects of obesity on bone status at different regions. Adipose tissue, through the secretion of compounds, has an influence on bone density.
Recent studies have suggested that visfatin has a major function on the relationship between adipose tissue and osteoporosis( Reference Siviero-Miachon, Spinola-Castro and de Martino Lee 10 ). Visfatin, an adipocyte-secreted peptide, which is highly expressed in visceral and subcutaneous tissue( Reference Maeda, Okubo and Shimomura 11 ), was found to have a controversial effect on bone density( Reference Sucunza, Barahona and Resmini 12 , Reference Iacobellis, Iorio and Napoli 13 ), and also on bone metabolism. The insulin-mimetic effect of Visfatin also has a major role in osteoblast function( Reference Mirzaei, Hossein-Nezhad and Javad 21 ). On the other hand, the visfatin genotype is correlated to lipid serum concentration and bone density( Reference Hossein-Nezhad, Hosseinzadeh-Attar and Najmafshar 14 , Reference Jian, Luo and Gu 15 ).
It seems that visfatin has a regulatory role in lipid metabolism( Reference Basaran, Guzel and Coskun-Benlidayi 16 ), as well being correlated with dietary fat intake( Reference Park, Kim and Baik 17 – Reference de Luis, Aller and Gonzalez Sagrado 19 ), which could suggest a link between the visfatin genotype and BMD. In order to clarify the effects of individual differences, visfatin genotypes were considered. This nutrigenomics study examined the interaction between visfatin genotypes and dietary fat intake, with regard to BMD among the obese population.
Methods
Study population
This cross-sectional study included 336 individuals with a mean age of 38·25 (sd 11·69) years and mean BMI of 31·79 (sd 4·77) kg/m2, all of whom were referred to the endocrine clinic of Shariati hospital to routinely assess their health status associated with overweight and obesity from July to December 2015. None of the subjects had diabetes, heart disease, acute or inflammatory disease, a medical history of hypertension, hormone therapy or alcohol and drug abuse. All patients received adequate information about the study and written consent forms were obtained before enrolment. The protocol was approved by the ethics committee of Tehran University of Medical Sciences. The local ethics committee of Tehran University of Medical Sciences approved the study (ID: 94-01-161-28473).
Body composition measurement
Complete body composition analysis was done, whereby for all cases a Body Composition Analyzer BC-418MA (Tanita) was used. Therefore, in principle, subjects were barefoot when they were assessed by this device. To prevent a possible discrepancy in measured values, we avoided taking measurements after vigorous exercise and waited until the subject was sufficiently rested. As changes in body-water distribution and body temperature can have a major impact on measurements, they were performed in the morning in a fasting condition (always urinating before taking measurements, etc.) to get a more accurate result of the measurements every single time. For each participant, accomplished anthropometric parameters including weight (to the nearest 0·1 kg) and height (to the nearest 0·1 cm) were measured while the subjects were fasting and measured in light clothing without shoes. BMI was calculated for all patients as body weight (in kg) divided by height (in m) squared.
Bone mineral density measurements
All the subjects underwent BMD measurements by dual-energy X-ray absorptiometry of the lumbar spine (vertebrae L2–L4) and total hip. The results are presented as absolute values in g/cm2 and as standard deviation units (T score) based on comparison with the reference BMD (30-year-old young woman).
Genotyping
Visfatin genotypes were evaluated with the official symbol NAMPT and described in NCBI with gene ID (10135), which is located in Chromosome 7 (7q22.2). In this study, a variation on the visfatin gene promoter region (-4689G/T), which is registered in NCBI as SNP rs2110385, was detected by a PCR-based Restriction Fragment Length Polymorphism (RFLP) assay. Flexi Gen DNA extraction kit (QIAGEN) was used for DNA extraction from human blood. All procedures were described in the study by Körner et al.( Reference Körner, Böttcher and Enigk 20 ). Genomic DNA from all subjects was analysed for the presence of the G or T nucleotide at -4689G/T of the visfatin gene by a PCR-based RFLP assay. A PCR amplification of a 951-bp fragment of the upstream region of the visfatin gene containing the polymorphism was carried out using left primer, 5' CACTTCTTTATTTTGGGGTTGC 3', and right primer, 5' GCAGTCTGGGAGCTCTGG 3', designed and used before PC. A 25-μl PCR reaction mixture containing 2 μl of genomic DNA, 5 μl of deoxynucleotide triphosphates, 5 μl of forward and reverse primers, 5 μl of 10× buffer, 1·5 μl of MgCl2 and 0·5 μl of Taq polymerase was mixed and placed in a thermal cycler. After denaturing for 10 min at 95°C, the DNA was amplified for thirty-five cycles at 95°C for 60 s, 58°C for 60 s and 72°C for 60 s, followed by a 7-min extension at 72°C. A positive control containing genomic DNA and a negative control containing everything except DNA were included in the PCR experiment. A quantity of 5 μl of each PCR product, including the controls, were verified on a 2 % agarose gel to ensure that the expected 951-bp product was generated. A restriction digest for the DNA fragment was carried out using the AluI restriction enzyme. A quantity of 15 μl of the PCR product was digested for 16 h overnight at 37°C with 1 unit of AluI (mi-E0101L; Metabion). The RFLP procedure was performed for one-third of all samples in duplicate. The product of the restriction digest was verified on a 3 % agarose gel (stained with Ethidium bromide) and underwent electrophoresis in a 1× TRIS-Borate-EDTA buffer at 120 V for 45 min. Enzyme restriction generated six pieces. The difference between genotypes was determined by the fifth piece. The presence of a G at this piece generated a 327-bp fragment, whereas the 327-bp fragment was divided into 114- and 213-bp fragments when the fifth piece contained T heterozygous, TG genotype and three types of fragments – 327-, 213- and 114-bp fragments. The gels were visualised by UV light and the RFLP gel electrophoresis products were read by two independent people who were both unaware of the identities of samples. To test the AluI activity, a positive control was used for each run. In all, 20 % of all samples were sequenced to confirm the accuracy of the genotyping process( Reference Mirzaei, Hossein-Nezhad and Javad 21 ).
Dietary assessment
All enrolled subjects received instructions to record their daily dietary intake nutrient for a 3-d 24-h dietary recall (2 weekdays and one during a weekend). Records were reviewed by a dietitian and analysed and were checked for clarification about food consumption and quantities. Analysis of the data was done to obtain fat intake percentage( Reference Pereira, Araujo and Lopes 22 , Reference Shim, Oh and Kim 23 ).
Statistical analysis
First, for the evaluation of the normal distribution of quantitative variables, Shapiro–Wilk test was conducted. The total sample size with a two-sided α=0·05 and 80 % power (β=0·2) could detect a Cohen’s d effect size of 0·5 for differences in bone characteristics between groups with intake of fats. The differences between genotypes were assessed by one-way ANOVA test. The differences between groups with a high percentage of dietary fat intake (more than 30 % of total energy content) and a low percentage of dietary fat intake (≤30 % of total energy content) were also assessed by independent-sample t test and re-analysed by ANCOVA to adjust for the confounders effect, including age and dietary energy intake.
We considered BMD as a dependent variable and both visfatin genotype and fat intake as covariates in general linear model analysis to determine the interaction model. We included visfatin genotype, fat intake and visfatin genotype×fat intake in a custom model; also, we tabulated the CI by using estimate parameter from option tab. Next, to find the significance, we evaluated the interaction based on type of fat intake such as median of PUFA, MUFA and SFA by the same direction.
The study diagram can be seen in Fig. 1. The t test was used to determine the contribution of each of the macronutrients between medians of total fat, PUFA, MUFA and SFA. The level of significance was set at a probability of ≤0·05 for all tests. Statistical analysis was performed using SPSS version 22.0 (SPSS).
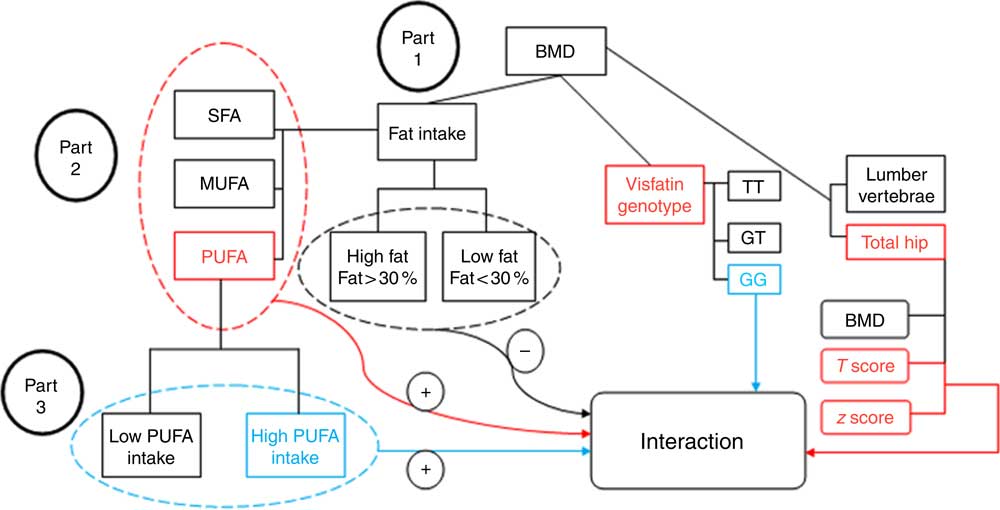
Fig. 1 Study diagram. First, the analysis investigated the participants’ bone mineral density (BMD) status based on visfatin genotype and fat intake. Part 1: evaluation of the interaction between fat intake and BMD related to visfatin genotype; the results found no interaction between them (−) (by one-way ANOVA). Part 2: evaluation of the interaction based on fat type intake; an interaction was found between PUFA intake and hip T score and z score on the one hand, and visfatin genotype on the other (+) (by general linear model (GLM) model). Part 3: determining the genotype determinative (GG) of this interaction (+) based on the amount of PUFA intake (by GLM model).
Results
Clinical characteristics of the study participants
The clinical and biochemical characteristics of 336 participants are shown in Table 1. All the participants in the study were obese. Mean age, weight, height and BMI are 38·25 (sd 11·69) years, 82·88 (sd 14·06) kg, 161·52 (sd 7·97) cm and 31·79 (sd 4·77) kg/m2, respectively (see Table 1).
Table 1 Biochemical and clinical characteristics of the 336 study participants (Mean values and standard deviations)
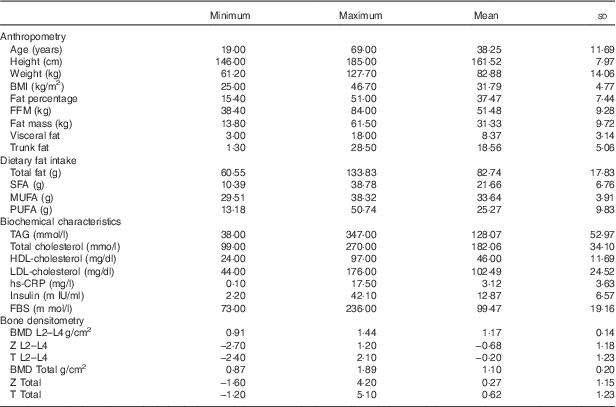
FBS, fasting blood sugar; hs-CRP, high sensitivity C-reactive protein; FFM, fat-free mass; TBW, total body water; BMD, bone mineral density; total hip, L2–L4 (L) lumbar.
Characteristics of the study population based on visfatin genotypes
All participants were categorised in three groups (GG, GT and TT) according to genotype. The characteristics of the participants, according to genotypes of the rs2110385 polymorphism, are shown in Table 2. All analysed genotypes were distributed according to the Hardy–Weinberg equilibrium law in participants (P>0·05). The frequencies of homozygous major allele (GG), heterozygous (GT) and homozygous minor allele of SNP ‘rs2110385’ were 33·92, 48·51 and 17·54 %, respectively, with 86·6 % of participants being women.
Table 2 Study population characteristics based on visfatin genotypes (Mean values and standard deviations)
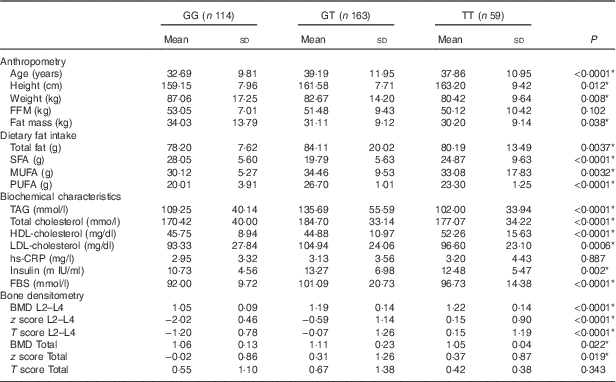
FBS, fasting blood sugar; hs-CRP, high sensitivity C-reactive protein; FFM, fat-free mass; TBW, total body water; PTH, parathyroid hormone; BMD, bone mineral density; Total hip, L2–L4(L) lumbar.
* P<0·05.
After genotype categorisation, significant differences were found between groups for age, height, weight, fat mass, TAG, HDL, T-cholesterol, fasting blood sugar (FBS) and LDL-cholesterol (P<0·05). The results showed that lumbar BMD was significantly higher for participants with TT genotype (P<0·0001), similar to the lumbar T score (P<0·0001). The present study shows significant z score differences in both sites. We found higher z score for subjects with the TT genotype at the hip site (P=0·019), and also at the lumbar region (P<0·0001). This study found significant differences between all types of dietary fat intake among genotypes of visfatin (P<0·05). There were no significant differences for FFM, high sensitivity C-reactive protein (hs-CRP) and hip T score between different genotype groups (Table 2).
Characteristics of the study population, based on fat intake
All 336 participants were divided into two groups based on fat intake (≤30 % of total energy content (23·7 % of participants) and more than 30 % of total energy intake (76·3 % of participants). Before adjustment for age and energy intake, significant differences between groups were found for age, weight, fat percentage, fat mass, visceral fat, TAG, HDL-cholesterol, lumbar BMD and T score, as well as hip BMD and T score (P<0·05). After adjustment for age and energy intake, significantly higher levels of fat percentage, fat mass, visceral fat and hs-CRP (P<0·05) were remained in women with high fat intake and the significant differences in BMD at both regions were lost (Table 3).
Table 3 Characteristics based on dietary fat intake: ≤30 % of total energy intake v. >30 % of total energy intake (Mean values and standard deviations)
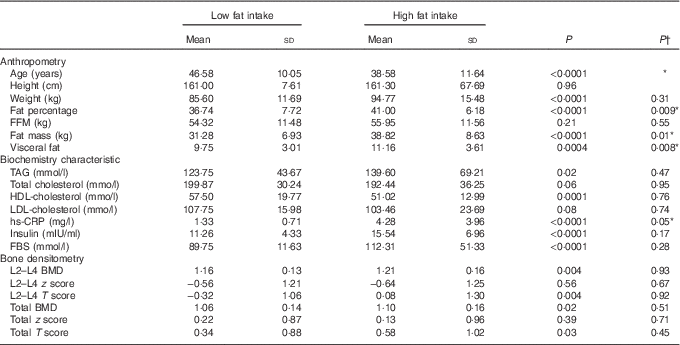
FBS, fasting blood sugar; hs-CRP, high sensitivity C-reactive protein; FFM, fat-free mass; TBW, total body water; PTH, parathyroid hormone; BMD, bone mineral density; Total hip, L2–L4(L) lumbar.
*P<0·05.
† After adjustment for age and total energy intake.
Gene–diet interaction
Using the general linear model, the interaction between visfatin genotypes and different types of dietary fat intake (PUFA, MUFA and SFA) on bone density was examined. The results showed there was an interaction between visfatin genotypes with dietary PUFA intake in terms of hip T score and z score (P=0·043, B=−0·08; P=0·04, B=−0·078, respectively) while we found any interaction between other types of dietary fat intake such as MUFA, SFA also total dietary fat intake with visfatin genotype on BMD, T score and z score of hip and lumbar (Table 4). Following the classification of participants into two groups based on median PUFA intake, we found that participants with GG genotype who had high PUFA diets had lower hip T scores and z scores; however, both other genotypes showed changes in different directions (Fig. 2). On the other hand, to clarify the effect of other dietary intakes, we used independent-samples t tests to evaluate the difference of macronutrients and kcal (kJ) intakes among both high and low medians of different types of dietary fat intake. As shown in Table 5, participants who were in the high PUFA intake group had lower energy (P=0·02) and protein (P=0·0016) intake than those in the low PUFA intake group, but there was a significant difference between carbohydrate intake level among medians of PUFA intake (Table 5).
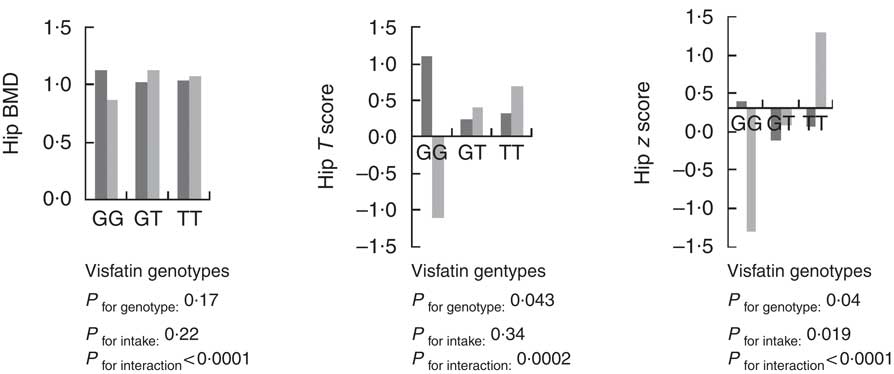
Fig. 2 Interaction between amount of PUFA intake and visfatin genotype (rs2110385) on hip bone mineral density (g/cm2), T score and z score. Custom model in general linear model; BMD is considered as a dependent variable in this model, and PUFA, visfatin genotype and genotype×intake PUFA are covariate. ![]() , Low PUFA intake;
, Low PUFA intake; ![]() , high PUFA intake. * P<0·05.
, high PUFA intake. * P<0·05.
Table 4 Evaluation of interaction between type of fat intake and visfatin genotypes on bone mineral density (β-Coefficients and 95 % confidence intervals)
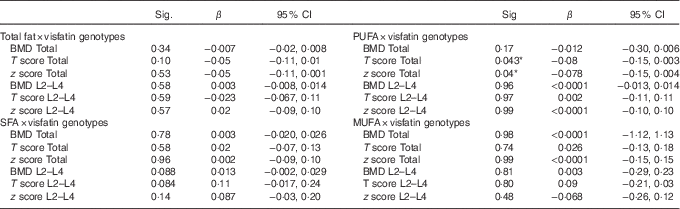
BMD, bone mineral density; Total hip, L2–L4 (L) lumbar; visfatin genotype; GG, GT, TT.
Custom model in general linear model; bone mineral density as a dependent model, visfatin Genotype×Medians intake PUFA. Data were extracted from parameter estimates by general linear model.
* P<0·05.
Table 5 Distribution of macronutrients based on types of dietary fat intake†‡ (Mean values and standard deviations)
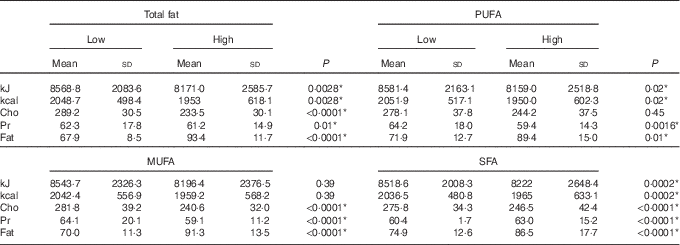
Cho, carbohydrate; Pr, protein.
* P< 0·05.
† t Test analysis, all variables adjusted by energy.
‡ Medians of PUFA (22·8 g), MUFA (33 g), SFA (19·7 g) and total fat (79·1 g).
Discussion
According to the results, it was found that women with TT genotype had higher lumbar BMD, whereas those with GT genotype had higher hip BMD. In examining the interaction between fat intake and BMD among genotypes of visfatin, the percentage and type of dietary fat intake was investigated. High and low percentages of fat intake did not play a crucial role, but study results were different for various types of fat. This means that women with GG genotype who consumed high-PUFA diets had lower bone density at total hip. However, for the other two genotypes, PUFA intake and bone density were directly related at the hip site, but this interaction was not found at the lumbar spine. This study was the second one to investigate the association between visfatin genotype and BMD. In a similar study, Mirzaei et al.( Reference Mirzaei, Hossein-Nezhad and Javad 21 ) examined diabetic patients with regard to the relationship between visfatin genotypes and BMD; it was found that diabetic patients with GG genotype had significantly lower hip z scores.
Another finding of this study indicated that women with GT genotype had significantly higher TAG, total cholesterol, FBS, insulin and lower HDL, compared with both other genotypes. A recent study( Reference Mirzaei, Hossein-Nezhad and Javad 21 ) found a significant difference in HDL similar to this study, but no other association with other lipid profile components was reported. In contrast to our research, Rehiem & Gado( Reference Rehiem and Gado 24 ) carried out a case–control study among an Egyptian population, and found that individuals with the GG genotype had higher HDL.
By first categorising participants based on percentage of fat intake, it was indicated that – after adjustment for age and total energy, through a linear regression model – there were no significant differences between BMD and fat intake at three regions based on visfatin genotypes. However, significant relationships were found between hs-CRP, 25(OH)2D, fat percentage, fat mass, visceral fat and fat intake. Somewhat similar to the present study, previous experiments have indicated a positive association between high fat intake and fat mass, fat percentage and visceral adiposity( Reference Neville, Geppert and Min 25 – Reference Bowen, Taylor and Sullivan 27 ). A large number of studies found that high-fat diets increased hs-CRP( Reference Rankin and Turpyn 28 ), and also the absorption and bioavailability of vitamin D, which was similar to our results( Reference Raimundo, Faulhaber and Menegatti 29 – Reference McLarnon 32 ).
In the second part, fat type interaction related to BMD and visfatin genotype was examined. The result was that an inverse association between high-PUFA diets and hip z score was found among women with GG genotype; this proved to be different from both other genotypes. Previous studies have shown paradoxical results related to the effect of PUFA intake on bone density. Harris et al.( Reference Harris, Farrell and Houtkooper 33 ), for example, found a negative association between dietary PUFA intake and BMD at the spine, total body and Ward’s triangle BMD, but only among postmenopausal women who were using hormone therapy (HT). However, in a group without HT, no significant association was seen. In another study carried out by Järvinen et al.( Reference Järvinen, Tuppurainen and Erkkilä 34 ), a significant positive effect of PUFA on lumbar bone status in women without hormone therapy was demonstrated. Recent studies have also indicated that various types of PUFA intake, such as linolenic acid( Reference Orchard, Steven and Lu 35 , Reference Farina, Kiel and Roubenoff 36 ) and arachidonic acid( Reference Farina, Kiel and Roubenoff 37 ), were associated with reduced hip fracture rates. Similarly, Virtanen et al.( Reference Virtanen, Mozaffarian and Willett 38 ) found no significant relationship between PUFA and hip fracture rates among either sex in a cohort study, but low PUFA intake (especially linoleic acid) was considered as a risk factor of hip fracture only for women( Reference Virtanen, Mozaffarian and Cauley 39 ). To evaluate the effect of dietary intake such as carbohydrate, protein and fat, a one-way ANOVA was used. Previous studies have shown positive effects of high protein intake and increased BMD( Reference Rapuri, Gallagher and Haynatzka 40 , Reference Promislow, Goodman-Gruen and Slymen 41 ). The present study found participants who were in the high PUFA intake group had low intake of energy and protein, and so we concluded that protein and energy intakes could not explain the high PUFA intakes.
As mentioned above, the significant effect of PUFA intake on BMD is not clear, and the evidence is controversial. In order to further examine this, visfatin was considered as an efficient adipokine related to dietary fat metabolism, and thus evaluating visfatin genotypes seemed promising. Previous studies had suggested an effective role of visfatin serum level on bone status among patients with inflammatory bowel disease( Reference Terzoudis, Malliaraki and Damilakis 42 ) and cancer patients( Reference Siviero-Miachon, Spinola-Castro and de Martino Lee 43 ), but in opposition to these recent publications, Iacobellis et al.( Reference Iacobellis, Iorio and Napoli 13 ) and Sucunza et al.( Reference Sucunza, Barahona and Resmini 12 ) – who investigated patients with the metabolic syndrome and acromegaly, respectively – both found a negative association of visfatin with BMD. On the other hand, Tohidi et al.( Reference Tohidi, Akbarzadeh and Larijani 44 ) and Zhang et al.( Reference Zhang, Xie and Zhao 45 ) who worked on postmenopausal women, and Peng et al.( Reference Peng, Xie and Zhao 46 ), whose focus was on men, found no correlation between BMD and visfatin. Given that, it has been shown that visfatin has many effects on fat and glucose metabolic pathways( Reference Jian, Luo and Gu 15 ), insulin resistance( Reference Zhang, Gottardo and Thompson 47 ) and lipid profiles in adult patients with diabetes( Reference Mirzaei, Hossein-Nezhad and Javad 21 ), obesity( Reference Blakemore, Meyre and Delplanque 48 ) and inflammation( Reference Tabassum, Mahendran and Dwivedi 49 ). It seems that owing to inconsistencies between studies, it may be necessary to examine the genetic diversity among the population. Following our previous study( Reference Hossein-Nezhad, Hosseinzadeh-Attar and Najmafshar 50 ) on the relationship between visfatin genotype and BMD among diabetic patients, the present study was carried out with the aim of examining dietary fat intake in relation to the correlation between BMD and visfatin genotype. Women with GG genotype who had high PUFA intake diets had lower hip z scores and T scores.
The current study has a number of limitations. All participants in the study were overweight or obese; therefore, the findings from the present study may not be generalisable to individuals with low or normal BMI. There were no longitudinal data in order to determine any longer-term effects of PUFA on BMD among different genotypes. The daily routine intakes of all participants were monitored, which perhaps changed the results, compared with a case–control or clinical study. Any changes about PUFA intake and BMD over time could not be reflected in this cross-sectional study because they were assessed only with single measurements. As a nutrigenomics study, no previous study has investigated the influence of visfatin genotype related to effect of types of dietary fat intake on BMD. Previous studies had researched the effect of PUFA on BMD, and as the results were inconsistent the present study is the first one that examined visfatin genotypes as an interaction study.
It is concluded that subjects with GG genotype and high PUFA diets had lower hip z scores and T scores, unlike the other genotypes. Understanding the complex mechanisms of these changes needs more randomised, controlled future studies among larger populations to examine the interaction of molecular and metabolic mechanisms.
Acknowledgements
The authors acknowledge Tehran University of Medical Sciences and Osteoporosis Research Center, Tehran, Iran, for allowing us to conduct this cross-sectional study.
This work was supported by the Tehran University of Medical Sciences (grant no.: 94-02-161-29564)
Study concept and design and study supervisions: K. M.; acquisition of data, critical revision of the manuscript for important intellectual content and administrative, technical and material support: K. M. and L. K.; analysis and interpretation of data: K. M. and S. A. K.; drafting of the manuscript: L. K. and Z. M.; statistical analysis: K. M. and Z. M.
The authors declare that there are no conflicts of interest.


