


Impact statement
The article extensively explored data on the progress of SDG 6, reflecting actions that are being taken across many geographical regions globally. Although too slow, and unequal across countries, progress was made globally on SDG 6 between 2015 and 2020. In 2020, 2 billion people (26%) lacked safely managed drinking water, and 3.6 billion (46%) lacked safely managed sanitation services. In many countries and regions, key statistical data are missing or not available; an issue which has been made considerably worse as a result of the COVID-19 pandemic. The COVID-19 pandemic followed by the Russia–Ukraine war had a significant negative impact on society, the environment and the global economy with hundreds of thousands of lives lost. The economic impacts impeded the prospects of a recovery of already fragile economies, particularly for low- and middle-income countries, creating sharp increases in food, energy and medical supplies, and disruptions to water and sanitation services due to fuel shortages and power cuts. Donors and governments are noted to likely divert funding from the WASH sector to emergency response and health care, resulting in a significant reduction in overall funding for the sector. This may restrict the ability of low- and middle-income countries to invest in new water, sanitation and hygiene infrastructure in the near future. The full extent of these impacts on the WASH sector is yet to be understood.
Introduction
The UN Sustainable Development Goal 6 (SDG 6) was established to ensure the availability and sustainable management of water and sanitation for all by 2030 (Agenda 2030). Compared to the Millenium Development Goals (MDGs), driven by a top-down process, and coordinated by a small number of powerful political entities (the United States, Europe and Japan), the SDGs were designed as a participatory programme to be driven by the participating member countries. The MDGs were widely heralded for highlighting poverty reduction and social development as the most important development problems meeting basic needs in poor countries, while the SDGs addressed issues of poverty, environmental sustainability, economic development and social equity, aiming beyond a focus on ‘basic needs’. Fundamentally, the SDGs replaced the MDGs’ poverty agenda with an agenda for ‘sustainable development’ (Fukuda-Parr, Reference Fukuda-Parr2016) (Bandola-Gill et al., Reference Bandola-Gill, Grek, Tichenor, Bandola-Gill, Grek and Tichenor2022). To measure the progress of SDG 6, there are 8 targets and 11 indicators associated with these targets. This article focuses on targets 6.1 and 6.2. Target 6.1 aims to achieve universal and equitable access to safe and affordable drinking water for all, while target 6.2 aims to achieve access to adequate and equitable sanitation and hygiene for all and end open defecation by 2030. Target 6.1 is measured by indicator 6.1.1, the proportion of population using safely managed drinking water services. Target 6.2 is monitored using indicator 6.2.1, with two sub-indicators: 6.2.1a – the proportion of population using safely managed sanitation services, and 6.2.1b – the proportion of population using handwashing facilities with soap and water (WHO/UNICEF, 2017).
Most of the member states were responsible for collecting and sharing information when the 2030 Agenda was adopted. The United Nations pledged to support the members in implementing the agenda.
Country data are compiled and validated by indicator-specific custodian agencies, who submit the data, along with regional and global aggregates, to the United Nations Statistics Division (unwater, n.d.).
Some definitions of safe drinking water, sanitation and hygiene
The WHO/UNICEF Joint Monitoring Programme (JMP) uses a standard classification and estimation method to compare progress across countries, regions and the world. To achieve this, it provides recommendations on drinking water and sanitation service levels and hygiene through its JMP service ladders that help to benchmark and compare service levels across countries. The water and sanitation service ladders have been updated and expanded to facilitate enhanced global monitoring and build on the established improved/unimproved facility type classification and introduce new rungs with additional criteria relating to service levels. Hygiene is now explicitly referenced in the SDG targets/indicators, having been completely absent in all MDG targets or indicators. There appear to be differences in the definitions used in the water, sanitation and hygiene sectors in national data sources that make comparisons between countries sometimes difficult (WHO/UNICEF, 2021). We apply the JMP definitions and service-level classifications for the discussions in this article, as below.
Drinking water quantity and quality recommendations
Water quantity
A quantity of approximately 50 l per person per day on average is recommended by WHO, to provide water with low public health risks associated with poor hygiene. With approximately 20 l per person per day on average the public health risks are high and hygiene may be compromised (WHO, 2017).
Some definitions of water sources and quality
According to the SDG Indicator Metadata (unstats, 2022), the term ‘drinking water source’ refers to the point where people collect water for drinking and not the origin of the water supplied. For example, water collected from a distribution network that draws water from a surface water reservoir would be classified as piped water, while water collected directly from a lake or river would be classified as surface water.
The official criteria for indicator 6.1.1 is that the population must use a ‘Safely Managed drinking water service from an improved source’, the highest level in the drinking water source ladder.
The following definitions in relation to water sources and quality have been adopted from the indicator metadata referred to above, for discussions in this article.
‘Improved’ drinking water sources include the following: piped water, boreholes or tube wells, protected dug wells, protected springs, rainwater, water kiosks, and packaged or delivered water. An improved drinking water source does not imply safe drinking water.
The proportion of population using an improved source of drinking water was the indicator used to track progress on drinking water before the SDGs, during the MDG era (WHO / UNICEF, 2020).
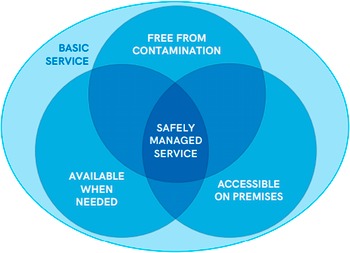
‘Safely managed’ drinking water must satisfy the following 3 criteria:
-
• Quality: ‘Free from faecal and priority chemical contamination’, as specified in the WHO Guidelines for Drinking Water Quality. The priority indicator of microbiological contamination is E. coli (or thermotolerant coliforms), and the priority chemical contaminants are arsenic and fluoride;
-
• Accessibility: accessible on the premises (if the point of collection is within the dwelling, compound, yard or plot, or water is delivered to the household), and;
-
• Availability: water should be available when needed (if households report having ‘sufficient’ water, or water is available ‘most of the time’; i.e., at least 12 h per day or 4 days per week).
Five levels of the drinking water source ladder
There are five levels of drinking water sources associated with quality, from highest to lowest as follows: ‘Safely Managed from an improved source’ followed by ‘Basic’, ‘Limited’, ‘Unimproved’ and ‘Surface water’ (Figure 1).

Figure 1. Elements of safely managed drinking water services (WHO/UNICEF, 2020).
Level 1: Safely managed service from an improved water source (called, safely managed):
For target 6.1.1 reporting, a safely managed drinking water tracks the proportion of population using water from (a) an ‘improved water source’ and (b) satisfying the criteria of a ‘safely managed’ drinking water services.
Level 2: Basic Service (not ‘safely managed’):
-
• Drinking water is from an improved source
-
• Does not fulfil the ‘Safely managed’ criteria
-
• Collection time is not more than a 30-min round trip, including queuing.
Level 3: Limited Service (not ‘safely managed’):
-
• Drinking water is from an improved source
-
• Does not fulfil the ‘Safely managed’ criteria
-
• Collection time is more than a 30-min round trip, including queuing.
Level 4: Unimproved sources (not ‘safely managed’):
‘Unimproved’ drinking water sources include unprotected dug wells or unprotected springs.
Level 5: Surface water (not ‘safely managed’):
Surface water includes rivers, reservoirs (dams), lakes, ponds, streams, canals and irrigation channels, all of which are by nature of their design and construction unlikely to deliver safe water.
Improved drinking water sources alone does not mean safely managed drinking water
According to the SDG Indicator Metadata definitions, piped water is classified as ‘improved’. Experience with piped water (improved source) in developing countries shows that to satisfy the accessibility criteria, piped water supply is often provided to communities without any form of treatment. Such piped water supplies usually contain excessive turbidity and E. coli, particularly during rainy seasons. Therefore, receiving water from an improved water source does not necessarily provide assurance that the water is free from microbial and chemical contamination. As you will see in the discussion below, satisfying accessibility criteria, supplying untreated water through piped supply to rural communities is often practised in the provision of drinking water to communities in developing countries even in 2023. The concern of supplying drinking water without disinfection to rural communities was highlighted in an ICE conference publication in 2006 and noted that it is quite common even in many donor-funded projects in developing countries (Puvanachandran et al., Reference Puvanachandran, Rajapakse and Mandawali2006). Recently published data on water quality by water source type in 27 low- and middle-income countries (LMICs) showed that the quality of piped water varied considerably between countries, with >20% of the population using piped water that exceeded 100 E. coli CFUs/100 mL in Chad, Lao PDR, Nepal, Nigeria and Sierra Leone (Bain et al., Reference Bain, Johnston, Khan, Hancioglu and Slaymaker2021). Although an improved source such as an untreated piped water supply is less likely to be contaminated by human excreta (E. coli) between point of collection (PoC) and point of use (PoU) and could be a better option than an unimproved source, both options do not satisfy the criteria of safe water.
Sanitation service-level recommendations
SDG target 6.2 is monitored using indicator 6.2.1, which has two sub-indicators 6.2.1a – proportion of population using safely managed sanitation services; and 6.2.1b – proportion of population using a handwashing facility with soap and water. Indicator 6.2.1a is measured using the JMP ladder for sanitation, which defines five service levels, ranging from open defecation (lowest level of service) to safely managed sanitation services (highest level of service) (Figure 2). This ladder builds upon the MDG and in many cases extends the indicator of ‘use of improved sanitation facilities’, by including additional aspects of the quality of service. WHO/UNICEF defines ‘”improved sanitation facilities” as those designed to hygienically separate excreta from human contact and include: flush/pour flush toilets connected to piped sewer systems, septic tanks or pit latrines; pit latrines with slabs (including ventilated pit latrines), and composting toilets’ (WHO, 2023). The adoption of improved sanitation facilities cannot be considered safe from a public health perspective if faecal matter is allowed to accumulate and overflow into the environment or is emptied and unsafely dumped in unregulated disposal sites due to the lack of a functional faecal sludge management (FSM) service chain. The new SDG target for ‘safely managed sanitation’ thus not only challenges governments to reach universal access to unshared, improved sanitation facilities but also ensures that facilities are coupled with proper faecal sludge management.

Figure 2. Elements of safely managed sanitation services (WHO/UNICEF, 2017).
We adopted the JMP sanitation definitions for the discussions in this article (WHO and UNICEF, 2017):
-
- Level 1: Safely managed sanitation service – Use of improved sanitation facilities that are not shared with other households and where excreta are treated and safely disposed of in situ or transported and treated off-site
-
- Level 2: Basic sanitation service – Use of improved facilities that are not shared with other households
-
- Level 3: Limited sanitation service – Use of improved sanitation facilities shared between two or more households
-
- Level 4: Unimproved sanitation service – Use of pit latrines without a slab or platform, hanging latrines or bucket latrines
-
- Level 5: Open defecation – Disposal of human faeces in fields, forests, bushes, open bodies of water, beaches and other open spaces or with solid waste
It is important to note that safely managed sanitation can be achieved through the use of either sewered sanitation or non-sewered (on-site) sanitation technologies, but the information needed for classification is different. Use of sewered sanitation can only be considered as safely managed services if the resulting blackwater is transported to an off-site treatment plant and undergoes secondary or higher-level treatment (or primary treatment with effluent discharged through a long ocean outfall). The use of toilets or improved latrines connected to on-site storage/treatment in septic tanks or pits are also classified as safely managed if the containment system effectively separates its contents (i.e., excreta) from consumers and the environment, and the excreta either are removed and treated off-site or remain stored and are considered treated and disposed of in situ.
Indicator 6.2.1b is measured using the JMP ladder for hygiene and prioritises the presence of a handwashing facility with soap and water on-premises as the indicator for national and global monitoring. It defines three service levels: (i) no service – households that have no facility at all (lowest level); (ii) limited service – households with a facility but lack water or soap, and (iii) basic service – households with a handwashing facility with soap and water available on-premises (highest level).
Materials and methods
The SDG Index and SDG 6 indicators provide national or regional accomplishments in relation to water, sanitation and hygiene towards the Agenda 2030, hence will be used as a report card to assess the progress of a nation or a geographic region.
SDG progress data (SDG Index & SDG 6 indicators) are retrieved from international organisations including United Nations, World Bank, WHO / UNICEF (Joint Monitoring Programme for Water Supply, Sanitation and Hygiene – JMP) and the Sustainable Development Reports (SDRs) 2021 and 2022 as cited in the text. The two SDRs are joint annual publications of the Sustainable Development Solutions Network and Bertelsmann Stiftung, published by the Cambridge University Press (Sachs et al., Reference Sachs2021; Reference Sachs2022). The reports deal with information from both government and non-official sources, but the contents do not reflect the mandate of the organisations or agencies such as the World Bank and other international organisations. In situations, where data are lacking, the authors used other metrics to close the gaps. For example the UN-Water SDG 6 Data Portal (n.d.)) was used for safe water and sanitation data and for basic water and basic sanitation data when available, while the Sachs et al. SDR Reports (2021 and 2022) were used for SDG Index and the newly defined ‘at least basic’ water and sanitation services data. The term ‘at least basic’ services will be explained later.
The SDR Reports contain 91 global indicators and 30 additional ones for the OECD (Finmark Trust, 2020) countries. In addition, the SDG Index covers 165 countries. The SDG Index only includes nations for which data are available for at least 80% of the variables listed in the global SDG, and for coverage data must be available for at least 80% of the nation with a population higher than one million. This reduces biases resulting from missing data.
The two main categories used to group the 165 countries are (1) geographic region and (2) income level. This categorisation is for statistical convenience and does not deal with political or other affiliations of countries or territories by the United Nations.
Global trends of SDG Index by geographical regions
Figure 3 below shows a snapshot of the SDG Index in different SDG regions and income groups, compared with the world index for the years 2017 to 2022. Based on gross national income (GNI), the World Bank assigns the world’s economies to four income groups: low (<US$ 1,085), lower-middle, upper-middle and high-income (>US$ 13,205) – a total of 217 countries. Only data for low- and high-income groups are presented here with SDG regions for comparison purposes. The COVID-19 pandemic and the Russia–Ukraine war have clearly been major setbacks for nearly every aspect of sustainable development and may have even led to a regression in SDG progress. As a result, the global SDG Index has been stagnant at 66 for the years 2021 and 2022. In 2022, high-income countries performed 11.5 points higher than the world average of 66, while low-income countries were 14.4 points lower at 51.6. Sub-Saharan Africa and Oceania performed below the world average, while other regions were on par or slightly better than the world average.

Figure 3. SDG Index for Geographical Regions and Low- and High-Income Countries, 2017–2022 (Sachs et al., Reference Sachs2021; Reference Sachs2022).
It is obvious that high-income countries are more likely to achieve most of the targets than other countries, but current data show that none are on track. These countries are doing well on some of the indicators, particularly on goals related to socioeconomic outcomes and basic access to infrastructure and services – SDG 1 (No Poverty), SDG 3 (Good Health and Well-Being), SDG 6 (Safe Water and Sanitation) and SDG 7 (Affordable and Clean Energy).
Performance on SDG 1 (No Poverty) and SDG 8 (Decent Work and Economic Growth) remains below pre-pandemic levels in many low-income countries and LMICs. This is a major setback, especially considering that before the pandemic, over the period of 2015–2019, the world was progressing on the SDGs at a rate of 0.5 points per year (which was also too slow to reach the 2030 deadline), with poorer countries making greater gains than rich countries. Progress on climate and biodiversity goals is also too slow, especially in rich countries (Sachs et al., Reference Sachs2022).
Global trends of SDG 6 indicators 6.1.1 & 6.2.1 by geographical regions
The JMP provides national estimates only when data are available on drinking water quality and at least one of the other criteria (accessibility and availability). Regional and income group estimates are made when data are available for at least 30% of the population (World Bank, n.d.).
There are some data on drinking water quality from household surveys and government sources. However, in many low-income countries, existing water quality data from regulatory authorities are limited, especially for rural areas and populations using non-piped supplies. As discussed earlier, many piped supplies do not guarantee safe water, and therefore, this also contributes to the lack of data on safe water statistics.
Since 2017, the JMP reports on progress towards SDG target 6.1, which has included estimates on the quality of drinking water supplies. This represents a significant advance in the global monitoring of drinking water services. To complement the regulator data, an increasing number of LMICs are collecting national or sub-national representative data on drinking water quality through multi-topic household surveys. When Level 1 (safely managed) data are lacking, the next available data at Level 2 (Basic services) are reported. There is also a combined level called ‘Population using At Least Basic services’, and for water, this indicator encompasses both people using basic drinking water services as well as those using safely managed drinking water services.
National data from each country, area or territory are recorded in the JMP country files, with water, sanitation and hygiene data recorded on separate sheets. Country files can be downloaded from the JMP website: https://washdata.org/data/downloads. However, these links to country data only provide a summary of collected averages, and not detailed water quality data on specific locations.
Similarly, data availability for SDG 6.2 indicators also improved over the period of 2015 to 2020, with a 43% increase (84 to 120 countries) in the number of countries reporting on indicator 6.2.1a (safely managed sanitation services) and a 13% increase (70 to 79 countries) for indicator 6.2.1b (basic hygiene services). The increase in data coverage for indicator 6.2.1 has been largely driven by LMICs where on-site sanitation is widespread, and household surveys updated to collect data on pit-emptying practices.
In spite of these improvements, it is important to note that data availability varies significantly across the SDG 6.2 indicators, between regions, and between rural and urban areas for all SDG areas, with many countries still lacking data for 2020.
Concerning open defecation, the data show that basic sanitation services were available for >95% of the population in all SDG regions, with the exception of Latin America and the Caribbean (93%) in 2020. There was, however, insufficient data to estimate the global population with excreta removed and treated off-site. Additionally, estimates for basic hygiene ranged from 0% in Australia and New Zealand and in Europe and Northern America (no data available) to 92% in Central and Southern Asia and 93% in sub- Saharan Africa.
This article highlights the achievements of SDG 6 with indicators 6.1.1 (water) and 6.2.1 (sanitation). Performance on SDG 6 (Safe Water and Sanitation) for the geographical regions compared to the world average is shown in Figures 4 and 5, respectively.

Figure 4. Proportion of population using SAFE drinking water (2015–2020). Source: (UN-Water SDG 6 Data Portal, n.d.).

Figure 5. Proportion of population using SAFE sanitation (2015–2020). Source: (UN-Water SDG 6 Data Portal, n.d.).
As can be seen from Figure 4, the proportion of the global population using safely managed drinking water services increased from 70% in 2015 to 74% in 2020, with the largest numbers of people gaining access in Central, East and Southern Asian countries, with an average percentage increase of 4%. Despite this progress, another 2 billion people still lacked safely managed drinking water in 2020. The Sub-Saharan African (SSA) region recorded an increase of 27% in 2015 to 30% in 2020. Further analysis of the data available in 2020 from the World Bank (World Bank, 2020a) showed that only 131 out of 217 countries classified by the World Bank had data available for safely managed drinking water coverage.
From the 131 countries, 6 countries (4.6%) had safe drinking water coverage of below 15% in 2020. The six countries were Chad (6%), Central African Republic (6%), Sierra Leone (11%), Rwanda (12%), Ethiopia (13%) and Kiribati (15%). Fourteen countries (10.7%) had safe drinking water coverage between 16–30%, 11 countries (8.4%) between 31–50%, 14 countries (10.7%) between 51–70%, 47 countries (35.9%) between 71–97% and 39 countries (29.8%) between 98–100%. In 2020, 2 billion people were without safely managed drinking water, including 1.2 billion people lacking even a basic level of service. At the current rate of progress, the world will reach 81% safely managed drinking water service coverage by 2030. The current rate of progress would need to increase four-fold, to 2.6 percentage points per year, in order to reach universal coverage by 2030 (United Nations, 2022).
From 2015 to 2020, the world population using safely managed sanitation services increased from 47% to 54%. Out of the 217 World Bank classification of economies, in 2020 data for safely managed sanitation services were available for 126 countries only (World Bank, 2020b). Analysis of the data available from the World Bank for 126 countries showed that 11 countries (8.7%) had safely managed sanitation coverage of below 15% in 2020. These countries were Tuvalu (6%), Ethiopia (7%), Togo (9%), Madagascar (10%), Chad (10%), North Macedonia (12%), Guinea-Bissau (12%), Ghana (13%), Democratic Republic of Congo (13%), Sierra Leone (14%) and Central African Republic (14%). Another 19 countries (15.1%) had safely managed sanitation coverage between 16–30%, 21 countries (16.7%) between 31–50%, 20 countries (15.9%) between 51–70%, 44 countries (34.9%) between 71–97% and 11 countries (8.7%) between 98–100%. Given the current rate of progress, it is possible for the world to reach 67% coverage by 2030. This will leave about 2.8 billion people without access to basic services. At the same time, those practising open defecation will be reduced to about 50% (from 739 million to 494 million). At this level, it is possible for the world to eliminate open defecation.
The proportion of the global population using at least basic drinking water services increased from 88% in 2015 to 90% in 2020 (Figure 6), with 771 million still without even basic drinking water. Half of those lacking basic drinking water services (387 million) live in SSA (United Nations, 2021). The region recorded a marginal increase of 33% in 2015 to 35% in 2020 (basic drinking water services), compared to 64.4% in 2020 (at least basic drinking water services), whilst a minor regression was noted for Central and Southern Asia from 31% in 2015 to 29% in 2020 (basic drinking water services). There was no data available for Central and Southern Asia to compare with at least basic drinking water services. The Middle East & North Africa (MENA) and Latin American regions recorded no significant increase over the 5-year period. At the current rate of progress, the world will reach 94% basic drinking water service coverage by 2030. Eight out of 10 people who lack even basic drinking water services live in rural areas, and about half of them live in LMICs. Out of the 217 World Bank classification of economies, in 2020 data for at least basic drinking water coverage were available for 216 countries (World Bank, 2020c). Analysis of the data available from the World Bank for 216 countries showed that no countries (0%) had at least basic drinking water coverage of below 30% in 2020. Eight countries (3.7%) with at least basic drinking water coverage had between 31–50%. Except Papua New Guinea (45%), all other seven countries were in Sub-Saharan Africa. An additional 24 countries (11.1%) had at least basic drinking water services coverage between 51–70%, 85 countries (39.4%) between 71–97% and 99 countries (45.8%) between 98–100%.

Figure 6. Proportion of population using at least BASIC drinking water (2017–2020). Source: (Sachs et al., Reference Sachs2021; Reference Sachs2022).
World population using at least basic sanitation increased from 73% in 2015 to 78% in 2020 (Figure 7). The gap between low-income countries (30.8%) and high-income countries (99.5%) was quite significant in 2020. The World Bank data for basic sanitation coverage was available for 215 out of 217 countries (World Bank, 2020d). Analysis of the available data showed that 7 countries out of 215 (3.3%) had at least basic sanitation coverage of below 15% in 2020. Another 13 countries (6.0%) had coverage between 16–30%, 23 countries (10.7%) between 31–50%, 17 countries (7.9%) between 51–70%, 76 countries (35.3%) between 71–97% and 79 countries (36.7%) between 98–100%. The SSA region recorded a marginal 1% increase from 2015 to 2020. Similarly, Central and South Asia had improvements in basic sanitation access, increasing from 21% to 25% over the same period. East and South-East Asia, on the other hand, experienced an average regression of 4% points on basic sanitation.

Figure 7. Proportion of population using at least BASIC sanitation (2017–2020). Source: (Sachs et al., Reference Sachs2021; Reference Sachs2022).
Proper hygiene is essential in containing infectious diseases including COVID-19, but there is still a significant percentage of the global population that does not practise it. As evident, 1 in 4 people lack access to handwashing facilities with soap and water at home. The data indicate that the global population with basic handwashing facilities with soap and water increased to 71% from 61% between 2015 and 2020.
There are significant differences between rural and urban areas, with the rural areas seeing a 1.1 percentage points/year increase. If this trend continues, we are likely to see 78% coverage at the end of the period, and there will be 1.9 billion people still needing basic services. We know and are aware that access to drinking water, sanitation and hygiene is a basic human need and these are critical to global health success. To achieve global goals at the end of the period, current activities would need to increase 4 times. This step is important, as the outcome will support about 829,000 lives annually. According to the United Nations (2022), this is the number of people who currently die each year from diseases directly attributable to unsafe water, inadequate sanitation and poor hygiene practices.
Discussion on SDG 6 Progress by geographic regions
As demonstrated in Figures 4–7 and the above discussion, for both drinking water and sanitation coverage, the global average masks geographic disparities, with some regions performing better and others having values below the global average. Rural water supply and sanitation (WSS) systems often have fundamentally different needs and capacity levels when compared to urban systems. This is true for regions, geography-topography, their infrastructure, costs and customer base.
Eastern Europe, Caucasus and Central Asia (EECCA)
In 2020, the safe drinking water supply coverage and safely managed sanitation coverage in Europe and Central Asia (excluding high-income countries), were 78% and 67%, respectively, with significant variation across the countries in the region (World Bank, 2020a; 2020b). Despite apparently high access rates, as reported by the JMP, one of the most persistent and challenging issues in the region remains low access to reliable supply of drinking water quality and to proper sanitation in rural areas. Planning, financing and implementation of water supply and sanitation systems in rural areas are all noted to be more challenging compared to urban areas, where populations are smaller, have lower purchasing power and are more dispersed. Coverage estimates often indicate that piped water supply to households is in place, but evidence suggests that they do not always meet people’s needs. A continuous supply of safe drinking water at an affordable cost is not available, and as a result, rural households, oftentimes, have to rely on open canals, shallow wells or mountain streams, even when water systems are in place. Challenges related to high costs and low affordability, and lack of public investment are also applicable to sanitation (OECD, 2022b).
With regard to Tajikistan, the World Bank reports that while 98% of households in Dushanbe have access to improved water on-premises, only 61% report that water from this source is available when needed (World Bank, 2019; OECD, 2022b).
Despite Moldova’s seemingly good access rates to water (98.5% in urban and 85% in rural settlements), the World Bank estimates that almost one million Moldovans (close to 40% of the population) rely on polluted shallow wells for their drinking water. Furthermore, 80% of the wells are not compliant with drinking water norms, because they contain nitrates and have microbiological contamination (Smets et al., Reference Smets2020) as cited in (OECD, 2022b).
There are inconsistencies with Uzbekistan JMP data, which show a national access level of 25.7% for sanitation, with urban and rural averages of 99.8% and 99.7%, respectively. This pattern (where the national access level does not add up in context of the reported urban/rural breakdowns) is present across multiple survey years (OECD, 2022b).
Another issue with access data is that it is not updated regularly (for which reason SDG 6 is classified as a Tier 2 indicator). A decade may pass between reporting. In Ukraine, the population using at least basic drinking water services in 2017 was reported as 93.8% and the population using at least basic sanitation services was 96.2% (Sachs et al., Reference Sachs2021), and both these services in 2022 were reported as 93.9% and 97.7%, respectively (Sachs et al., Reference Sachs2022). Considering the serious damage and destruction to water supply and sanitation infrastructure that occurred during 2022 as described earlier, it is questionable whether these numbers were much higher in 2021 and reduced to 2022 reported levels as a result of the Russia–Ukraine war.
In Kazakhstan, the population using at least basic drinking water services in 2020 was reported as 95% and the population using at least basic sanitation services was 98% (World Bank, 2020c; 2020d; Sachs et al., Reference Sachs2022).
In the EECCA, some countries have provided detailed reporting on their SDG progress, either through the Voluntary National Reporting or through other documents (e.g., Georgia’s 2019 ‘Brief Report on the Progress Under the Protocol on Water and Health’). Belarus, Georgia, Kyrgyz Republic and Moldova are among the most active in incorporating a focus on SDG indicators and/or rural WSS into strategic planning.
In Georgia, the population using at least basic drinking water services in 2020 was reported as 97% and the population using at least basic sanitation services was 94%. In Armenia, the population using at least basic drinking water services in 2020 was reported as 100% and the population using at least basic sanitation services was 86% (World Bank, 2020c; 2020d) as cited by (Sachs et al., Reference Sachs2022).
The Voluntary National Review (VNR) of the Kyrgyz Republic Report provides particularly detailed information on SDG 6 progress in Kyrgyzstan (United Nations, 2020). The VNR claims that the Kyrgyz Republic uses just 20 to 25% of its water reserves and that of the total amount of water withdrawn, 95% is used for irrigation and agricultural needs, 1.5% is used by industry and the remaining 3% is utilised by other customers, including for the delivery of drinking water.
In the Kyrgyz Republic, the population using at least basic drinking water services in 2017 was reported as 87.5% and the population using at least basic sanitation services was 96.5% (Sachs et al., Reference Sachs2021), and both these services in 2020 were reported as 91.7% and 97.9%, respectively (Sachs et al., Reference Sachs2022). However, only 66.8% of rural households had drinking water supply located within the household. Nearly 33.2% of residents spend up to 30 min or more per day on water collection. Moreover, in 56% of cases, women over 15 are the primary suppliers of water for their households. There is a significant disparity in access to adequate sanitary conditions between urban and rural populations, as coverage was 67.7% in cities and only 13.4% in rural areas in 2018 (OECD, 2022b). People using safely managed sanitation services, including handwashing devices with soap and water, made up 96.3% of the population in 2018 and increased to 97.9% in 2020 (Sachs et al., Reference Sachs2022).
East & South Asian Countries
In this article, the East and South Asia region comprises 21 countries including China and Singapore, pushing the regional scores upward. Afghanistan is included in Eastern Europe and the Central Asian region. Established in 1985, there is also the South Asian Association for Regional Cooperation (SAARC), with eight member countries – Afghanistan, Bangladesh, Bhutan, India, Maldives, Nepal, Pakistan and Sri Lanka, and nine observers – Japan, China, United States, European Union, Republic of Korea, Iran, Mauritius, Australia and Myanmar. Overall, East and South Asia has progressed on the SDGs more than any other region since their adoption in 2015 (Sachs et al., Reference Sachs2022). Among the regions, data show that in 2021 South Asia, with an annual average SGD Index score of 63.58, is on the way to have the best possible outcome across the 17 SGDs. It is interesting to note that this score is 3% higher than the region’s baseline score in 2015, the year of the start of SDGs. The region is performing better and has started economic recovery programs in spite of the COVID-19 challenges. This is also true for the SAARC bloc as you can see in Figure 8 below.

Figure 8. SDG Index Score Achievement for South Asia (2015–2021). Sources: (Sachs et al., Reference Sachs2021; Cheema, Reference Cheema2022; Sachs et al., Reference Sachs2022).
Within the South Asian region and in the SAARC bloc, for seven consecutive years from 2015 to 2021, the top three SDG performers were Bhutan (70.02), Maldives (69.27) and Sri Lanka (68.1), with the numbers in brackets indicating 2021 achievements. From the bottom, Afghanistan (53.56), Pakistan (57.62) and India (60.07) remain the lowest performers in 2021, as they have been since 2015. Nepal (66.56) and Bangladesh (63.45) are middle performers in the region for the period 2015–2021 (Cheema, Reference Cheema2022). The trend is similar with the SAARC countries as shown in Figure 8.
The analysis indicates that countries in the study region made progress in achieving the SDG 6 targets. Overall, access to improved water increased from the base of 73% to 93%. Also, open defecation has significant outcomes where the proportion of people undertaking this practice decreased from 65% to 34%, with India, Bangladesh, Nepal, and Pakistan achieving more than a 30% reduction in open defecation.
As this is a major policy agenda, many countries in the region have put in significant measures to push for positive outcomes. For instance, Pakistan and Bangladesh have adopted policies, developed plans to achieve the targets and included implementation costs in the national budgets. Evidently, most of the population (85%) use improved sanitation, with a slight majority in the urban areas, and the trend is similar for the population using a handwashing facility with soap and water. In spite of these, these countries still struggle with health education and hygiene programmes and need more programmes to strengthen this area.
Bhutan is one of the countries with significant progress, where most of the population (99.5%) have access to an improved water source and the majority of the households have 24-h access to drinking water. This is possible because of the current sanitation policies with a key focus on access and quality. However, the country is still dealing with issues such as climate change and improved sanitation infrastructure and population growth. These issues are prevalent in the urban areas. India is improving and on course to achieve target 6, and this is evident in the sanitation sector. Between 2015–2016 and 2019–2020, the country observed an increase from 50% to 100% for rural households’ access to toilet facilities.
Sri Lanka, Nepal and Maldives are on track as well. Maldives’ success in particular is attributed to its government’s commitment in achieving improved sanitation by the end of 2023. This is supported by the formulation of the Maldives’ National Water and Sewerage Plan under the current Water and Sewerage Act – the main goal is to guide the sector to achieve the SGDs target 6 for the country. Financial commitment is required to achieve these goals. The country is cooperating with international partners to secure additional financial resources to ensure efficient implementation for the water and sanitation sector by 2025.
Sri Lanka made significant progress and recorded an increase of 96% for the proportion of the population with access to improved drinking water and sanitation. Sri Lanka constructed 18,000 toilets, and over the last two years, about 8,000 more are under construction. About 30 schools had improved sanitation facilities and over 100,000 beneficiaries received hygiene awareness programs. The country decided to work with both local and international, including the World Bank, to ensure sustainability. This is a key strategy towards the success of achieving these targets. (World Bank, 2020e).
Despite these gains, many Asian countries are behind other developing countries, in terms of key indicators for SDG 6 targets. Over 134 million people still do not have access to improved drinking water. It is currently estimated that in South Asia, between 68 to 84% of water sources are contaminated. Additionally, 610 million people in South Asia still practise open defecation (over 60% of the global burden).
Whilst the magnitude of COVID-19’s economic shock varies widely across countries and is yet to be fully understood, it is expected to affect WASH progress rates. and there is an anticipated shift in donor funding from existing WASH commitments and priorities to emergency response, resulting in a significant reduction in the overall funding of (the WASH) sector; and national governments noted to likely divert and deprioritise domestic funding away from the WASH sector due to their inability to pay for or suspension of loans (Global Wash Cluster - GWC, 2020).
Other significant barriers remain, including data availability. This is a major challenge for many developing countries: the lack of proper protocols to collect data, technical capacity to implement system-wide collection and data protection policies. Similar to other regions, unreliable data and weak monitoring systems have resulted in limited planning and investment in WASH and resulted in slower rates of achieving these targets.
Middle East & North Africa (MENA)
The African continent is divided into five sub-regions: North, Eastern, Southern, Western and Central. For data collection and reporting purposes, some international organisations like the World Bank categorise the Northern African countries with the Middle East and treat the rest of the sub-regions under one category – SSA. Except for Sudan, most of the Northern African countries are at an advanced stage of universal access to water and sanitation. In 2017, the proportion of people using at least basic drinking water in the MENA was 94%, 87% and 97%, of the total, rural and urban respective populations. The proportion of people using at least basic sanitation services was 91%, 81% and 94%, of the total, rural and urban respective populations. Similarly, the region reported fairly high levels of basic handwashing of 87% in 2020. There are, however, significant disparities across the region, with higher basic handwashing rates in wealthier and politically stable countries compared to poorer and conflict-ridden countries. Additionally, inequalities were observed between rural and urban areas, with handwashing more prevalent in latter.
Sub-Saharan Africa
Analysis of the data available for 216 countries showed (World Bank, 2020c) that seven out of eight countries globally with the lowest basic drinking water coverage between 31–50% were in Sub-Saharan Africa. These countries were the Central African Republic (37%), South Sudan (41%), Democratic Republic of Congo (46%), Chad (46%), Niger (47%), Burkina Faso (47%) and Ethiopia (50%). Also, the data available for 215 countries showed (World Bank, 2020d) that in 2020, all 7 countries with the lowest basic sanitation coverage of below or equal to 15% were in SSA. These countries were Ethiopia (9%), Chad (12%), Eritrea (12%), Madagascar (12%), the Central African Republic (14%), the Democratic Republic of Congo (15%) and Niger (15%). In 2017, the basic water supply and sanitation coverage in SSA was 61% and 31%, respectively (Figures 6 and 7). Under the business-as-usual rate of progress, by 2030 the water and sanitation coverage will be 73% and 38%, respectively (Sahilu, Reference Sahilu and Rajapakse2022). Countries in SSA need to put an extraordinary effort to achieve the target of at least basic water and sanitation services by the 2030 deadline.
Expanding SSA’s water and sanitation services requires significant resources (material/human/financial). However, securing these resources has remained a critical challenge for the region. There is generally a lack of public, private and consumer investment in water supply and sanitation services, particularly sanitation, at sub-national levels. On average, approximately 25% of government budgets are allocated to WASH investments, with an even smaller percentage for sanitation, despite government commitments to regional and international ‘call for actions’, such as the Ngor Commitment. Systematic underfunding of sanitation has contributed to low access rates of safely managed sanitation. Institutional fragmentation, lack of policy coherence and weaknesses in coordination between local governments/regional secretariats continue to hamper timely and efficient disbursement of funds.
The lack of transparent monitoring of data and weak capacity of staff – both at the national and the local government levels – has been one of the main drivers that has significantly hampered advocacy for the optimal use of public financing, and development partners and NGOs from making relevant and sustainable contributions to the subsector. Monitoring and evaluation systems exist but are still in an early stage of development. Most countries in this region have National Sanitation Information Management Systems that monitor progress towards SDG 6.2, and oftentimes indicate significant gains in access. These results, however, remain unverified due to concerns about data quality. Monitoring and reporting are typically based on data collected through paper-based surveys with no clear methods for data verification. Unreliable data and weak monitoring systems have resulted in limited planning and investment in WASH, resulting in slower rates of progress toward achieving the SDG 6 target.
Through the support of international partners like the World Bank, the WASH sector in SSA countries has undergone several reforms. Many countries have autonomous/independent institutions dealing with the policy and regulatory functions of the WASH sector. There are a number of countries with independent Ministries (policymaking), regulatory authorities and service providers (public and private) of the WASH sector. Lack of capacity, finances and weakness in the enforcement of laws and regulations can be the challenges of such institutions in SSA countries. Many SSA countries will need to strengthen WASH sector governance and the enabling environment through participatory dialogue with government counterparts, coupled with a focus on coordination and cooperation between sectors, and build capacity in planning, implementation and monitoring, at all administrative levels to strengthen WASH systems to accelerate progress rates.
Latin America & the Caribbean
In 2020, 75% of the population used safely managed drinking water and 34% used safely managed sanitation services in the region. The safely managed drinking water coverage remained unchanged at 75.0% from 2015 to 2020 (Figure 4) and safely managed sanitation coverage improved from 28.0% in 2015 to 34.0% in 2020 (Figure 5). Basic drinking water coverage improved from 95.9% in 2017 to 96.5% in 2020 (Figure 6), while basic sanitation coverage improved from 85.0% (2017) to 86.5% (2020). Achieving the 2030 SDG 6 targets will require a 14 times increase in current rates of progress on safely managed drinking water and a 7 times increase for safely managed sanitation services. Universal access to basic drinking water and basic sanitation services (>99%) is achievable, and the region is on track to eliminate open defecation (<1%). As in most regions, there were insufficient data to produce regional estimates on basic hygiene (WHO / UNICEF, 2022).
Oceania (excluding Aust & NZ)
There are 21 countries and territories in the Oceania region (excluding Australia and New Zealand), and there is no data on safe water and sanitation. Data available for some countries are for basic services and yet many people living in these Pacific Island countries are unable to consistently access services ensuring clean water, hygiene and the adequate treatment and disposal of waste. As shown in Figure 6, the population using at least basic drinking water services for Oceania improved from 52.3% in 2017 to 54.1% in 2020. The population using at least basic sanitation services improved from 28.0% in 2017 to 30.8% in 2020 (Figure 7).
Note: The lack of access to basic level of drinking water quality in a number of remote and indigenous communities in Australia together with some of the rich nations has been discussed elsewhere (Rajapakse et al., Reference Rajapakse, Rainer-Smith, Millar, Grace, Hutton, Hoy, Jeffries-Stokes and Hudson 2019 ; Reference Rajapakse, Hudson, Brown and Rajapakse 2022 ; Wyrwoll et al., Reference Wyrwoll, Manero, Taylor, Rose and Grafton 2022 ).
Key factors impacting the progress of SDG 6 and Agenda 2030
Some of the frequently discussed critical factors impacting the SDG’s progress include climate change (drought), population growth and a high rate of urbanisation. These factors are highly relevant in developing regions like SSA. For example, the recent drought (severe water shortage) in the Horn of Africa has resulted in the loss of millions of livestock and disrupted the livelihood of pastoralists and agro-pastoralists. In addition to the above, some of the more recently debated topics impacted on SDG 6 and Agenda 2030 are discussed below.
Impacts of Covid-19
The COVID-19 pandemic has had far-reaching impacts across high- and low-income countries. The crisis had a particularly negative impact on low-income and vulnerable countries, and they may take longer to recover due to limited access to financing. Although richer countries may manage to support recovery expenditure through debt, low-income countries do not have the same access to international financial systems to finance essential services including water, sanitation and hygiene (WASH). The global response through emergency financial assistance during the pandemic helped maintain the provision of WASH services in some countries. The long-term impacts on progress towards the SDG 6 targets are yet to be understood. On the other hand, self-reported handwashing behaviour was noted to be very high during the pandemic period (Finmark Trust, 2020; Water Aid Nepal and MITRA Samaj, 2020; USAID, 2020). Across water, sanitation and hygiene, it is unclear if pandemic-related changes (whether positive or negative) in household behaviour will be sustained in the long term.
A study across seven LMICs (Democratic Republic of the Congo, Ghana, Kenya, Mozambique, Nepal, Rwanda and Senegal) reported COVID-19-driven water access difficulties across the urban-to-rural spectrum, but there is limited information to confirm the magnitude and disparities across the geographies. In the short term, consumer investments in sanitation is expected to decline resulting in a) slower rate of adoption of improved toilet and b) possible reversion to open defecation in case of unaffordability of pit-emptying services.
Russia–Ukraine war
The Ukraine–Russia conflict triggered a devastating humanitarian crisis in Europe, with the displacement of many millions within the country and over 7 million refugees crossing the borders into neighbouring countries. By October 2022, damages to water/wastewater infrastructure and electricity networks in Ukraine affected access to drinking water for 6 million people, and 16 million people experienced disruption to their water, sanitation and hygiene services, exposing them to an elevated risk of WASH-related diseases such as cholera, diarrhoea, hepatitis and many skin infections (UNOCHA, 2022). In mid-2022, the global economy was projected at 3.1% and global inflation at 6.7%. The economy was down by 0.9% from the 4.0% growth projected in January 2022, and the inflation has more than doubled compared to the 2.9% average inflation during 2010–2020 (UNDESA, 2022).
In spite of the implementation challenges, we have seen significant improvement from 2015 to 2019, where the world progressed on the SDG Index at an average rate of 0.55 points a year. Since the COVID-19 pandemic, followed by the Russia–Ukraine war, for the second year in a row, the world was no longer making progress with the average SDG Index stagnated at 66.0 points as shown in Figure 3. Figure 3 also shows the SDG Index for different geographic regions and income groups with the overall progress on the SDG Index marginally improving in 2022 across all these regions and income groups.
These events had a significant impact on the society, the environment and the global economy with hundreds of thousands of lives lost. These impacts have impeded the prospects of a recovery of the already fragile economy from the pandemic globally and particularly for LMICs creating sharp increases in food, energy and medical supplies, and disruptions to water and sanitation services due to fuel shortages and power cuts (USAID-Tetra Tech, 2021).
Inconsistencies and lack of data on indicators
In 2017, 84 (36%) out of the 231 indicators did not have any internationally established methodology or standards. It is only since 2020, that a major effort by the global statistics community, the Inter-Agency and Expert Group on SDG indicators, considered the methodological development sufficiently advanced for all of the indicators to be tracked.
Although standards are now available, most countries’ statistical systems appear to be struggling to fill data gaps on SDG indicators. Many countries lack data on one or more criteria of safely managed drinking water and sanitation, and sometimes there are ambiguities in the available data. There has often been expressed frustration by water sector participants around the world that water quality and quantity data are gathered by many actors but not openly shared to improve public understanding of the water situation and to support decision-making. (AusAID-QUT-NWSDB, 2014; BOM, 2017). Additionally, differences in the definitions used for safely managed sanitation in national data sources make comparison between countries difficult (WHO / UNICEF, 2021). Some of the issues related to data gaps and inconsistencies are discussed below. For the period 2015–2019, on average, countries had reported one or more data points on only 55% of the SDG indicators. No country reported data on more than 90% of the SDG indicators, while 22 countries reported on less than 25% of the SDG indicators (Kitzmueller et al., Reference Kitzmueller, Stacy and Mahler2021). In 2022, the average UN Member State had reported on 8.3 out of 12 SDG 6 global indicators (sanitation and hygiene are reported separately as 6.2.1a and 6.2.1b making into 12 indicators), and only 50% had reported on nine or more indicators (www.sdg6data.org/en/about/data-gaps). Also, in 2022, an OECD discussion paper highlighted that access data (both SDG 6.1 and 6.2) reported by countries to international organisations did not necessarily reveal the full picture or reflect water and sanitation quality, and is often incomplete (e.g., often do not reveal widespread problems with reliability of supply, quality of tap water or affordability of the service). Moreover, access rates reported to JMP sometimes do not match with access rates reported by countries to development partners or in different publications. Such inconsistencies in reported figures, observed even in countries with generally very good statistics, might be assigned partly to differences in terms and definitions used by JMP and other actors. But in some countries, there might be also incentives to appear better than their neighbours (OECD, 2022a).
Data gaps influence how we assess progress towards the 2030 Agenda – if not carefully understood, they may lead to biased conclusions. For instance, if the SDG reporting framework is incomplete or not up to date, or fails to represent all segments of the population, any inference about the efficiency of policies risks being flawed. The same is true if diagnostic tools cannot provide a comprehensive assessment of the most recent trends, especially in times of uncertainty. While available data make it possible to cover 136 of the 169 targets, some of the data do not properly gauge current outcomes nor performance over time (OECD, 2022a).
To complement regulatory data, an increasing number of LMICs have integrated water quality testing through multi-topic household surveys (WHO / UNICEF, 2020). Although this represents an ambitious new benchmark and a significant step in global monitoring of drinking water services, analysis of the data available from 27 countries showed that many countries lacked national data on the availability and quality of drinking water. The results also showed that E. coli was commonly detected at the PoC (16–90%), and was more likely at the PoU (19–99%), with possible E. coli contamination between PoC and PoU. On average, 84% of households used an improved drinking water source, and 31% met all of the ‘safely managed drinking water’ criteria. E. coli contamination was the primary reason for failing the criteria in 15 out of the 27 countries (Bain et al., Reference Bain, Johnston, Khan, Hancioglu and Slaymaker2021). The study also highlighted that water quality testing in household surveys should complement as they were meant to and not compete with ongoing efforts to strengthen surveillance of water quality by regulatory authorities.
Data reported in JMP is provided to WHO/UNICEF by national statistics offices or other national bodies conducting surveys and collecting data. The purpose of the JMP database is to track progress towards WSS indicators and allow for comparisons across countries, and between rural and urban areas levels of access.
In many countries, the numbers reported to JMP appear to be overly optimistic, given the widespread problems with reliability and quality. The access figures do not necessarily reflect water and sanitation quality and may simply indicate that the infrastructure is in place, not whether it is still functioning, or people are able to draw water, for example, when needed.
Access data (SDG 6.1 and 6.2) is often incomplete or may conceal as much as it reveals. The headline numbers for access do not always reveal the full picture. Access rates reported to JMP sometimes do not match access rates reported by countries to development partners or in different publications.
Some technological recommendations to boost SDG 6 progress
Incorporate data on water quality as a key parameter for tracking SDG 6.1 progress
It is important to note that although by definition ‘safely managed drinking water’ is supposed to be free of microbial and chemical contamination, there is no water quality data available for reporting on safely managed systems, and therefore, the recommendation should also extend to data on safely managed drinking water services for progress reporting. The integration of supplementary data on water quality testing into household surveys during 2014–2020 from 27 countries showed that many countries lacked national data on the quality of drinking water, and there was a large proportion of the population that was exposed to very high levels of E. coli contamination (Bain et al., Reference Bain, Johnston, Khan, Hancioglu and Slaymaker2021).
A recent study to assess the water quality parameters of basic water services in Amhara and Afar regions of Ethiopia was conducted by (Gemeda et al., Reference Gemeda, Springer, Gari, Birhan and Bedane2021). Their study was based on thermotolerant (or faecal) coliform (TTC), and in their sample of 111 water services, the maximum TTC counts were 71 CFU/100 ml and the mean was 4 CFU/100 ml. TTC was detected in 44 (39.64%) (n = 111) basic water services. They recommended incorporating water quality as a key parameter to better track international progress towards ‘clean water and sanitation (SDG 6)’.
A recent microbial water quality study in India (Rayasam et al., Reference Rayasam, Rao and Ray2020) concluded that even when water quality monitoring and testing infrastructure are in place, low institutional capacity and the pressure to not ‘fail’ the expected water quality standards can result in the failure to accurately report bacterial water quality. Their study, based on the Compartment Bag Test (CBT) protocol, found 30% of the tested 150 samples had bacterial contamination, whereas the same samples were tested by the local municipality and reported having no contamination based on their bacterial testing. They elaborate that low- and middle-income country utilities are often under pressure to meet state and national drinking water quality targets, even when they are under-resourced to meet these targets. Also, they suggested that ‘ranking’ countries on the basis of the current SDG 6 indicators may impose indirect pressure on indicator-specific custodian agencies to inaccurately report water quality monitoring results. In response, they proposed that the progress along the service ladder, as measured by the JMP, should be incorporated into the indicators of SDG 6.1.
Scaling-up implementation of WHO water and sanitation safety planning to ensure ‘safely managed drinking water and sanitation’
Water quality testing is an important component of water supply system management; however, microbial water quality compliance is the absence of end-point E. coli in the test results, which is not just enough to ensure water safety. The end-point bacteriological water quality testing is a reactive approach where the problem has already occurred, and it could be ‘too little too late’ if consumers have already consumed the contaminated water. Also, it may not be clear from the outset what went wrong – where and when – and the water supplier may not know to rectify the problem immediately without detailed investigations that would take more time. Furthermore, E. coli is used as a marker for the presence of faecal contamination and the possible presence of microbial pathogens. However, E. coli is not a suitable indicator to verify the absence of pathogens such as Cryptosporidium or Giardia. Cryptosporidium oocysts may survive chlorine disinfection and may be present in the absence of E. coli (NHMRC, NRMMC, 2011) as cited by (Hasan, Reference Hasan2019). While endemic in the vast majority of developing countries, cryptosporidium also has the potential to cause waterborne epidemics and large-scale outbreaks in both developing and developed nations (Efstratiou et al., Reference Efstratiou, Ongerth and Karanis2017). In developing countries, there is virtually no organised system to identify, let alone analyse, such events. As a result, information regarding waterborne parasitic protozoan outbreaks due to pathogens such as cryptosporidium is insufficient in developing countries.
The Water Safety Planning (WSP) tool is a proactive management system to ensure safe drinking water by introducing barriers and management systems in place to stop contamination before it happens. With such a risk management approach, water providers do not need to entirely rely on end-point E. coli testing to confirm water safety. In 2004, the World Health Organisation (WHO) recommended that water suppliers develop and implement WSP as the most effective way to protect drinking water quality from contamination and safeguard public health. The WSP process monitors the entire water supply system from catchment to consumer. Therefore, it ensures the provision of safe and clean drinking water through a variety of interventions at the level of households, community, water supplier and regulator, often with excellent outcomes. A step-by-step approach on how to develop and implement a WSP has been published by Bartram et al. (Reference Bartram, Corrales, Davidson, Deere, Drury, Gordon, Howard, Rinehold and Stevens2009).
Water safety plans (WSPs) represent an important opportunity to contribute to the realisation of the SDGs and to the human right to water, provided that equity is duly considered. Described in the WHO Guidelines for drinking water quality as the most effective way to ensure the safety of drinking water supplies. WSP implementation has increased markedly over the last decade representing every region of the world covering low- and high-income countries (Payden, Reference Payden2017; Setty et al., Reference Setty, Kayser, Bowling, Enault, Loret, Serra, Alonso, Pla Mateu and Bartram2017; Baum and Bartram, Reference Baum and Bartram2018; Kanyesigye et al., Reference Kanyesigye, Marks, Nakanjako, Kansiime and Ferrero2019; Li et al., Reference Li, Smith, Cohen, Wang, Li, Zhang, Zhong and Zhang2020).
Simply having a WSP or a risk management plan will not suffice to ensure water safety. Effective implementation of WSPs is critical in achieving the desired benefits of reliable provision of safe drinking water (Hasan, Reference Hasan2019). A scoring system of 0–100% has been proposed as an indicator of the degree of WSP implementation rather than simply reporting the number of WSPs implemented in any country or by the entity responsible for drinking water supply to the population.
WSPs have been implemented in at least 93 countries representing every region of the world, with 69 countries reporting to have policy instruments either in place or under development that promote or require WSPs or an equivalent (WHO & IWA, 2017; WHO, 2019). It is expected that this will contribute significantly to improvements in water quality reporting and progress on the SDG indicator 6.1.1, ‘safely managed drinking water for all by 2030’ (Herschan et al., Reference Herschan2020).
WHO has similarly developed tools for Sanitation Safety Plans (SSPs) to assist key sanitation stakeholders ensure all sanitation systems are managed to meet health objectives. The implementation goal of SSPs is to (i) ensure systematic identification and management of health risks along the sanitation chain; (ii) guide investment based on actual risks, to promote health benefits and minimise adverse health impacts; (iii) provide assurance to authorities and the public on the safety of sanitation-related products and services (WHO, 2016; 2022).
SSP is still a rather new approach, and unlike the WSPs, its implementation is less advanced, particularly in LMICs. WHO has completed pilots in Haiti, India, Peru, Philippines, Portugal, Uganda and Vietnam. The Kampala Capital City Authority and the National Water Sewerage Corporation–mandated entities to provide water and sanitation services in Kampala, Uganda, are already working towards expanding SSP from the pilot and implementing it on a city-wide level. Similarly, many cities in India, as part of its Swachh Bharat Mission, have started developing city sanitation plans and made SSPs central to this initiative, with plans to integrate SSP in future programming (Winkler et al., Reference Winkler, Jackson, Sutherland, Payden, Lim, Srikantaiah, Fuhrimann and Medlicott2017). The SSP approach can make an important contribution to improvements in safely managed sanitation, but this is yet to be proven.
Conclusions
Although too slow, and unequal across countries and SDGs, progress was made globally on SDG 6 between 2015 and 2020. In 2020, 2 billion people (26%) lacked safely managed drinking water, and 3.6 billion (46%) lacked safely managed sanitation services.
From 2015 to 2020, the global population using safely managed drinking water services increased from 70% to 74%, with the largest numbers of people gaining access in Central, East and Southern Asian countries. Despite this progress, another 2 billion people still lacked safely managed drinking water in 2020, including 771 million who were without even basic drinking water. Half of those lacking basic drinking water services (387 million) live in Sub-Saharan Africa.
The world population using safely managed sanitation services increased from 47% to 54% from 2015 to 2020. However, 3.6 billion people still lacked safely managed sanitation in 2020, including 1.7 billion who were without even basic sanitation. Of these people, 494 million practised open defecation, down from 739 million in 2015. While the world is on track to eliminate open defecation by 2030, achieving universal access to safely managed sanitation by 2030 will require a quadrupling of current rates of progress.
The proportion of the global population with basic hygiene rose from 67% to 70% from 2015 to 2020. This means that, at the start of the COVID-19 pandemic, 2.3 billion people worldwide (29%) still lacked a basic handwashing facility with soap and water at home, and 670 million had no handwashing.
Although ‘safely managed drinking water’ is supposed to be free of microbial and chemical contamination, such water quality data are lacking when reporting on safely managed systems, and therefore, it is recommended that these data be incorporated for progress reporting on population using safely managed drinking water services.
The WHO WSPs and sanitation safety plans (SSP) approaches have been proven to work effectively with incremental improvements to safely managed water, sanitation and health services. The scaling up of the implementation of WSP and SSP from current levels would present a great opportunity to achieve the goal of safely managed water and sanitation for all and the realisation of the SDGs.
In many LMICs, it is challenging to obtain accurate data on key SDG indicators. As reported by many of these countries, they have common problems with data collection, which are mainly due to a lack of technical capacity, lack of resources and data protection. Gathering accurate data requires more resources and competencies, and it is important for countries to coordinate with local and international stakeholders to develop standards for collecting data on SDGs. This strategy will help with efficient implementation and monitoring as well. An immediate task will be for stakeholders to start setting aside a baseline for national targets and indicators. This can be done with the help of professional technical assistance and funding from the international community. Awareness creation on the indicators at different levels of government is necessary, as this will help the governments to gain the trust of the stakeholders. Finally, this will ensure efficient uptake of policies by the local people.
The COVID-19 pandemic and geopolitical rivalries, combined with corruption, particularly in low-middle-income countries, have impeded the prospects of a recovery of the already fragile economies and created sharp increases in food, energy and medical supplies, and disruptions to water and sanitation services due to fuel shortages and power cuts. Diplomacy, peace and global cooperation will continue to be important preconditions in supporting the achievement of SDG 6 globally. In addition, working within a framework of sound ethical foundation combined with transparency and holistic financial accountability within government institutions is a fundamental condition for making real progress on sustainable development locally.
Open peer review
To view the open peer review materials for this article, please visit http://doi.org/10.1017/wat.2023.5.
Author contribution
J.R., M.O., G.D. – all contributed to writing, analysis, review and editing.


 Open access
Comments
03 March 2023
The Editor-in-Chief,
Cambridge Prism – Water
Dear Sir.
Please find attached manuscript titled “Progress in delivering SDG 6: safe water and sanitation” by Rajapakse et al., for your consideration and publication as an Overview Review Paper in the ‘Cambridge Prism - Water’.
The manuscript highlights the following:
• Recommendations on safe drinking water, sanitation and hygiene
• Global trends of SDG Index and SDG 6 Indicators by Geographical Regions
• Impacts of Covid-19 followed by Russia- Ukraine war on the SDG 6 progress
• Inconsistencies of reported data and lack of data on indicators
• WHO Water and Sanitation Safety Planning to ensure ‘Safely Managed Drinking Water and Sanitation’
o Importance of data on drinking water quality as a key parameter for tracking SDG 6.1 progress
• Conclusion
We believe our manuscript would appeal to the readership of the Cambridge Prism - Water. This manuscript has not been published elsewhere and not under consideration by another journal. All authors have approved the manuscript and agree with its submission and we have no conflicts of interest to disclose. Please do not hesitate to contact me if you need further information at: Jay.rajapakse@qut.edu.au
We look forward to hearing from you at your earliest convenience.
Thank you.
Yours truly,
Jay Rajapakse