


Introduction
Executive pay has been and continues to be a contentious topic in the corporate world and in the public sphere. This debate is accompanied by a question about the nature of the processes driving compensation: is the compensation a reward for talent and performance or is it extraction of rent?
On the one hand, numerous scholars argue that levels of executive pay simply reflect the operation of an efficient market where executive talent and effort are duly compensated. This view is based on the underpinning assumption that the level of compensation provides a way of aligning the manager’s incentives with the interests of the principal—i.e., the shareholders [Jensen and Meckling Reference Jensen and Meckling1979]. In turn, firms need to compensate outstanding human capital, which is now more transposable [Murphy and Zábojník Reference Murphy and Zábojník2004]. Moreover, the small differences in marginal productivity and the skewed distribution of firms’ size amplify the pay dispersion even further [Gabaix and Landier Reference Gabaix and Landier2008].
A competing body of research argues that executive pay reflects directors’ successful attempts to extract unjustified compensation. CEOs are often paid simply for good luck [Bertrand and Mullainathan Reference Bertrand and Mullainathan2001]. Executives demanding comparable pay levels to those of their peers produce a leapfrogging phenomenon [DiPrete, Eirich and Pittinsky Reference DiPrete, Eirich and Pittinsky2010; De Vaan, Elbers and DiPrete Reference De Vaan, Elbers and DiPrete2019]. Executives’ rent extraction is all the more likely given that directors tend to poorly represent shareholder interests because their appointment, renewal, etc. relies in part on the CEOs whom they are supposed to monitor [Bebchuk and Fried Reference Bebchuk and Fried2004].
Regulatory definitions state that the external director’s role is purely one of monitoring and controlling firms’ executives. However, such a unidirectional relation is difficult to maintain, as it is at odds with the social exchange that comes with ongoing interactions. Indeed, one of the most constant phenomena produced by social exchange is reciprocity [Mauss [1923-1924] Reference Molm, Takahashi and Peterson2000; Lévi-Strauss Reference Lévi-Strauss1969; Cropanzano and Mitchell Reference Cropanzano and Mitchell2005; Molm Reference Molm2010]. Lévi-Strauss’s [Reference Lévi-Strauss1969] structural theory of kinship shows that the elementary rules organizing the exchange of women between masculine lineages along principles of reciprocity are critically important for enforcing a ban on incest and for strengthening group solidarity. Such reciprocity is also at the heart of social embeddedness in economic life [Granovetter Reference Granovetter1985; Uzzi Reference Uzzi1996, Reference Uzzi1997]. In addition, reciprocity encourages trust [Molm Reference Molm2010] and increases tie stability and resilience [Burt Reference Burt2005]. Ties between independent directors and executives are also likely to produce various forms of reciprocity [Westphal et al. Reference Westphal, Park, McDonald and Mathew2012]. In turn, the establishment of reciprocity norms may lead to a less effective monitoring and higher CEO pay.
Analyzing CEO pay as affected by relational reciprocity is related to existing literature on board interlocks. However, despite forty years of research, we still do not completely understand the implications and impacts of these interlocks. For example, assessing the two first decades of research in this area, Mizruchi [Reference Mizruchi1996] confesses that if interlocks matter, it might be more through their impact on the diffusion of management style—as shown by the diffusion of the poison pill [Davis Reference Davis1991]—than through their impact on performance.
One possible reason why interlocks, commonly approached with network-wide measures such as density or centrality, are not a best fit for studying businesses’ class power and cohesion [Mizruchi Reference Mizruchi2013] or firms’ power within the economic field [Chu and Davis Reference Chu and Davis2016], may relate to the fact that the overarching logic governing board appointments obeys neither class nor firms’ long-term interests. Recent research has been more successful in highlighting the impact of interlocks by paying greater attention to structures that reflect local solidarity between directors rather than firms’ global strategies, thus enabling managerial entrenchment and a reduction in shareholder pressure [Benton Reference Benton2016]. This is achieved through a board composition where executive directors align themselves with their directors’ practices. For example, interlocked executives reject shareholders’ proposals [Benton Reference Benton2017]; use provisions against shareholders’ interests [Benton Reference Benton2016]; match their compensation packages upwards [Kim, Kogut and Yang Reference Kim, Kogut and Yang2015]; conform in funding the same political party [Burris Reference Burris2005]; and engage in opportunity hoarding [Tilly Reference Tilly1998] in favor of executives with similar educational backgrounds [Kramarz and Thesmar Reference Kramarz and Thesmar2013]. Benton [Reference Benton2016] also further shows that the cohesion of the local interlock network fuels managerial entrenchment and suggests that the “norms of reciprocity” in cohesive settings are at the heart of this process.
However, these studies, which use board co-membership as the core constitutive tie in the network of directors, cannot distinguish potential instances of reciprocity, from other network-expressed phenomena, such as informational privilege, influence, imitation, conformity or conflict avoidance. For instance, the prior research which finds a link between a firm’s interlock centrality and its executive pay could be interpreted as either the fair remuneration of an informational advantage or as a sign of lax board monitoring (Horton, Millo and Serafeim Reference Horton, Millo and Serafeim2012; Renneboog and Zhao Reference Renneboog and Zhao2011]. To address these problems, we suggest a two-fold contribution. First, instead of using whole-network measures whose interpretation is ambiguous we use dyadic measures that better capture more exact manifestations of reciprocity. Second, within these dyadic ties we focus on measures that, we believe, are better suited to capturing reciprocal exchange. Following this approach and in contrast with previous literature, we will concentrate on ties between non-executive and executive and leave ties between non-executive directors out of the analysis. This distinction between the two types of ties is based on the assertion that tied non-executive directors do not typically depend on one another; they tend not to engage in complex exchanges to the extent that tied external and executive directors do, as the latter tie embeds appointment, control, payment, mutual respect, honor, and favors [Bebchuk and Fried Reference Bebchuk and Fried2004].
Therefore, we define as a control tie the tie between a non-executive board member and an executive director as the core tie of our network. Control ties relate to the fact that the role of non-executive board members is officially to control and monitor the action of executive directors. This definition of network ties contributes to the prevailing conceptual frameworks in the literature in two important ways. Firstly, the definition enables us to reconcile the corporate governance view, which focuses on control, with the interlocking view, which focuses on network structure. Secondly, it permits us to identify more precisely the reciprocity mechanisms—where reciprocity can be measured both in the selection of partners (I select you; you select me) and in the outcome of the exchange (I favor you; you favor me).
Based on these insights, we study the impact of inter-board reciprocity on executive pay among 3,995 US firms between 1990 and 2015. Following structural anthropology and social exchange theory, we isolate three basic reciprocity structures: restricted exchange, when two executives sit on each other’s respective boards; delayed exchange, when y sits on the board of x after the end of x’s mandate on the board of y; and generalized exchange, when x sits on the board of y, who sits on the board of z, who sits on the board of x. These three types of ties, although not very common, are more frequent than those calculated by chance. Our findings indicate that, after initiating any one of these three forms of reciprocal ties, there is an increase in executive directors’ pay, notably with respect to bonuses. These results extend considerably previous studies [Hallock Reference Hallock1997; Fich and White Reference Fich and White2003; Bebchuk and Fried Reference Bebchuk and Fried2004] which targeted only restricted exchange and did not control for time-invariant unobserved heterogeneity. Moreover, we develop and test additional dimensions of exchange (i.e. delayed exchange and generalized exchange), which are new to the research.
Our research design also contributes to the literature by using the regulatory shock of the Sarbanes-Oxley Act (2002) as a natural experiment. Once some of these exchanges are constrained, their impact on pay disappears. Our findings contribute to our understanding of corporate remuneration and its potential regulation. By combining elements from social exchange literature with settings from compensation research, we show that universal forms of social reciprocity underline managerial behavior. Following this contribution, we also add a strong empirical evidence to the rent extraction literature.
The paper is organized as follows. In the second section, we detail our theoretical approach in relation to the previous literature. In the third section, we describe the data and the modeling equations used. In the fourth section, we present our main results and, in the last section, we provide a general discussion of our findings.
Theory: From Elementary Social Exchange to Executive Solidarity
Corporate remuneration: Research state of the art
Corporate governance rules state that the main duties of a board of directors are to monitor and govern the firm, to set optimal compensation contracts, and to protect the interests of shareholders [Devers, McNamara, Wiseman and Arrfelt Reference Devers, Mcnamara, Wiseman and Arrfelt2008]. Given this, academic research on corporate governance aiming to explain executive pay provides two main viewpoints. First, the market view (efficient contracting) argues that executives are paid for the services they provide to the firm [Murphy and Zábojník Reference Murphy and Zábojník2004; Gabaix and Landier Reference Gabaix and Landier2008], while the skimming view (rent extraction) contends that executives transfer wealth from the shareholders by exploiting the managerial power that their corporate and inter-board positions provide [Bebchuk and Fried Reference Bebchuk and Fried2003; Bertrand and Mullainathan Reference Bertrand and Mullainathan2001].
Both views regard board independence as central to assessing and determining the efficacy of boards and the level of pay CEOs deserve. The fundamental assumption is that the more independent the boards are, the more likely they are to be effective monitors and thus set optimal compensation contracts. Conversely, non-independent boards might behave out of deference to the executives they are supposed to monitor, and therefore provide them with greater opportunities to rent extract. Empirical evidence supports this latter view. For example, Core, Holthausen and Larcker [Reference Core, Holthausen and Larcker1999] find that when the board of directors is less independent (i.e., when there is a larger board with a lower percentage of outside directors, the CEO is also the chairman, and the outside directors were appointed by the CEO), CEOs are paid significantly more. Similarly, recent regulation in 2002-2003 requiring, inter alia, that the compensation committee consists only of independent directors, has been found to reduce CEO pay [Chhaochharia and Grinstein Reference Chhaochharia and Grinstein2009].
One stream of research investigates the implications of a director’s social network on their ability to monitor and govern effectively. To date, this research has provided inconclusive evidence as to whether the association between network structure and compensation benefits shareholders. Several papers provide evidence to suggest that director networks enable the executives to rent extract. As Bebchuk and Fried [Reference Bebchuk and Fried2003] and Benton [Reference Benton2016] argue, managers use their connections to increase CEO entrenchment and board dependence, which allows them to extract economic rents. Under these conditions, CEO compensation packages do not have the effect of serving the strategic goals of the firm nor of enhancing shareholder value [Barnea and Guedj Reference Barnea and Guedj2006; Kirchmaier and Stathopoulos Reference Kirchmaier and Stathopoulos2008; Brown et al. Reference Brown, Gao, Lee, Stathopoulos, Boubaker and Nguyen2012; Fich and White Reference Fich and White2005; Li and Roberts Reference Li and Roberts2017]. For instance, Hallock [Reference Hallock1997, Reference Hallock, Carpenter and Yermack1999] finds that reciprocal interlocks are associated with higher CEO cash compensation (although not total compensation) and with worse firm performance. Similarly, Fich and White [Reference Fich and White2003] find that the number of reciprocal interlocks is positively associated with CEO compensation but find no association between these interlocks and various measures of firm performance [see also Fich Reference Fich2000; Fich and White Reference Fich and White2005]. However, Devos, Prevost and Puthenpurackal [Reference Devos, Prevost and Puthenpurackal2009] find that the presence of interlocked directors is associated with lower firm performance and lower pay-for-performance sensitivity. Moreover, several papers find evidence supporting efficient contracting as well as finding that CEOs are paid for the valuable information and resources their network connections provide [Horton, Millo and Serafeim Reference Horton, Millo and Serafeim2012; Engelberg, Gao and Parsons Reference Engelberg, Gao and Parsons2013; Larcker, So and Lang Reference Larcker, So and Wang2013]. Finally, Renneboog and Zhao [Reference Renneboog and Zhao2011] find mixed results providing support for both views.
Similarly, research focusing on the CEOs’ connections indicates that these ties can either provide the CEO with significant managerial influence and power [Bebchuk, Fried and Walker Reference Bebchuk, Fried and Walker2002] or alternatively, provide informational and resource benefits to the firms for which the CEO is rewarded. A number of papers find evidence consistent with the former. Hwang and Kim [Reference Hwang and Kim2009] find that socially dependent boards—i.e., boards where the directors have social ties to the CEO—offer higher pay levels to their CEOs. Brown et al. [Reference Brown, Gao, Lee, Stathopoulos, Boubaker and Nguyen2012] examine all CEO ties, social and professional, created by CEOs during their lifetimes and obtain similar results to Hwang and Kim [Reference Hwang and Kim2009]. Conversely, prior research also finds evidence of CEO networks providing valuable resources to the firm. Engelberg, Gao and Parsons [Reference Engelberg, Gao and Parsons2013] establish that a CEO’s connections outside of the firm—e.g., past professional, alumni and social ties—are valuable to the firm in terms of the information they bring and, hence, that CEOs are paid for such valuable and portable ties. Horton, Millo and Serafeim [Reference Horton, Millo and Serafeim2012] find that the centrality of the CEO and other directors is positively associated with their compensation and future firm performance.
This inconclusive and at times contradictory evidence regarding the forces that drive corporate remuneration could be due to a lack of precision in previous research designs. In essence, the current literature finds that higher centrality in the interlocking network is associated with higher pay and that homogeneous boards pay more. However, centrality could either encompass classical informational and power advantages either for the firm, for the executives or for both [Burt Reference Burt1992] or capture a position within a network of social exchange, where repeated exchanges reinforce solidarity and mutual obligations. To isolate this latter mechanism, often suspected [Benton Reference Benton2016] but never precisely measured, we will review social anthropology and social exchange theories which examine the dynamics of social exchange. We utilize insights from these theories to both uncover a form of reciprocity that may be at work in corporate interlocks and define a new set of interlock measures enabling to capture its effects.
From to kinship to inter-board solidarity
In the Gift, Mauss [(1923-1924) Reference Mauss2000] highlights that in numerous traditional societies, inter-group social exchanges are governed by three rules: giving, receiving, and reciprocating. Drawing on Mauss’s gift-giving approach, Lévi-Strauss [Reference Lévi-Strauss1969] developed a theory of elementary rules of kinship—the positive rules governing the exchange of women between the masculine lineages of a tribe—as a way of both banning incest and organizing solidarity through exchange between different lineages. Lévi-Strauss identifies two main forms of exchange: restricted exchange, which derives from the preferential union with a bilateral cross-cousin and corresponds to a situation where two masculine lineages exchange women at each generation; and generalized exchange, which derives from the preferential marriage with a matrilateral cross-cousin, where women are exchanged indirectly. In such cases, the lineage from which one receives a woman is not the same as the one to which one gives a woman. Although not discussed extensively, the union with a patrilateral cross-cousin also exists [Lane Reference Lane1962] and corresponds to a delayed exchange. A lineage reciprocates for the woman received by giving a woman at the following generation.
Recruiting directors of a firm to the board of another firm is different from forming kinship relations, but both activities aim at—or at least unintentionally contribute to—strengthened affinities between the two groups. In the case of interlocking directors, expertise, information, and social capital are frequently shared or exchanged through the interlock. Indeed, executives and firms do foster social exchanges through board membership, and CEOs hold most of the power in appointing outside directors [Bebchuk and Fried Reference Bebchuk and Fried2004]. It should be noted that this exchange is not simply one of control, but also involves attendance fees and reputation. Moreover, when a CEO invites another CEO to join their board, this invitation might sometimes come as a result of reciprocal exchange.
We define restricted exchange (Figure 1) as a situation in which two executive board members from two firms simultaneously sit on each other’s boards as non-executive directors. It is probably the most obvious form of reciprocity among executives [Hallock Reference Hallock1997]. However, this type of interlock has garnered academic attention and regulatory criticism, as it raises significant concerns as to whether a director charged with overseeing an executive can be truly independent. Certainly, this type of pattern provides an opportunity for a tit-for-tat exchange. Specialists in exchange theory distinguish between two forms of restricted exchange: direct negotiated exchange, where actors negotiate on the terms of an agreement, and direct reciprocal exchange, where actors perform successive acts in favor of one another without agreeing on those acts, and with no insurance of reciprocity [Molm, Collet and Schaefer Reference Molm, Collett and Schaefer2007]. It is not possible to argue that all such restricted exchange structures systematically correspond to direct negotiated exchange. In some cases, CEOs may deliberately agree to push each other’s pay up in an “I raise your pay, you raise my pay” bargain. Many of those exchanges, however, may be more subtle than simple tit-for-tat bargaining. Without any explicit agreement, executives involved in restricted exchange may be subconsciously more generous when it comes to determining the pay of the executives they monitor. This is consistent with the findings from natural experiments which indicate the role of strong ties between members of the committee and applicants in academic recruitment [Godechot Reference Godechot2016].

Figure 1 Three examples of reciprocity structures among US CEOs
Delayed exchange (Figure 1) is a situation where an executive director of firm x sits on the board of firm y and invites an executive of firm y to join the board of a firm x after the executive’s own board membership in firm y has ended. Delayed exchange is a less visible way for CEOs to reciprocate and therefore receives less attention than the more obvious restricted exchange discussed above. Delayed exchange corresponds more clearly to direct reciprocal exchange [Molm, Takahashi and Peterson Reference Molm, Takahashi and Peterson2000; Molm, Collet and Schaefer Reference Molm, Collett and Schaefer2007]. Relative to simultaneous restricted exchange, delayed exchange may seem more insecure, precisely because of this delay. However, in his account of Mauss’s gift-giving theory, Pierre Bourdieu underlines precisely the importance of the delay [Bourdieu Reference Bourdieu1990]. Without delay, gifts and counter-gifts are like barter or commercial exchange. Even worse, a simultaneous counter-gift equivalent in kind to the initial gift could be considered an offense (i.e., a non-acceptance of the gift). Finally, compared to direct negotiated exchange, direct reciprocal exchange gives less salience to conflict [Molm, Collet and Schaefer Reference Molm, Collett and Schaefer2007]. Therefore, the delay grants some symbolic meaning and some solemnity to the social exchange. It probably operates through a mechanism of mutual indulgence rather than tit-for-tat agreement.
Finally, generalized exchange is a situation where an executive director of firm x sits as a non-executive board member of firm y, which has one executive board member sitting on the board of firm z, which has one executive board member sitting on the board of firm x. This tie is seldom recognized by regulators or academics and indeed is never discussed in relation to CEOs. However, because of its importance in kinship theory, generalized exchange has generated debate as to its likelihood and its efficacy [Lévi-Strauss Reference Lévi-Strauss1969; Homans and Schneider Reference Homans and Schneider1955; Bearman Reference Bearman1997; Takahashi Reference Takahashi2000; Molm, Collet and Schaefer Reference Molm, Collett and Schaefer2007]. Lévi-Strauss [Reference Lévi-Strauss1969] considers generalized exchange to be a way of creating solidarity and as a device for building a society. On the contrary, Homans and Schneider [Reference Homans and Schneider1955] doubt that generalized exchange could exist without meeting the direct interest of each actor involved in the exchange. Controlled experiments have shown that generalized exchange actually produces more feelings of solidarity than restricted exchange [Molm, Collet and Schaefer Reference Molm, Collett and Schaefer2007], although the emergence of generalized exchange remains puzzling [Takahashi Reference Takahashi2000]. Why set up a gift-giving chain when there is such a risk of free-riding, chain interruption, and the possibility of not receiving any gift in return? Most authors derive such structures from norms and from forms of altruism. Although, de facto, we find classical examples of generalized exchange for kinship [Lévi-Strauss Reference Lévi-Strauss1969; Bearman Reference Bearman1997] or for kula exchange [Malinowski Reference Malinowski1922], most studies on the dynamics of networks in contemporary society do not find a tendency to engage in generalized exchange [Lazega, Lemercier and Mounier Reference Lazega, Lemercier and Mounier2006; Snijders, Van de Bunt and Steglich Reference Snijders, Van de Bunt and Christian2010]. Nevertheless, if this structure randomly appears, it can still produce solidarity among the actors involved.
A regulatory shock in reciprocal exchange among boards
These three classical types of reciprocal exchange are also relevant for identifying precise patterns of mutual dependence between a firm’s executives and some of its external board members. The Sarbanes-Oxley Act, detailed below, was introduced to enable regulators to limit, inter alia, the biases reciprocal exchange create, for instance on pay. Thus it provides us with an exogenous shock in which to examine the strength of our theory.
Following several corporate scandals in 2001 and 2002, US institutions favored a redefinition of director and board independence. The Sarbanes-Oxley Act (2002) places a stronger emphasis on board independence, especially within audit committees. Both the NYSE and the NASDAQ published new rules validated by the SEC in November 2003 and asked listed firms to apply them in 2004. These new rules added a supplementary recommendation to the Sarbanes-Oxley Act regarding board independence, especially within the compensation committees. Hence, in section 303A.02 of its Listed Company Manual, the NYSE requires that all members of the board’s compensation, audit, and nomination committees be fully independent. A board qualifies a director to be fully independent if the director “has no material relationship with the listed company.” This prevents the source of a director’s compensation from being dependent on the management of the listed firm. As a consequence, a director is not independent if “the director or an immediate family member is, or has been within the last three years, employed as an executive officer of another company where any of the listed company’s present executive officers at the same time serves or served on that company’s compensation committee.”Footnote 1 This rule does not ban all forms of restricted exchange, but forbids two executive directors from two different firms being on each other’s compensation committees. The NASDAQ set up similar rules but only requires a majority of compensation, audit, and nomination committee members to be fully independent.
These codes can therefore serve as a natural experiment for the social exchange mechanism. The codes target mainly restricted exchange—and to some extent delayed exchange (at least the short delays)—within compensation committees. However, longer delayed exchange and generalized exchange are not recognized and thus not covered.
Listed firms may still implement restricted and delayed exchange. However, since directors in such reciprocity ties are excluded from compensation committees, they are less likely to directly influence the precise setting up of executive pay. This should therefore weaken their effect on executive pay.
*
Overall, investigating the impact of these three reciprocity structures on executive pay could help us uncover some of the mechanisms through which executives extract rents. In contrast to other network structures like centrality which increase CEO pay mostly as a result of the key informational and social resources central executives bring to the firm [Horton, Millo and Serafeim Reference Horton, Millo and Serafeim2012], the reciprocal ties we investigate here create network redundancy and do not increase informational flows or “structural holes” type of social capital [Burt Reference Burt1992]. In contrast, they do create mutual dependence between executives—I monitor you/you monitor me—and provide incentives for (conscious or subconscious) leniency when an executive has to set the pay of another executive on which he or she depends. These network structures, although very specific, enable us to test that solidarity among executives can drive rent extraction. In addition, two statistical analyses will contribute to corroborate our findings. Firstly, the evolution of the reciprocity structure payoff after Sarbanes-Oxley Act once executives embedded in such reciprocity structures are kept away from pay setting. If these ties mainly provide social and informational resources to the firm, the effect should remain constant. Conversely if these ties fuel solidarity in pay setting, they should decline once monitored. Secondly, we will measure the impact of these network structures on firms’ economic outcomes [Horton, Millo and Serafeim Reference Horton, Millo and Serafeim2012]. The resource approach leads to predict a positive tie. In contrast, our rent extraction approach predicts a null or a negative link.
Data, Modeling Equations, and Other Variables
Data
Our sample is derived from multiple data sources. We obtained data from Boardex on US boards of directors for the period from 1990 to 2015 in order to analyze the structure of social exchange between boards. We selected quoted firms and private firms and dropped all other forms of organization (i.e., universities, charities, clubs, government, etc.). After this restriction, the initial sample contained 230,431 board members from 384,645 unique firms, resulting in 1,091,118 board members×firm observations.
We obtained executive pay data from the ExecuComp database. This database provides compensation data between 1992 and 2015 for 45,649 executives in 3,557 unique firms, resulting in 263,637 executives×firm×year observations. One fourth of this information (77,691) contains data on executive board members; the remaining data concerns top executives who do not sit on boards.
We obtained firm-specific data from Compustat for the period from 1990 to 2016 to enable us to construct several control variables. For example, to control for a firm’s revenue, we were able to obtain information for 30,413 firms, resulting in 329,789 firm×year observations.
After merging these three datasets, our final sample contained 3,395 unique firms, with 31,852 individual board members and pay for 45,288 executives. Between 1990 and 2015, each year in our final database contained between 2,000 and 2,700 unique firms, 6,000 to 14,000 board members, and 8,000 to 12,000 executives (Table A1).
From board composition to executive reciprocity structures
Our network approach differs from prior interlock studies, which generally approximate the link between the numbers of contemporaneously interlocking CEOs. We concentrate on the precise intertwining of social exchange and corporate control. Therefore we do not consider, for example, that two executives sitting together as non-executive board members constitute a significant link of control, so these ties are ignored. Our network arc of executive control reflects the fact that an executive from one firm sits on the board of another firm as a non-executive board member and therefore controls the firm and its executive. To capture social exchange of control between executives, we employ the classical k-cycle measure from network literature.Footnote 2 Therefore, we use 2-cycles (x→y→x) to measure restricted exchange; 3-cycles (x→y→z→x) and 4-cycles (x→y→z→w→x) are used to measure generalized exchange. We ignore any k-cycles above 4, as these are both rare and unstable, and we suspect that these cycles are the random product of network connectivity and consequently do not produce any meaningful social effects. Finally, delayed exchange corresponds to firms which have among their non-executive board members an executive from a firm for which they had an executive on the board in the previous five years. In network language, this is a directed dyad x→y starting in t which reciprocates a reverse directed dyad y→x which existed in at least one year between t-5 and t-1 and terminated before year t. In order to avoid overlap with past restricted exchange, we exclude from delayed exchange those that were previously restricted exchanges.
Figure 2 provides an example of this control network for the year 2000, in the middle of our period. Most links are non-reciprocal and do not belong to any sort of cycle. Within this graph, we isolate, using different colors, the links that specifically belong to cycles or delayed 2-cycles. Approximately 11% of the control links between executives from different firms imply some form of reciprocity that could attenuate the control purpose. Figure 3 further isolates those ties between firms. The majority are in a 2-cycle (64 firms), while eleven firms are in a 3-cycle, three firms in a 4-cycle, seven firms in a 5-and-above-cycle, and fourteen firms in delayed 2-cycles.

Figure 2 Year 2000 network between executive directors (control tie)
Note: We say a firm x controls a firm y (“control tie”) when one of the executive director of the former controls the latter thanks to a position of non-executive board member. Non reciprocated control ties are yellow. Delayed exchange control ties are black. Cyclical control ties use other colors: red for 2-cycles, green for 3-cycles, blue for 4-cycles, light-blue for 5-cycles and longer ones.

Figure 3 Year 2000 cycles between executive directors (control tie)
Note: Only cyclical ties or delayed exchange ties are here represented. Colors and definitions cf. figure 2.
Figure 4 and the Table A1 illustrate the sense of the evolution in reciprocity in the control network. Reciprocity in the control network increases in the 1990s, reaching a peak of 101 firms out of 2,769 (3.6%) at the end of that decade. In the 2000s it declines substantially, especially after the mid-2000s. There are several reasons for such a decline. First, the corporate governance codes adopted a stricter notion of director independence for corporate boards and discouraged restricted exchange and other related forms of dependence between executive and non-executive directors. Second, firms tended to appoint fewer of their own executives onto their boards and generally to have only one executive on the board, commonly the CEO. COOs or CFOs are generally not appointed anymore, which decreases the probability of such reciprocal ties. Finally, the decreasing density of interlocks and the fracturing of corporate America also contributed to a decline in the likelihood of reciprocal ties [Mizruchi Reference Mizruchi2013; Chu and Davis Reference Chu and Davis2016]. We will check further whether this decline in reciprocity is due to a lower propensity to reciprocate or to a decline in reciprocity opportunities.

Figure 4 Executive pay and reciprocity structures
Note: Compensation variables are expressed in ten thousands of 2015 dollars (log-scale). We superimposed the number of firms engaged in at least one cycle (2-cycles, 3-cycles, 4-cycles and delayed exchange cycles – we excluded k-cycles where k>4.
Finally, Figure 4 also highlights the fact that, in the early 1990s, the increase in reciprocity was in line with increases in executive pay. However, after 2000, executive pay declined only moderately during the dot-com crisis, especially in relation to option-based compensation. It stabilized at higher levels after 2003 and then appears to follow the business cycle [Kaplan Reference Kaplan2013], unlike reciprocity, which declines substantially after 2005.
Modeling equations
– Network dynamics
In order to estimate the probability to reciprocate, we employ an elementary dyadic logistic regression. We model the probability that a firm x controls another firm y through the presence of at least one executive of the former firm on the board of the latter firm. We introduce reciprocity opportunities as our key independent variables. Reciprocity opportunities are defined as network configurations in t-1, which could be turned into a given reciprocity structure (hence restricted exchange, delayed exchange or generalized exchange) if a control tie is established in t between x and y. For instance, if y controls x in t-1, x has an “opportunity” to reciprocate by establishing a control tie in t on y. We thus measure the relative propensity to build a tie in such situations in contrast to others. The equation is as follows:
 $$ {\displaystyle \begin{array}{c}\hskip-3.5em P\left( firm\hskip0.3em x\hskip0.3em control\ firm\hskip0.3em y\hskip0.3em executives\ in\ time\hskip0.3em t\right)= past\_ controling\_{tie}_{x,y,t- 1}\\ {}\hskip19.5em + reciprocity\_{opportunities}_{x,y,t- 1}+{activity}_{x,t- 1}\\ {}\hskip10.5em +{popularity}_{y,t- 1}+{year}_t+{error}_{ijt}\end{array}} $$
The 26-year longitudinal dimension of our data enables us to introduce a lagged structure of the network as a predictor of link formation or maintenance at time t. We therefore avoid the traditional endogeneity problem of synchronously explaining the network structure by itself. We only assume here that the lagged network is exogenous. While this assumption could still remain questionable, the length of our period enables us to limit the bias due to the introduction of lag-dependent variables. Logistic regressions, used similarly in previous studies [Rider Reference Rider2012; Boussard, Godechot and Woloszko Reference Boussard, Godechot and Woloszko2019], offer a great deal of flexibility, unlike SAOM (also known as SIENA) and TERGM models [Snijders, van de Bunt and Steglich Reference Snijders, Van de Bunt and Christian2010; Cranmer and Desmarais Reference Cranmer and Desmarais2011], while also providing the advantage of handling much larger datasets.
– Impact of reciprocity structures on pay
To determine the impact of reciprocity structures on pay, we estimate executives’ wage equations with two-year first-difference panel regressions. The two-year lag ensures that board members in reciprocity structures did not arrive in the middle of the year, and were fully present the whole year and involved in all decision-making processes during the year which impacted executive pay.Footnote 3 We therefore model two-year wage evolution for a given executive in a given firm. Hence, firm×executives first-difference regressions account for firm×executives fixed effects on wage levels and therefore control for time-invariant characteristics of either the firm, the executive, or their match. First-difference models offer flexibility for estimating both short-term effects and longer-term effects of embeddedness in reciprocity structures. They also enable us to differentiate between entering and exiting a reciprocity structure. We therefore measure the impact of entering or exiting a reciprocity cycle on the evolution of executive wages.
In order to estimate classical multiplicative models for all continuous variables (except for the bonus to fixed salary ratio), we use inverse hyperbolic sine as a quasi-log function: sinh‑1(x)=log(x+(x²+1)0.5), a “quasi-log” function that behaves like a log(x) for positive values, and like ‑log(‑x) for negative ones, and which thus enables us to handle null values. We also control for a set of firm and individual time-varying variables described in detail below. Lastly, we include yearly fixed effects to control for common shocks in the evolution of executive pay.
– Our main equation is the following:
 $$ {\displaystyle \begin{array}{l}{\varDelta}_{\left[t-k,t\right]}{\mathit{\sinh}}^{- 1}\left({wage}_{if}\right)={\varDelta}_{\left[t-k,t\right]} firm\_ in\_a\_ reciprocity\_{structure}_f\\ {}\hskip16.5em +{\varDelta}_{\left[t-k,t\right]}{controls}_{if}+{year}_t+{error}_{if t}\end{array}} $$
In order to address eventual serial correlation of residuals and possible reverse causality effects, we also estimated Anderson and Hsiao [Reference Anderson and Hsiao1981] models: we introduce on the right-hand side of Equation 2 the lag of the first-difference of the dependent variable, instrumented with the past level of the lagged dependent variable.Footnote 4
– Impact of reciprocity structures on performance
Finally, to ascertain whether these forms of reciprocity reflect rent extraction, we investigate whether they have some impact on indicators of the firm’s operating performance post one (t+1) or two years (t+2). In order to capture time invariant unobservable heterogeneity, we continue to use a first-difference equation (Equation 3).
 $$ {\displaystyle \begin{array}{l}{\varDelta}_{\left[t+k- 1,t+k\right]}\hskip0.3em firm\_{result}_f={\varDelta}_{\left[t- 1,t\right]}\hskip0.3em firm\_ in\_a\_ reciprocity\_{structure}_f\\ {}\hskip17.3em +{\varDelta}_{\left[t- 1,t\right]}{controls}_f+{year}_t+{error}_{ft}\end{array}} $$
Variables
We apply Equation 2 to seven dependent executive pay variables extracted from ExecuComp: fixed salary, bonus, bonus to fixed salary ratio, total cash, estimated present value of stock options, total equity-related pay, and total compensation. Table A2 provides the descriptive statistics on all variables used to estimate Equation 2.Footnote 5 We “winsorize” the bonus to fixed salary ratio at the top 1% level.Footnote 6 These variables are likely to have different sensibility to these temporary and infrequent reciprocity structures. Fixed wages evolve slowly from one year to another and are probably less sensitive to board discretion than variable pay. Among variable pay schemes, stock options and equity-related pay are distributed through irregular plans, and the estimation of their present value may be difficult, which may make the link with reciprocity structures harder to estimate. In contrast, bonuses are subject to regular board discretion, through yearly attribution. Their cash dimension makes their estimation easier and more precise. We thus expect bonuses to be the most likely pay variable associated with reciprocity structures.
In Equations 2 and 3 we introduce a number of executive, firm, and board controls. To control for individual executive heterogeneity, we include two executive characteristics available in Boardex: specifically, whether the executive is a CEO and whether the executive is a board member (while non-board member executives stand as the reference category). The number of executives described in the firm provides an approximation of the hierarchical position of executives in the firm: firms which describe the pay of more executives will probably describe executives lower in the hierarchy. While this last proxy is not very precise, the director-firm first-difference models also control for all time-invariant unobserved individual characteristics.
To control for firm characteristics, we include firm size measured by both total assets and shareholders’ equity, and firm performance using sales and operating income. For all those amount variables, we also use the sinh‑1(x) quasi log function in order to estimate negative values. We also include a dummy variable to capture negative operating income, a variable to control for one-year increase in operating income (difference in quasi-log), as well as a 3-year coefficient of variation of operating income to capture volatility (winsorized at p=0.01 and p=0.99) and return on equity (ratio of operating income to equity winsorized at p=0.01 and p=0.99). Finally, we include a dummy variable to control for any differences between private and public firms.
We control for a number of board and network characteristics. Specifically, we control for the size of the board, which has been found to be a positive predictor of executive pay. We also proxy the position of the firm in the control network with two dummy variables which capture the network “popularity” and “activity.” We therefore control for the fact that at least one non-executive director also serves as an executive director in another firm (hence firm w→firm x, where “→” stands for control), and for the fact that one of the firm’s executive directors is a non-executive director elsewhere (hence firm x→firm z). Controlling for these two types of links is important when measuring the impact of cycles, as we need to make sure that cycles (hence firm y→firm x→firm y) really capture a reciprocal social exchange and not the combination of incoming and outgoing control ties.
Finally, our variables of interest (the reciprocity structure described previously) are captured using three dummy variables, each taking the value of one if the cycle has: 1) at least one 2-cycle connection with another firm; 2) at least one delayed 2-cycle with another firm;Footnote 7 and 3) at least one 3-cycle or one 4-cycle connection with another firm—and zero otherwise.
In order to estimate Equation 3, we use t+1 and t+2 measures of the firm’s return (assets, equity, income, sales, ROE) as dependent variables and t network measures as independent variables, and t performance variables as control variables.
Results
Tie dynamics
Table A1 reports the description of the sample and the frequency of the reciprocity ties for each year. Over the full period 198 unique firms out 3,395 were engaged at least in one year in a restricted exchange, 45 in delayed exchange and 59 in generalized exchange. Each year, on average, 1.4% of the firms are involved in a restricted exchange, 0.4% in a delayed exchange, and 0.3% in a generalized exchange. Even before 2004, when cycling was higher, restricted exchange peaked at maximum 2.7%, delayed exchange at 0.8% and generalized exchange at 0.5% of the firms of our sample. These small frequencies could initially suggest that these ties are very scarce and therefore potentially not very meaningful. They could simply be an artifact of a random consequence of network dynamics, or even a situation that is deliberately avoided by corporate actors aiming to achieve sound corporate governance.
In order to address this issue, we turn the matrix of control ties between non-isolated firms (≈2,500*2,500 firms) for each year into a dyadic database (Table 1). This generates a database of 163 million dyads. In order to manage it and run the models, we use scarce matrix tools and aggregate identical lines and estimated weighted descriptive statistics and regressions on a reduced matrix of 137,000 lines.
Table 1 Probability for firm y to control firm x

Note: On average, a given firm y has 0.013% chance of controlling a given firm x in t-1 (Column 1). Conditionally to the existence of a this past controlling tie, the probability for y to control x amounts (81%). As we can’t compute the conditional probability for continuous variables (popularity and activity), we calculate instead the correlation coefficient r between them and the controlling tie in t. Models 1 to 5 are dyadic logistic regressions modeling the existence of a controlling tie between firm y and firm x.
We adapt here the definition of delayed exchange to the regression design. The no reversed tie in t-1 condition insures that y firm is not trying to build a restricted exchange as reverse tie has already been severed. The no tie in t-2 condition insures it wasn’t a previous restricted exchange.
Standard errors in parentheses. Note: *p<0.1; **p<0.05; ***p<0.01
This dyadic database enables us to investigate the occurrence of a control tie between two firms. In Column 1, we find that the average probability of occurrence of a control tie between a given firm y and a given firm x is approximately 0.013%. When the tie existed in t-1, the probability increases to 81% indicating, unsurprisingly, a strong persistence of ties (Column 2). Let us focus on whether a firm will cycle in t when it had an opportunity to do so. The existence of a reverse control tie in t-1 increases the probability of the formation of control tie to 4%. Moreover, a former reverse control tie, even when it was severed, still increases the probability of occurrence of a control tie to 0.6%. The effect of inverted 2- or 3-paths, which offer an opportunity for firms to engage in generalized exchange, also increases the probability of occurrence of a tie to 0.6%.
Column 3 reports the results of our first estimation of Equation 1. We find positive and significant (p<0.001) coefficients on all three reciprocity ties. This suggests that firms do indeed favor reciprocating ties in board composition. The opportunities for restricted exchange, delayed exchange, and generalized exchange multiply the odds ratio of making a tie, respectively, by 3.6 (i.e., exp(1.25)), 74 (i.e., exp(4.31)) and 2.1 (i.e., exp(0.73)). So, although these cycles are rare—mainly because opportunities for creating such ties are rare—we find that when this opportunity does occur, firms use these ties more often than would be expected in a random distribution.
To address the concern of a bias being introduced by the presence of the lag dependent variable, especially when it approaches unit root, we estimate our model without the main lag dependent variables (Model 2) and further estimate the model conditionally to the lag dyadic tie: tie creation (Model 3)—when the tie did not exist in t-1—and tie maintenance (Model 4)—when the tie already existed in t-1. We find that the results are qualitatively similar. The three reciprocity opportunities contribute to the tie, especially to tie creation. Past reciprocity contributes to tie maintenance, while past delayed and generalized exchanges do not have a significant effect on the latter.
In order to estimate the impact of the new requirements for board independence under the governance codes described earlier, we compare two periods: pre-requirements (1992-2003) and post-requirements (2004-2015) in Model 5.
The results indicate that after 2003, there is a strong decline in the tendency to achieve restricted and delayed exchange. Despite its decline compared to the pre-2004 period, the tendency to restricted exchange remains positive and significant during the last period (when summing main and interaction effects).
Conversely, the tendency to achieve generalized exchange does not decrease: the interaction effect is positive, but not significant, and the sum of the main effect and the 2004-2015 effect is strongly positive and significant. The decline in generalized exchange that we observe in the descriptives reported in Table 1 is therefore mainly due to the declining density of the networks. Executives have fewer occasions to achieve such forms, although they are more inclined to do so.
Our results contrast sharply with those of Withers, Kim and Howard [Reference Withers, Kim and Howard2018], who find an increase in reciprocity in the period 2004-2006 immediately following the Sarbanes-Oxley Act (2002). Part of the difference might be due to the size of their sample, which is much smaller than ours, and the methodology—the sophisticated Stochastic Actor-Oriented Model of network change (with the Siena software) versus very simple logistic regressions. However, we postulate that Withers, Kim, and Howard [Reference Withers, Kim and Howard2018] may have overlooked the time necessary for firms to adapt to the new recommendations concerning board governance.Footnote 8
Reciprocities and executive pay
Table 2 reports the descriptive statistics on the compensation of executives and the position in reciprocity cycles. This forms our first approach to investigating the relationship between structural forms of reciprocity and pay. Panel A clearly shows that executives in firms embedded in cycles enjoy higher pay. For instance, firms engaging in restricted exchange pay on average +18% in fixed salary, +19% in bonus, +19% in total cash, +117% in stock options, +60% in equity pay and +38% total compensation than firms that do not count any reciprocal ties within their board. The impact of delayed exchange—or even more, of generalized exchange—appears even stronger.
Table 2 Compensation and reciprocity structures

Mean difference in quasi-log (sinh-1(x)=log(x+(x²+1)0.5) of 2015 constant $ compensation and standard error in parentheses.
Note: ***p < 0.01, **p < 0.05, *p < 0.1. (Student t-test)
However, those firms that resort to such reciprocity ties might also have some specific characteristics in terms of size, sector, or executive skills that could also explain the pay gap. Panel B alleviates some of this concern by following the average evolution in pay for each firm’s executives in the two years following the apparition of a reciprocity link within the board of directors. In the first year, restricted exchange, delayed exchange, and generalized exchange increase bonuses by, respectively, 6%, 85%, and 31%; total cash by 9%, 8% and 0%; and total compensation by 10%, -4% and 14%. The two-year impact is even stronger, with respectively +12%, +13%, and +11% of total cash. Although these are only univariate results, this simple first-difference table imposes a highly demanding structure to the comparison, as it controls for time-invariant individual, firm, and individual×firm heterogeneities.
To control for time-varying firm and individual heterogeneity we run Equation 2, the first-difference regression, which controls for the change in the hierarchical position of the executive, the change in the size of the firm and its operating performance, and the change in the position within the interlock network (Table 3). The use of the two-year difference model allows us to better summarize the joint effect of differences and lagged differences in reciprocity structures.Footnote 9 Moreover, it also allows a better targeting of fully effective reciprocal ties already present from the first day of year t.
Table 3 The effect of reciprocity on CEO pay. Results from two-year first-difference OLS regressions (within firm×individual units)
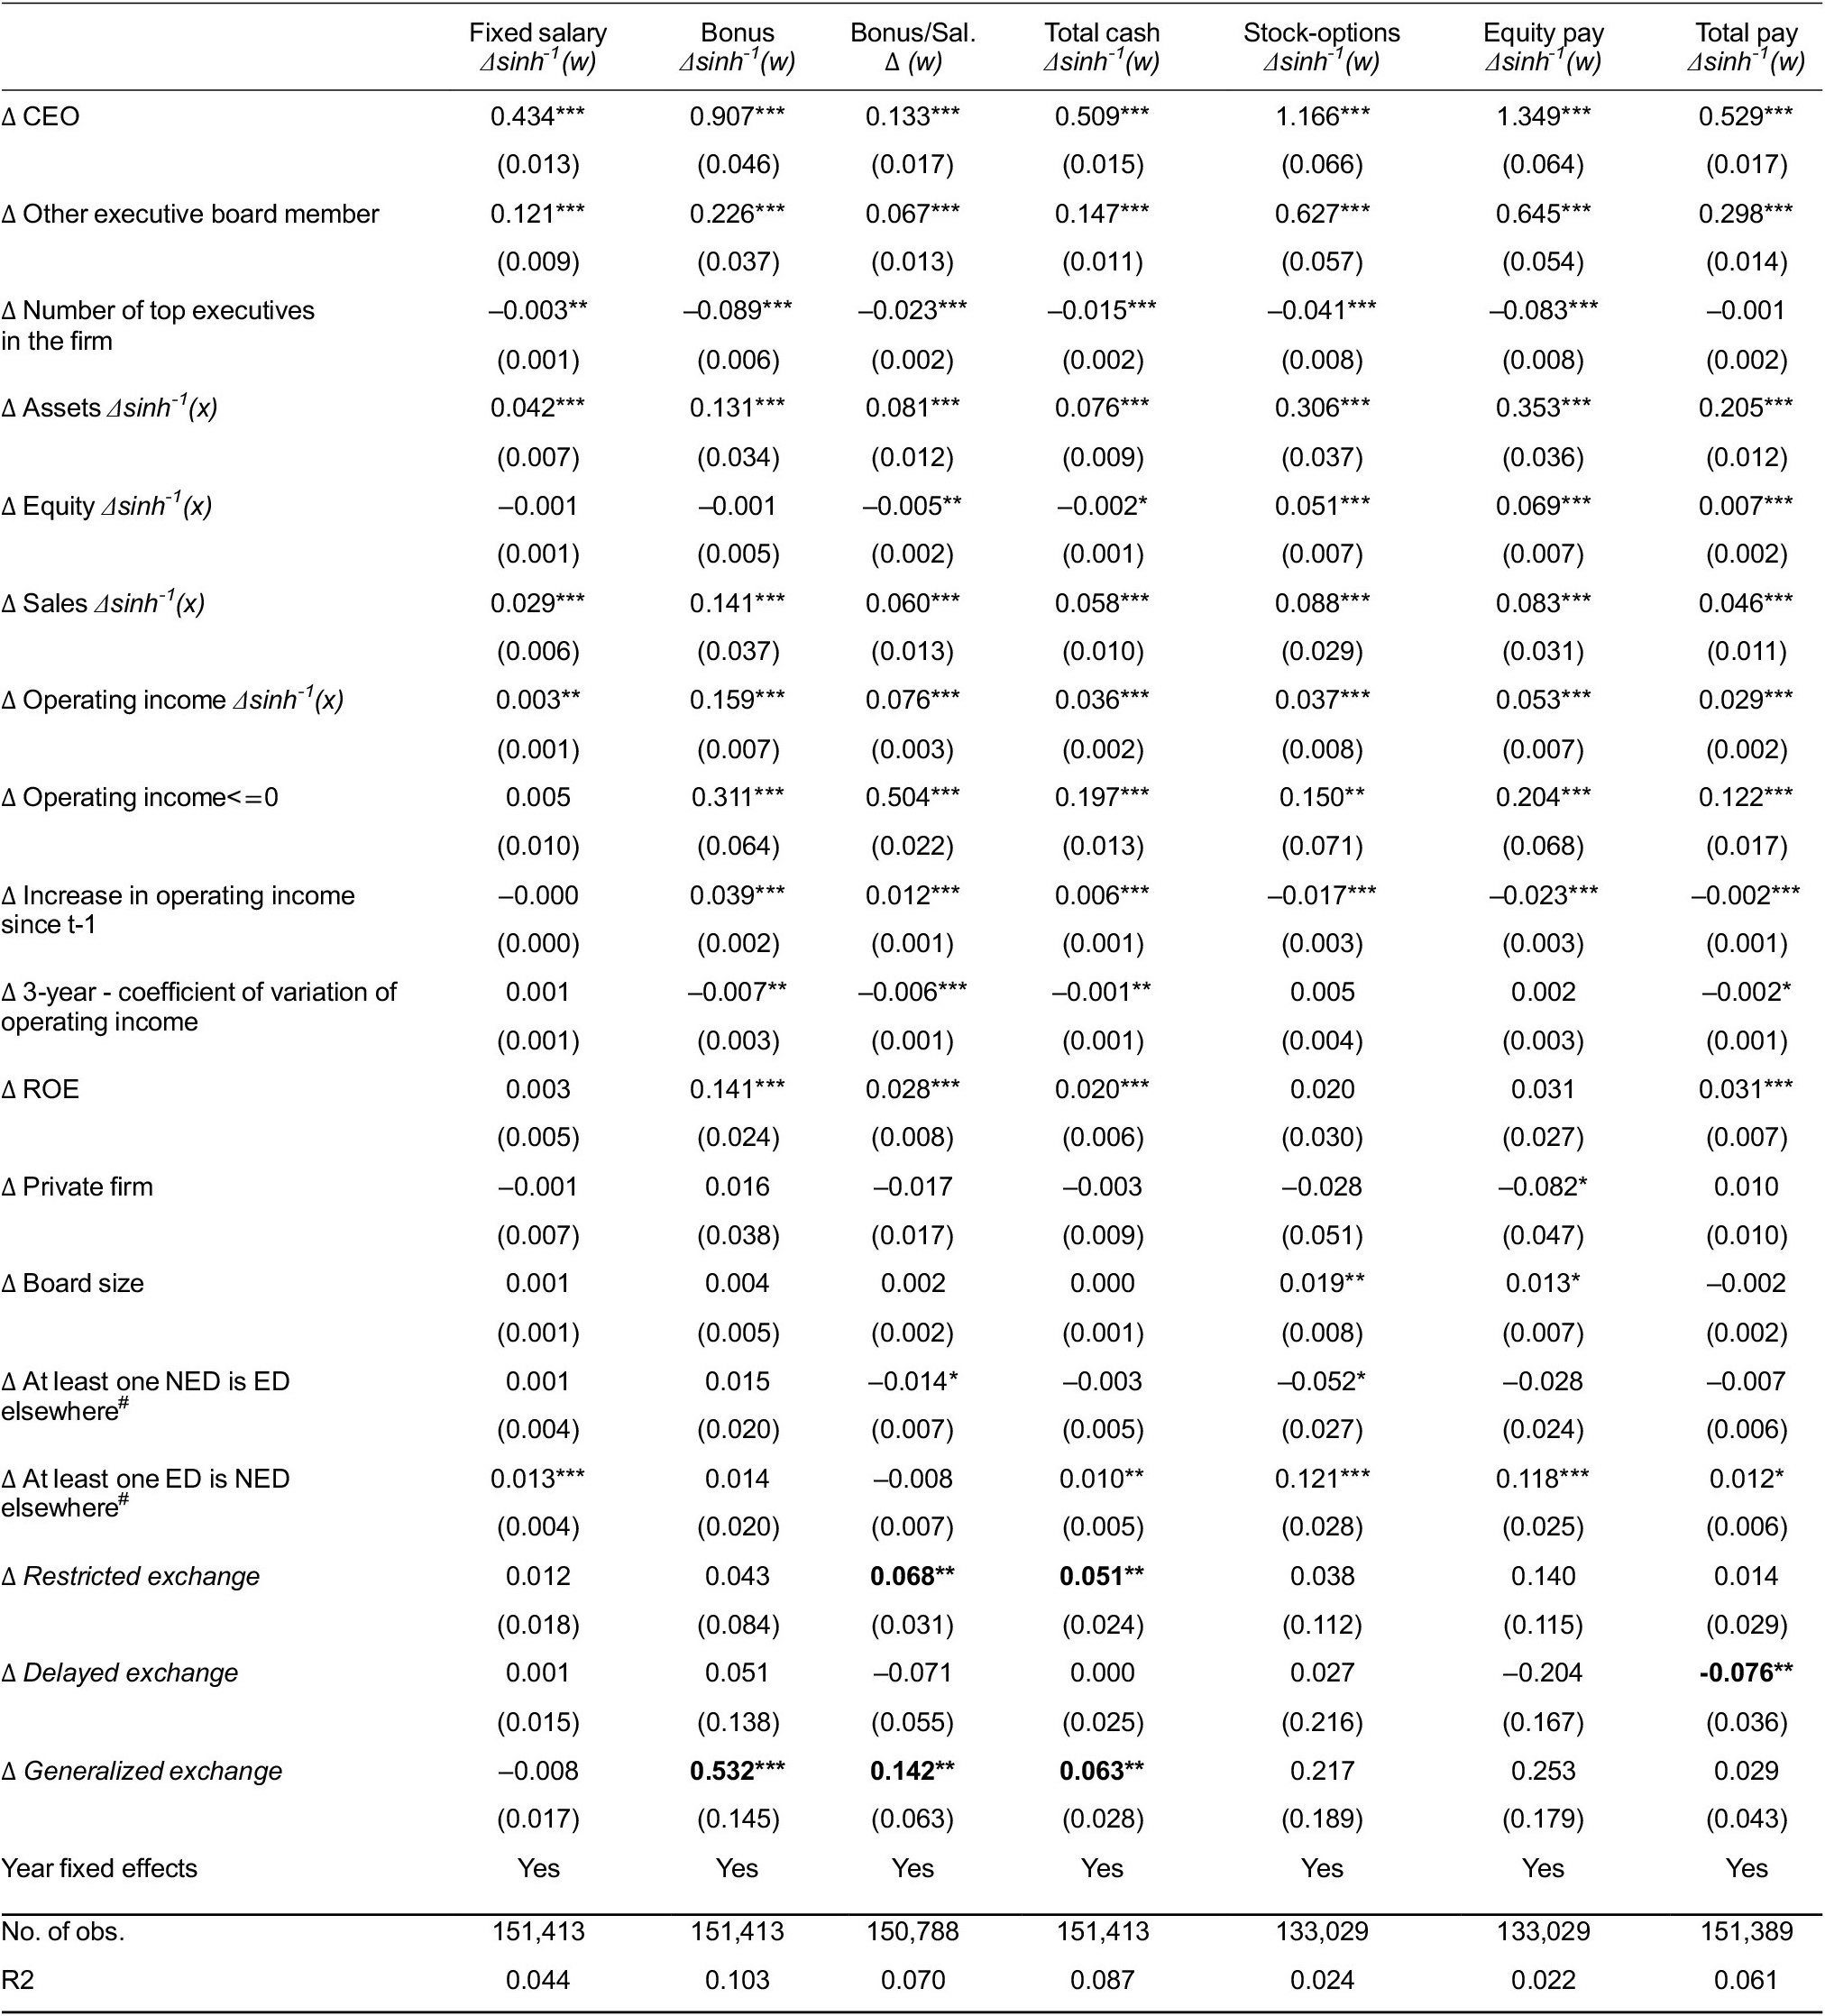
Note: We limit changes in cycling to those occurring between t-2 and t-1. For calculating “quasi-logs” of variables that can be negative or null, we use the inverse hyperbolic sine: sinh-1(x)=log(x+(x²+1)0.5).
All models are 2-year first-differences OLS panel regression. Robust clustered standard errors at the firm×executive level. ***p < 0.01, **p < 0.05, *p < 0.1.
# ED: executive director; NED: non-executive director.
The change in restricted exchange has a modest effect, producing a 7-point increase in the bonus to fixed salary ratio (Column 3) and a 5-point increase in total cash payment. Here, delayed exchange has no significant positive impact on pay in time t. We even find an unexpected negative impact on total compensation. Generalized exchange produces a positive association on pay. The coefficient on generalized exchange in Column 2 indicates a positive effect of 70% exp(0.532). Effects on bonus to fixed salary ratio and on total cash are positive and significant in the second year. This result is consistent with the findings reported in the social exchange literature that generalized exchange needs more time to produce an effect.
First results from Table 3 therefore provide mixed support for the impact of executive interlock reciprocity on executive pay. The most robust impact is that of generalized exchange on bonuses. The effect of direct reciprocity already pinpointed in previous article Hallock’s [Reference Hallock1997, Reference Hallock, Carpenter and Yermack1999] is only mildly confirmed. However, in Table 3, we mix two periods which are very heterogenous in terms of corporate governance and tolerance to interlock reciprocity.
We therefore examine whether the increased pressure for sound corporate governance following the Sarbanes-Oxley Act (2002) and its implementation by the NYSE and the NASDAQ in 2003, and the correlative decline in interlock reciprocity shown by Table A1, also reduces the effect of reciprocity on executive pay. Here, this exogenous shock in corporate rules serves as a natural experiment on the efficacy of reciprocal ties on pay. As explained previously, it allows us to compare a first period where those restricted and delayed exchanges are not constrained with a period where they are constrained. Two mechanisms could be at play here. The new rules did not formally ban board cycles—even the most obvious one, restricted exchange—but banned “interlocks” (what we call restricted exchange) from a board’s compensation committee. Interlocked directors can remain on the board and continue to potentially influence executive pay through their indirect influence and their votes on proposals by the compensation committee. The primary effect of the new regulation banning interlocks from compensation committees should, at a minimum, decrease the effect of restricted exchange.
Could the effect remain positive? On the one hand, the criticisms addressed to restricted exchange could lead firms using it for other business reasons to become conscious that it also leads to some partiality in board monitoring. This process of conscientization could lead to the use of strategies to diminish the bias through increased restraint in pay. This additional phenomenon could lead to a negative effect of restricted exchange after 2003.
On the other hand, when these forms of endogamy are criticized, they may be abandoned by the firms that wish to abide by the principles of sound corporate governance and remain in those firms that are run by more opportunistic executives who prefer weak corporate governance. This selection effect could drive up the positive effect of reciprocity on CEO pay and lead to its maintenance.
The new regulation and its interpretation led to targeting restricted exchange and short-term delayed exchange; it did not acknowledge or discuss long-term delayed exchange or generalized exchange. Consequently, we should not observe a decrease in the impact of generalized exchange.
Table 4 shows striking results for restricted and delayed exchange. Before 2004, restricted exchange between executives produces consistent pay premiums for all types of variable pay: restricted exchange increases bonuses +22% (exp(0.197)), bonus to fixed salary ratio by 9 percentage points, total cash by +6%, options by +25%, and equity pay by +38%. Similarly, delayed exchange increases bonus to fixed salary ratio by 15 percentage points and total cash by +7%. This is consistent and confirms Hallock’s [Reference Hallock1997, Reference Hallock, Carpenter and Yermack1999] findings for the pre-2004 period. Moreover, our controls for matched firm-executive fixed effects provide much stronger proof of the impact of restricted exchange during this period.
Table 4 The effect of reciprocity before and after the implementation of Sarbanes-Oxley. Results from two-year first-difference OLS regressions (within firm×individual units)
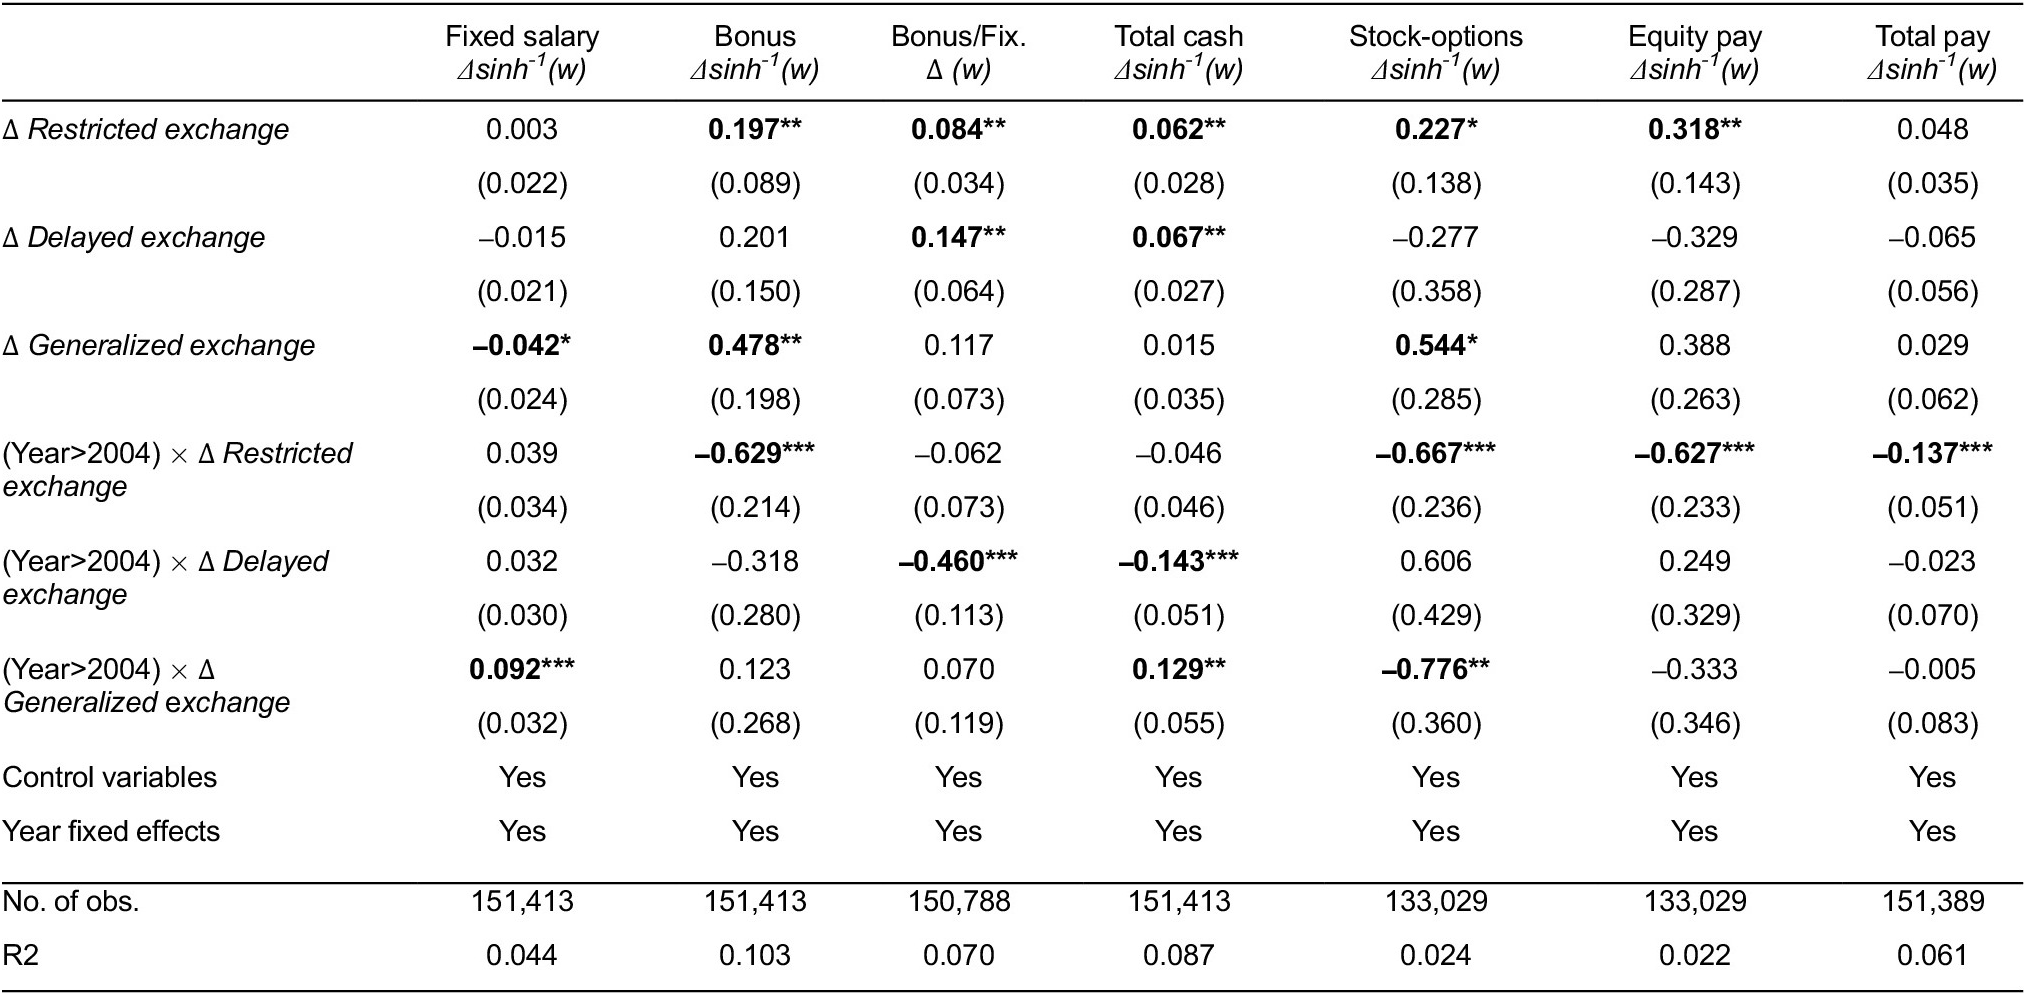
Note: We limit changes in cycling to those occurring between t-2 and t-1. Therefore, the first changes in cycling during the second period occur between 2003 and 2004.
All models are 2-year FD OLS panel regression. Robust clustered standard errors at the firm×executive level.
Control variables are the same as in table 4. For calculating “quasi-logs” of variables that can be negative or null, we use the inverse hyperbolic sine: sinh-1(x)=log(x+(x²+1)0.5).
***p < 0.01, **p < 0.05, *p < 0.1.
Conversely, after 2004, the restricted exchange effect declines by a magnitude of -50% for bonuses, stock options and equity pay, of -12% for total pay. The decline is even more pronounced than the pre-2004 benefit. A similar result is found for delayed exchange, which was also partially targeted by the 2003 reform. Therefore, after 2004, having a restricted exchange tie in the board also leads to compensation that is significantly lower (for bonuses, options, and total pay) than executive pay outside any reciprocity tie.Footnote 10 This phenomenon is consistent with a process where boards acknowledge their own bias. When they maintain an interlock, boards and executives appear to overreact to this source of positive bias by setting executive pay at a level below that of other firms.
The opposite is true for generalized exchange, which remains the same or even increases after 2004, especially for bonuses and total cash. We also find a significant decline for options after 2004; however, this finding must be considered with caution due to the change in the definition of this variable during this period and to the impact of a limited number of outliers.
Currently, under current corporate governance codes, generalized exchange is ignored and hence unlikely to be monitored. Consequently, it is not surprising that it continues to have a positive impact on pay during the second period. However, without any change in corporate norms, the declining participation of executives on boards, both as non-executive board members and as executive directors, considerably diminishes the opportunity for such cycles to be created. At the end of the period, generalized exchange no longer impacts pay, simply because this type of tie disappeared.
Are these network effects rent extraction?
One could argue that cycles in board networks are linked to industrial strategies, such as building alliances between firms, exchanging information and testing the first steps of future mergers. Consequently, they could be tied to higher pay not because board members within reciprocity cycles are more generous when it comes to the evaluation of the executives they monitor, but because these executives are engaged through this type of tie in an industrial strategy that is profitable for their firm.
In our prior models, we controlled for firm performance (see Tables 3 and 4) and the results indicated that the network effects continue to be associated with higher pay. However, the impact of the network on a firm’s performance may take time to materialize. We therefore investigate the impact of our three forms of reciprocity exchange on a firm’s performance in time t+1 and t+2. Firm performance is measured using a number of performance indicators: assets, equity, sales, income, and return on equity (ROE).
Table 5 reports the results of this additional analysis using first-difference models. The results provide very little evidence of improvements in firm performance over the following 2-year period. Reciprocity exchange is not significantly and positively associated with any of our measures of a firm’s performance, except for a small significant positive effect of delayed exchange on ROE in t+1 (which partly vanishes in t+2). We also find a negative and significant impact of generalized exchange on income and ROE during the first year. We do not find much evidence of significant differences in impact before and after Sarbanes-Oxley. Overall, the picture suggests that there is no link between forms of exchange and forward measures of a firm’s performanceFootnote 11 . The use of interlock cycles does not seem to correspond to a functional corporate strategy for increasing pay. It does not harm firms’ performance. Still, it increases executive pay. This therefore leads us to interpret the impact of reciprocal exchange on executive pay as being one of rent extraction, rather than an efficient market price for performance.
Table 5 Effect of social exchange on future results. First differences models

Note: All models are 1-year FD OLS panel regression. Robust clustered standard errors at the firm level. For calculating “quasi-logs” of variables that can be negative or null, we use the inverse hyperbolic sine: sinh-1(x)=log(x+(x²+1)0.5). Control variables in Panel B similar to Panel A. *p<0.1; **p<0.05; ***p<0.01
Discussion: A Tip of the Iceberg Phenomenon
This article finds that firms engage in several forms of board reciprocities—restricted, delayed, and generalized exchange—which undermine non-executive directors’ independence and grant their executives higher pay, especially bonus payments and total cash. Our study makes several contributions.
First, we contribute to social exchange theory. We show that mutual benefits for actors come not only from well-understood restricted exchanges, but also from being engaged in delayed exchange and generalized exchange. These results are all the more intriguing given that these two exchange structures are generally considered less efficient given the opportunity to free ride and to not reciprocate. A possible explanation is that those structures also fuel stronger mutual obligation and give some solemnity to the exchange.
Second, by specifically focusing on a form of social exchange whereby the actors are structurally tied to one another and have a common interest in improving each other’s pay, we add to the compensation literature. We provide additional support to previous studies finding a positive impact of homophilic ties on pay [Kramarz and Thesmar Reference Kramarz and Thesmar2013; Kim, Kogut and Yang Reference Kim, Kogut and Yang2015]. Because our results are based on time-varying solidarity within firm boards, they are less likely to be biased by a reflection effect [Manski Reference Manski1993; Mouw Reference Mouw2006]. Last, we extend previous studies that showed the positive impact on pay of restricted exchange [Hallock Reference Hallock1997] in two ways. Firstly, we provide a stronger model of the impact of cross-directorship by considering the firm and individual constant unobserved heterogeneity; and secondly, we identify additional forms of reciprocity.
Finally, we show that regulation did affect the association between board network and pay. The evolution of the norms defining board independence after 2004 serves as a natural experiment supporting the positive association of at least two of the reciprocity structures, restricted and delayed exchange, on pay. New codes of governance targeted these forms of social exchange as they were incompatible with full independence, and excluded them from compensation committees. Following this new regulation, the pre-2004 premium of these types of exchange on bonuses and equity pay disappeared, and even reverted to a negative premium in executives’ pay. Conversely, generalized exchange, which was not targeted by corporate governance codes, remained effective. Hence, the implications of such regulation are twofold. Regulating pay-increasing strategies does have some effect: once regulated, these strategies do not work as they used to. However, the overall effect of regulation on executive compensation will remain limited since executives can still switch from a regulated strategy to an unmonitored one.
Overall, our results on the role of reciprocity structures contribute by documenting the existence and the mechanisms of rent extraction. Indeed, these results seem difficult to explain with informational or firms’ power mechanisms. A board of a firm entering reciprocity structures does not increase the flow of information profitable to the firm as a whole nor the economic power it exercises on its economic environment. Hence, as a result, it does not have any impact on the firms’ revenue. Conversely, entering those reciprocity structures does empower a limited set of individual actors: reciprocally connected executives. On repeated occasions, they can support one another when it comes to pay determination. Hence, this paper contributes by highlighting that executives’ solidarity rooted in favorable network structures provides opportunities for rent extraction.
Although the marginal effect of these reciprocity structures is substantial, the overall effect on executive pay and its evolution remains limited because these structures are rare. Indeed, with the fragmentation of corporate networks [Mizruchi Reference Mizruchi2013; Chu and Davis Reference Chu and Davis2016], they are almost non-existent after 2013. Had such reciprocal ties not existed, the levels and changes in CEO pay would not have been very different. For instance, counterfactually suppressing the pre-2004 premiums for the three reciprocal exchanges would have diminished global bonus amounts by only 2% in the year 2000. However, because we focus on very rare ties and structures, we argue that our findings only reveal the tip of the iceberg of the phenomenon.
Executives are tied to one another via multiple sorts of ties, but we focus only on the most visible and the most traceable forms. By doing so, we believe we underestimate the multiplex and therefore complex types of exchange in the corporate world. Bourdieu’s analysis for French Academia may also hold true for US executives: “the circulation of services rendered can only be perceived at the level of a group of institutions, and it is rare that they take the visible form of a direct and immediate exchange […] the longer, the more complicated and the more indecipherable for uninitiated is the cycle of exchange” [Reference Bourdieu1988: 86]. Thus, a future challenge for social network analysts is to estimate the true size of the iceberg based on the size of its tip.
Table A1 Description of the boards

Note: Delayed 2-cycles exclude delayed 2-cycles which were former 2-cycles.
Table A2 Descriptive statistics
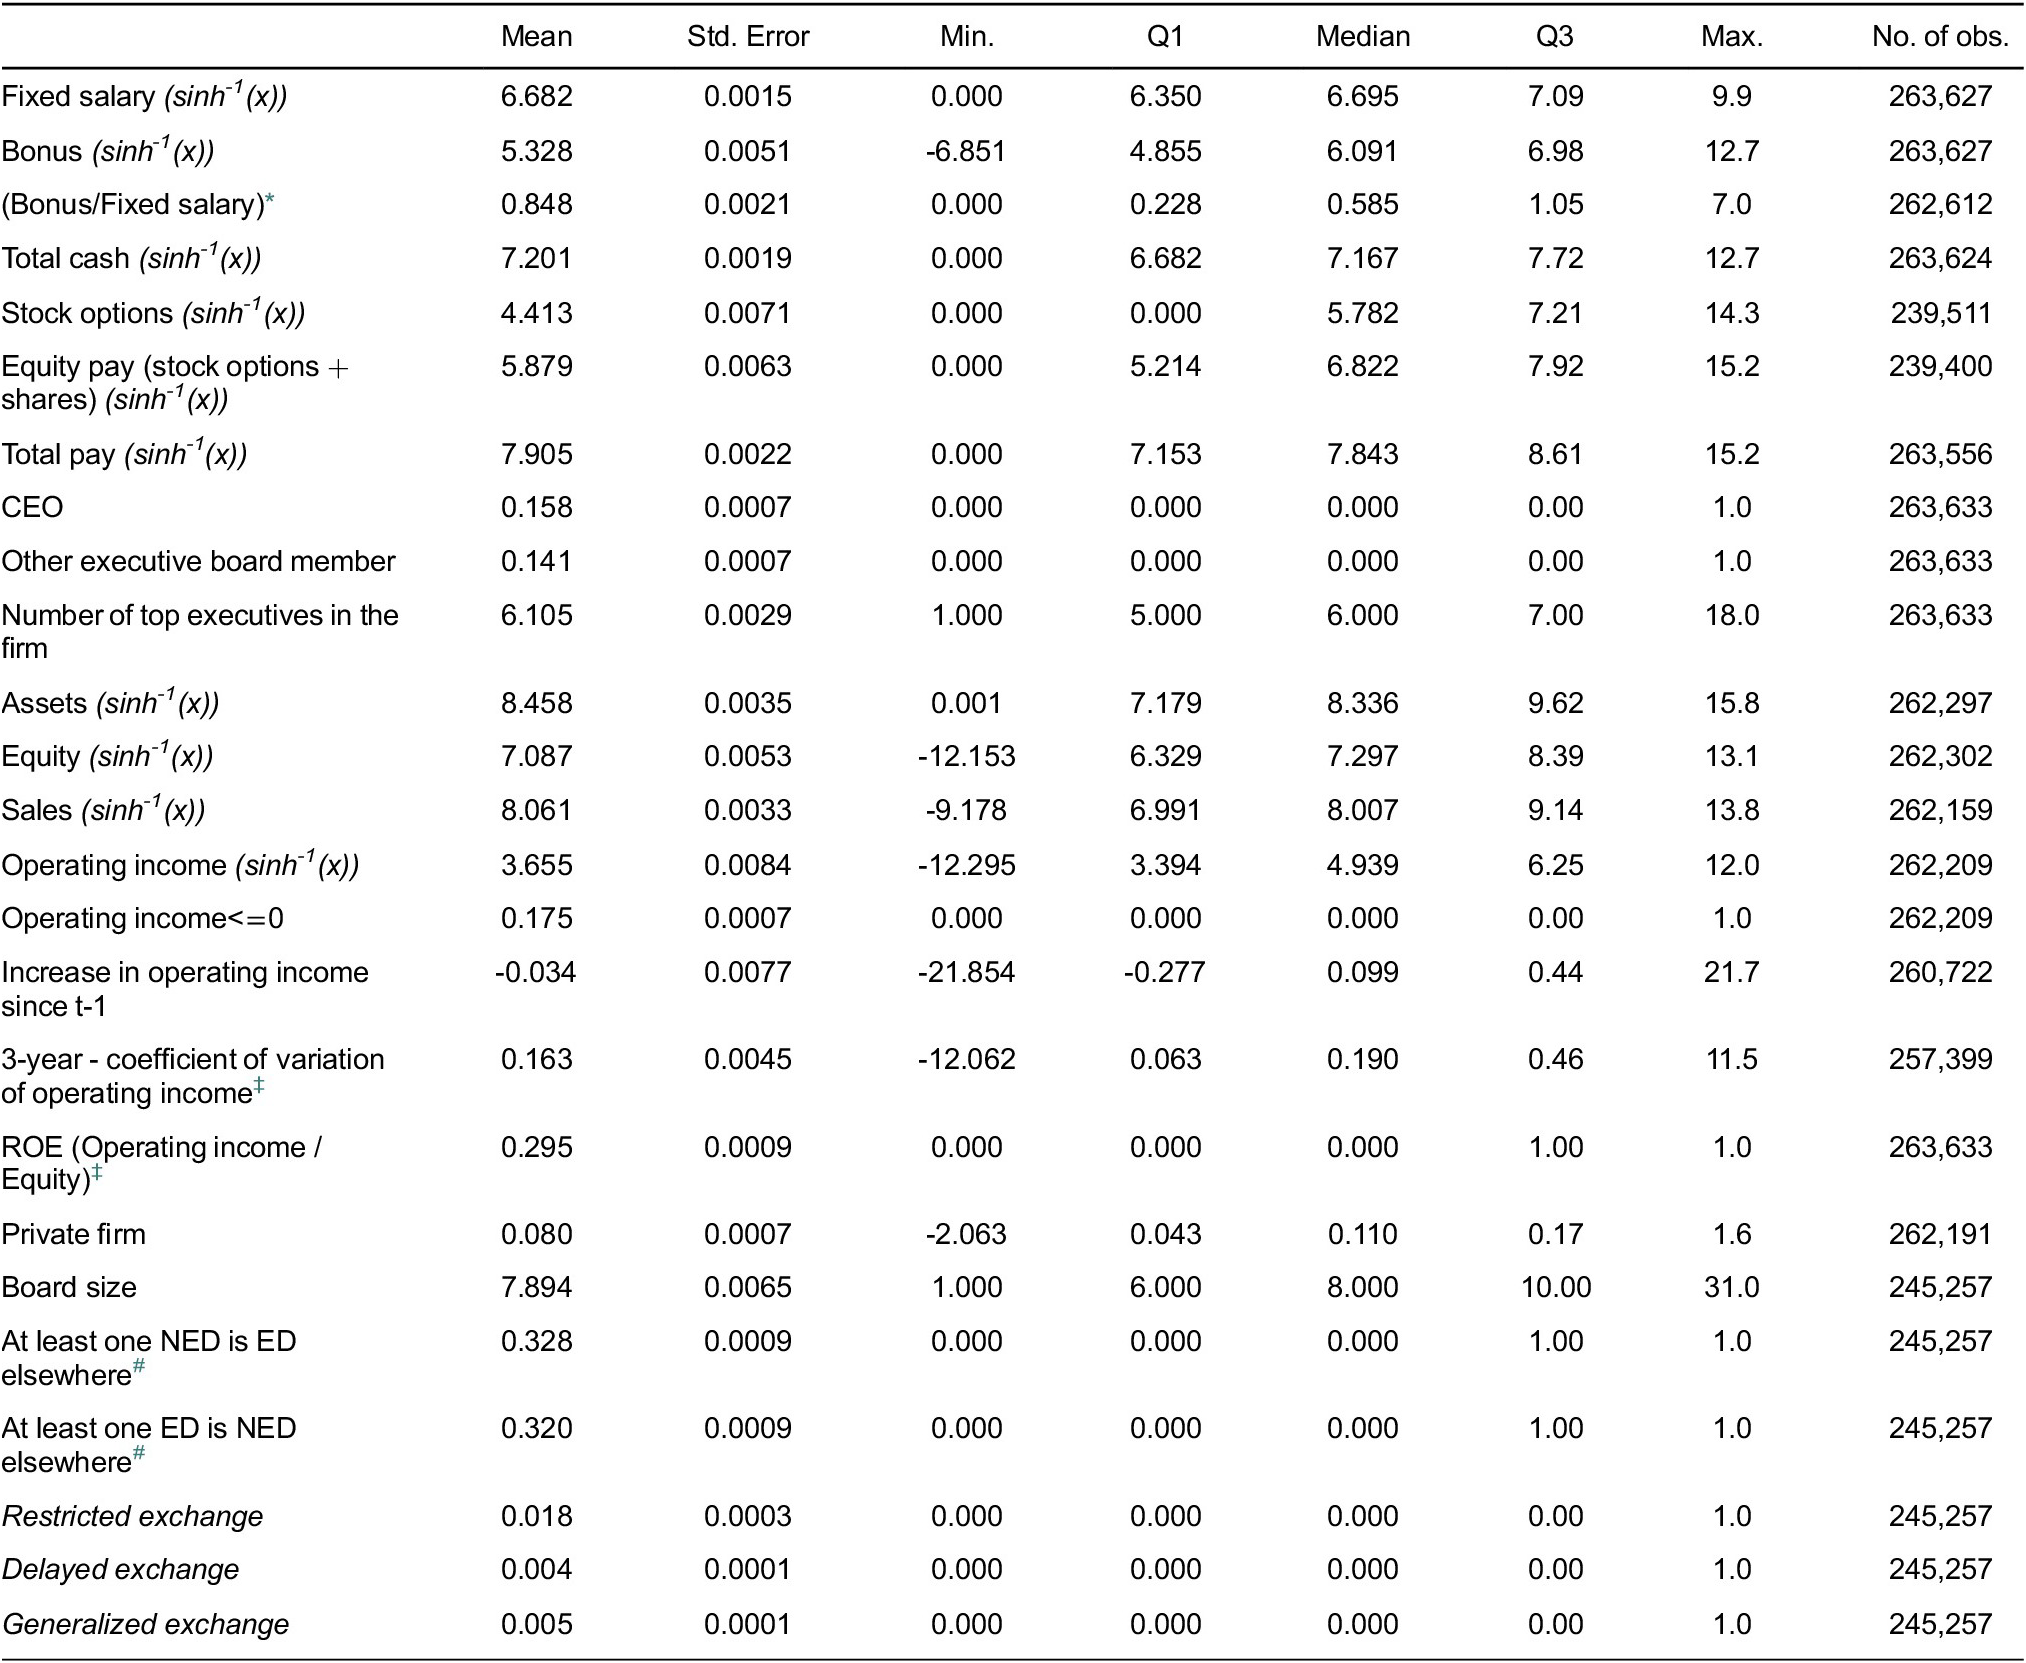
Note: For calculating “quasi-logs” of variables that can be negative or null, we use the inverse hyperbolic sine: sinh-1(x))=log(x+(x²+1)0.5).


 Open access