


Introduction
Safe water, sanitation and hygiene are important components of Public Health and adversely impacts health if any of these are compromised (Bartram & Cairncross, Reference Bartram and Cairncross2010; World Health Organization, 2014). This is very relevant in the Indian context where improving access to these components have a positive impact on the health of children under the age of five (Nandi, Megiddo, Ashok, Verma, & Laxminarayan, Reference Nandi, Megiddo, Ashok, Verma and Laxminarayan2017; Nilima et al., Reference Nilima, Kamath, Shetty, Unnikrishnan, Kaushik and Rai2018; Ramanathan & Vijayan, Reference Ramanathan and Vijayan2019). Due to the importance of these indicators, extensive details regarding water, sanitation and hygiene are often obtained in surveys to validate its responsiveness to childhood morbidities (WHO/UNICEF, 2006). Such details consist of attributes that differentiates compromise of safety in water and sanitation. As regard to water, its source and access determines the first rung of safety assessment and the measures if any taken to guaranteeing further safety like treating the water prior to its use serves as the final step in safety judgment (Shaheed, Orgill, Montgomery, Jeuland, & Brown, Reference Shaheed, Orgill, Montgomery, Jeuland and Brown2014). Similarly, the aspect of sanitation too is largely conditioned by the availability of water along with facilities of handwashing that qualifies for safe sanitary practice (Cairncross, Bartram, Cumming, & Brocklehurst, Reference Cairncross, Bartram, Cumming and Brocklehurst2010). Information obtained on these two counts consist of objective queries, observations as well as its varied options. For instance, safe water is largely conditioned not necessarily by its content and quality but the use pattern depending on its availability and accessibility. More often than not the perception of safe water may vary across regions and hence there cannot be a uniform connotation on its safety. In the state of Kerala almost 92% of the households treat the water before drinking irrespective of whether the water source is improved or not (International Institute for Population Sciences – IIPS/India and ICF, 2017b). As regard sanitation too more depends on the practice and behavior rather than the means available for the purpose. Given such complexities in defining safety, a whole range of practice aspect in these two domains are considered for their association with the outcome for the simple reason that many of them may be culturally conditioned and circumstantially effected.
Methods
The above stated exploration is made with the content of information obtained by the National Family Health Survey (NFHS-4) 2015–2016 (International Institute for Population Sciences – IIPS/India and ICF, 2017b). NFHS-4 is a nationally representative multi stage survey designed to provide estimates of vital indicators at the district, state and national level. For this analysis the key information collected by the survey such as drinking water and Hand washing in the household questionnaire and information on diarrhoeal disease in the women questionnaire. The questionnaire asks respondent about the “the main source of drinking water for household members”, observation by the data collectors on the “place where members of the household wash their hands” and the women in the households were asked if any “child under five years of age had diarrhoea in the last two weeks” (International Institute for Population Sciences – IIPS/India and ICF, 2017a). NFHS-4 defines Improved source of drinking water and handwashing similar to the WHO/UNICEF Joint Monitoring Program (JMP) indicators (WHO/UNICEF, 2006).
The household questionnaire obtains information on the treatment of water making it safe before consumption and therefore we conceptualize the “Improved source of drinking water” as households having access to improved source of drinking water and treating it before consumption. We call this variable the “safely managed drinking water”. The WHO/UNICEF JMP indicator for handwashing is the proportion of households having a handwashing facility with soap and water (WHO/UNICEF Joint Monitoring Programme (JMP) for Water Supply, Sanitation and Hygiene, 2018). Handwashing facility is defined as having a sink with tap water but can also include any device which regulates the flow of water.
Handwashing in the Indian context varies across context and is determined by the presence of water supply within the dwelling. In contexts where there is scarcity of water, handwashing may not be a priority as the water is used for basic needs. We conceptualise handwashing as the proportion of households having a source of water supply delivered to the dwelling and the presence of handwashing facility with soap and water.
Analysis was carried out considering districts as unit of observation and the aforementioned variables as defined by NFHS-4 and same variable conceptualised to suit the Indian context. It is being done at the district level as we are interested in examining the impact of safe water, sanitation and hygiene on the prevalence of diarrhoea from a policy perspective which is an ongoing work. The anomalies found during data analysing informs this communication. The outcome variable is the prevalence of diarrhoea at a district level. Correlation coefficient is computed to comment on the relationship between the outcome and the predictor variables. The aim of this exercise is not to discuss the strength of the association but to comment on the direction and the potential reasons behind it. Data was analyzed using STATA (Version 15) (StataCorp, 2018) and graphs using ggplot2 package of R statistical software (Wickham, Reference Wickham2009).
Results
We examined the relationship between prevalence of diarrhoea with improved water and hand wash as defined by the survey. Figure 1 shows that there is a positive correlation between prevalence of diarrhoea among children and two other predictor variables in both urban and rural areas across districts. What it conveys is that the prevalence of diarrhoea at district level increases with the increase in the coverage of improved water source and presence of hand washing facilities. This relationship is in contradiction of the common wisdom leading one to suspect the adequacy of attributes that defines presence of safe water and hand washing. Water, Sanitation and hygiene have been amply demonstrated to have a negative bearing on the prevalence of diarrhoea (World Health Organization, 2014) and this makes us verify the quality of information collected. In a rural context where the site for washing of clothes outside the house very well can have, the presence of water and soap that can also qualify as a place for handwashing. Similarly, households may have access to improved sources of water but this water could be stored for long and in unhygienic conditions and cannot be used as a marker for safe water. Hence qualifying safety in hand washing and water use is not that simple as it is made out to be unless stricter attributes are taken along with it for such a qualification.
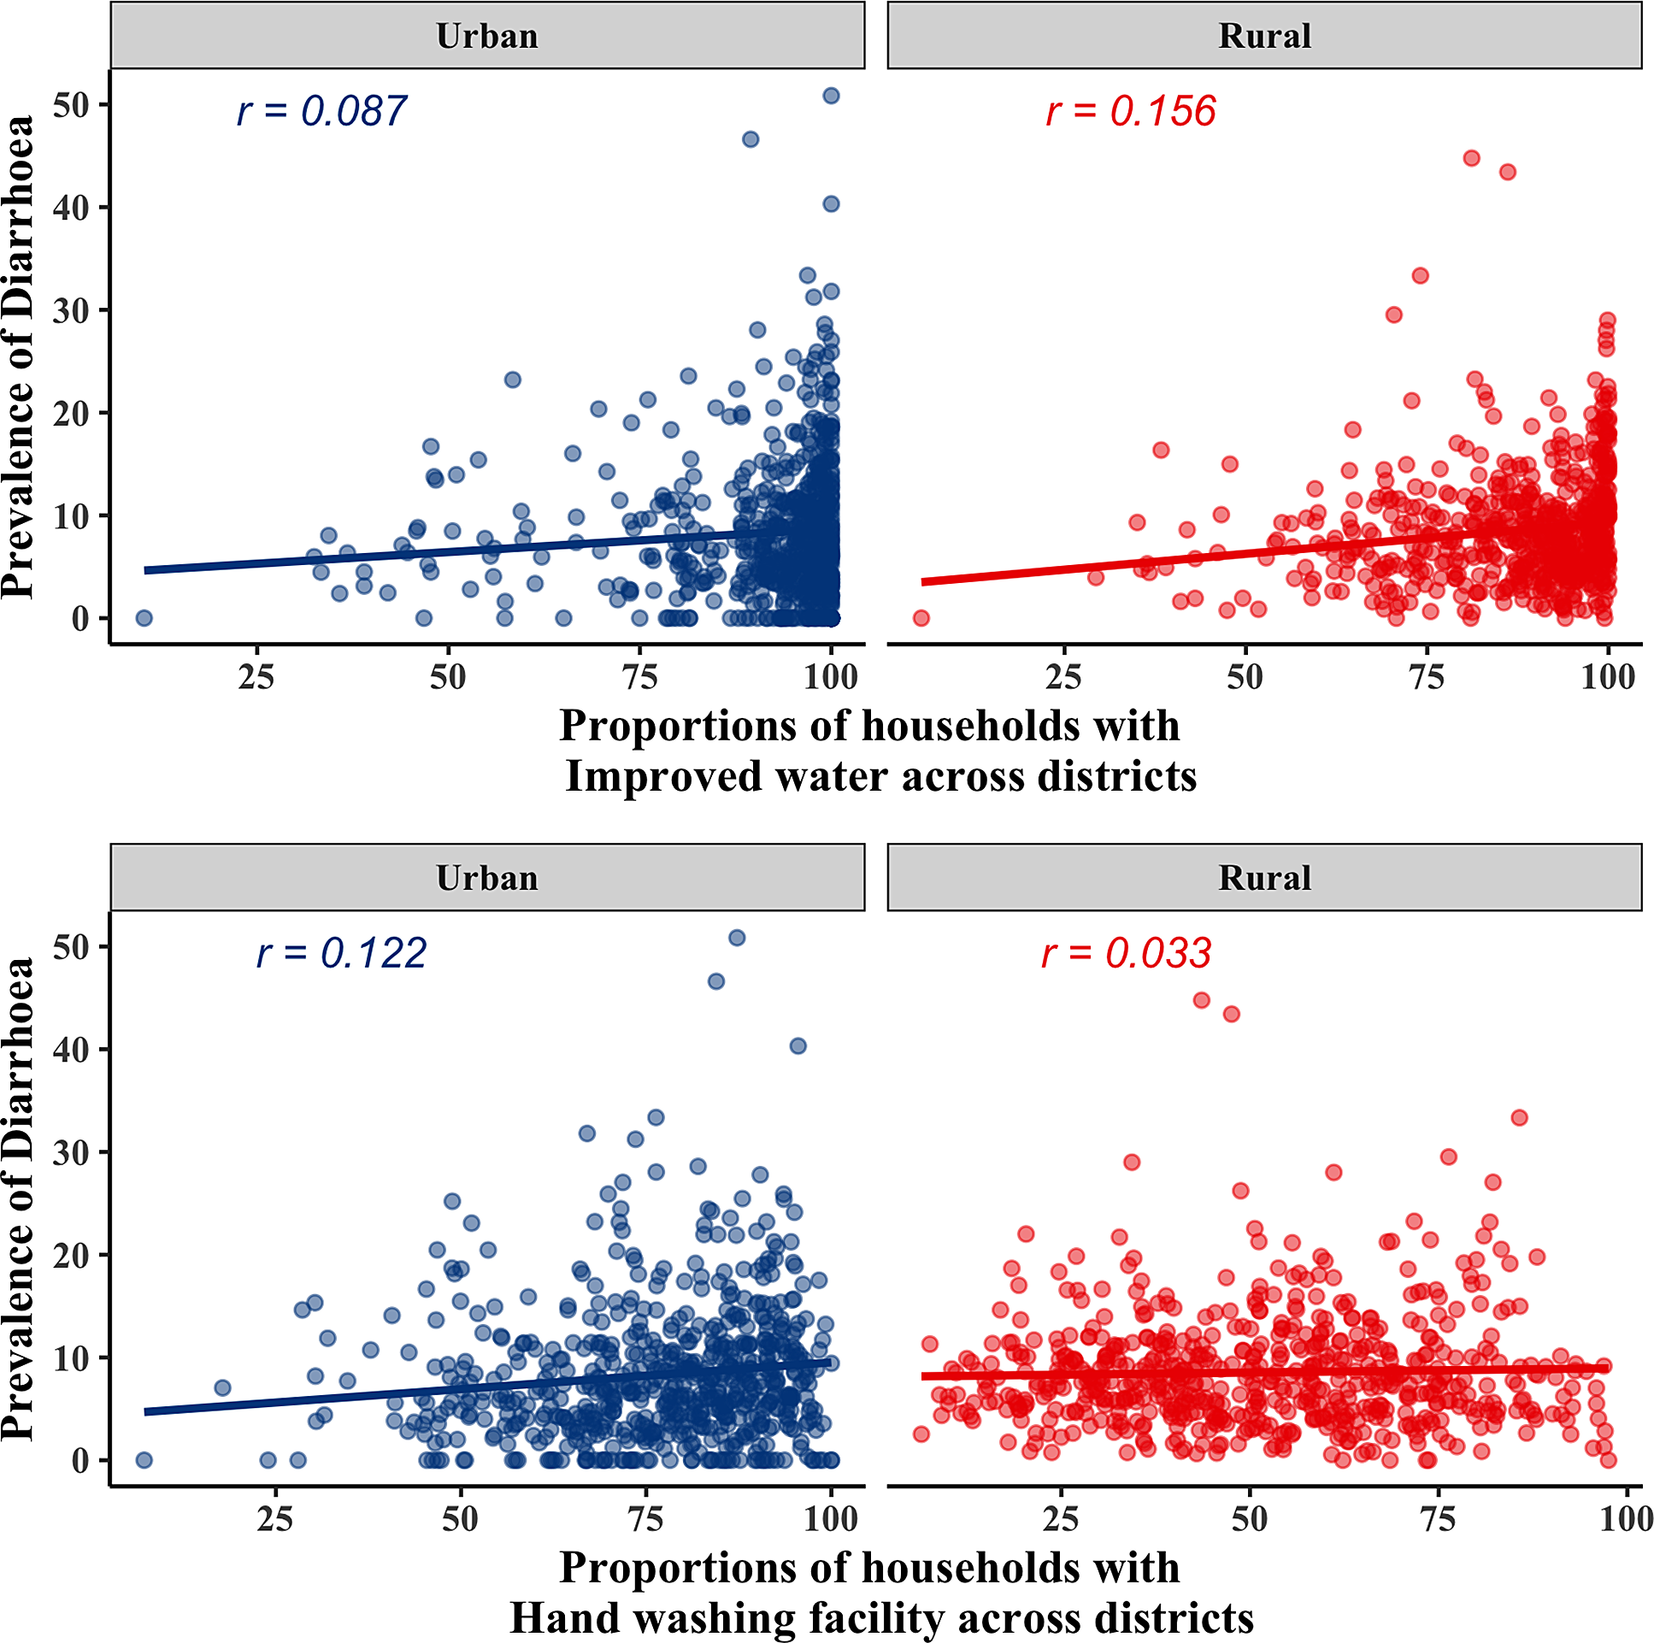
Figure 1. Relationship between prevalence of diarrhoea and improved water and hand washing facility at district level, NFHS-4, 2015–2016.
The same relationship was examined (Figure 2) with the differently conceptualised variables and a negative relationship was observed between prevalence of diarrhoea and the two variables, except with hand washing in urban areas where there is a positive relationship. This is because of the heterogeneity in the prevalence of diarrhoea at low levels of coverage of handwashing facilities. This could also be due to extreme clustering of diarrhoeal prevalence at lower levels.
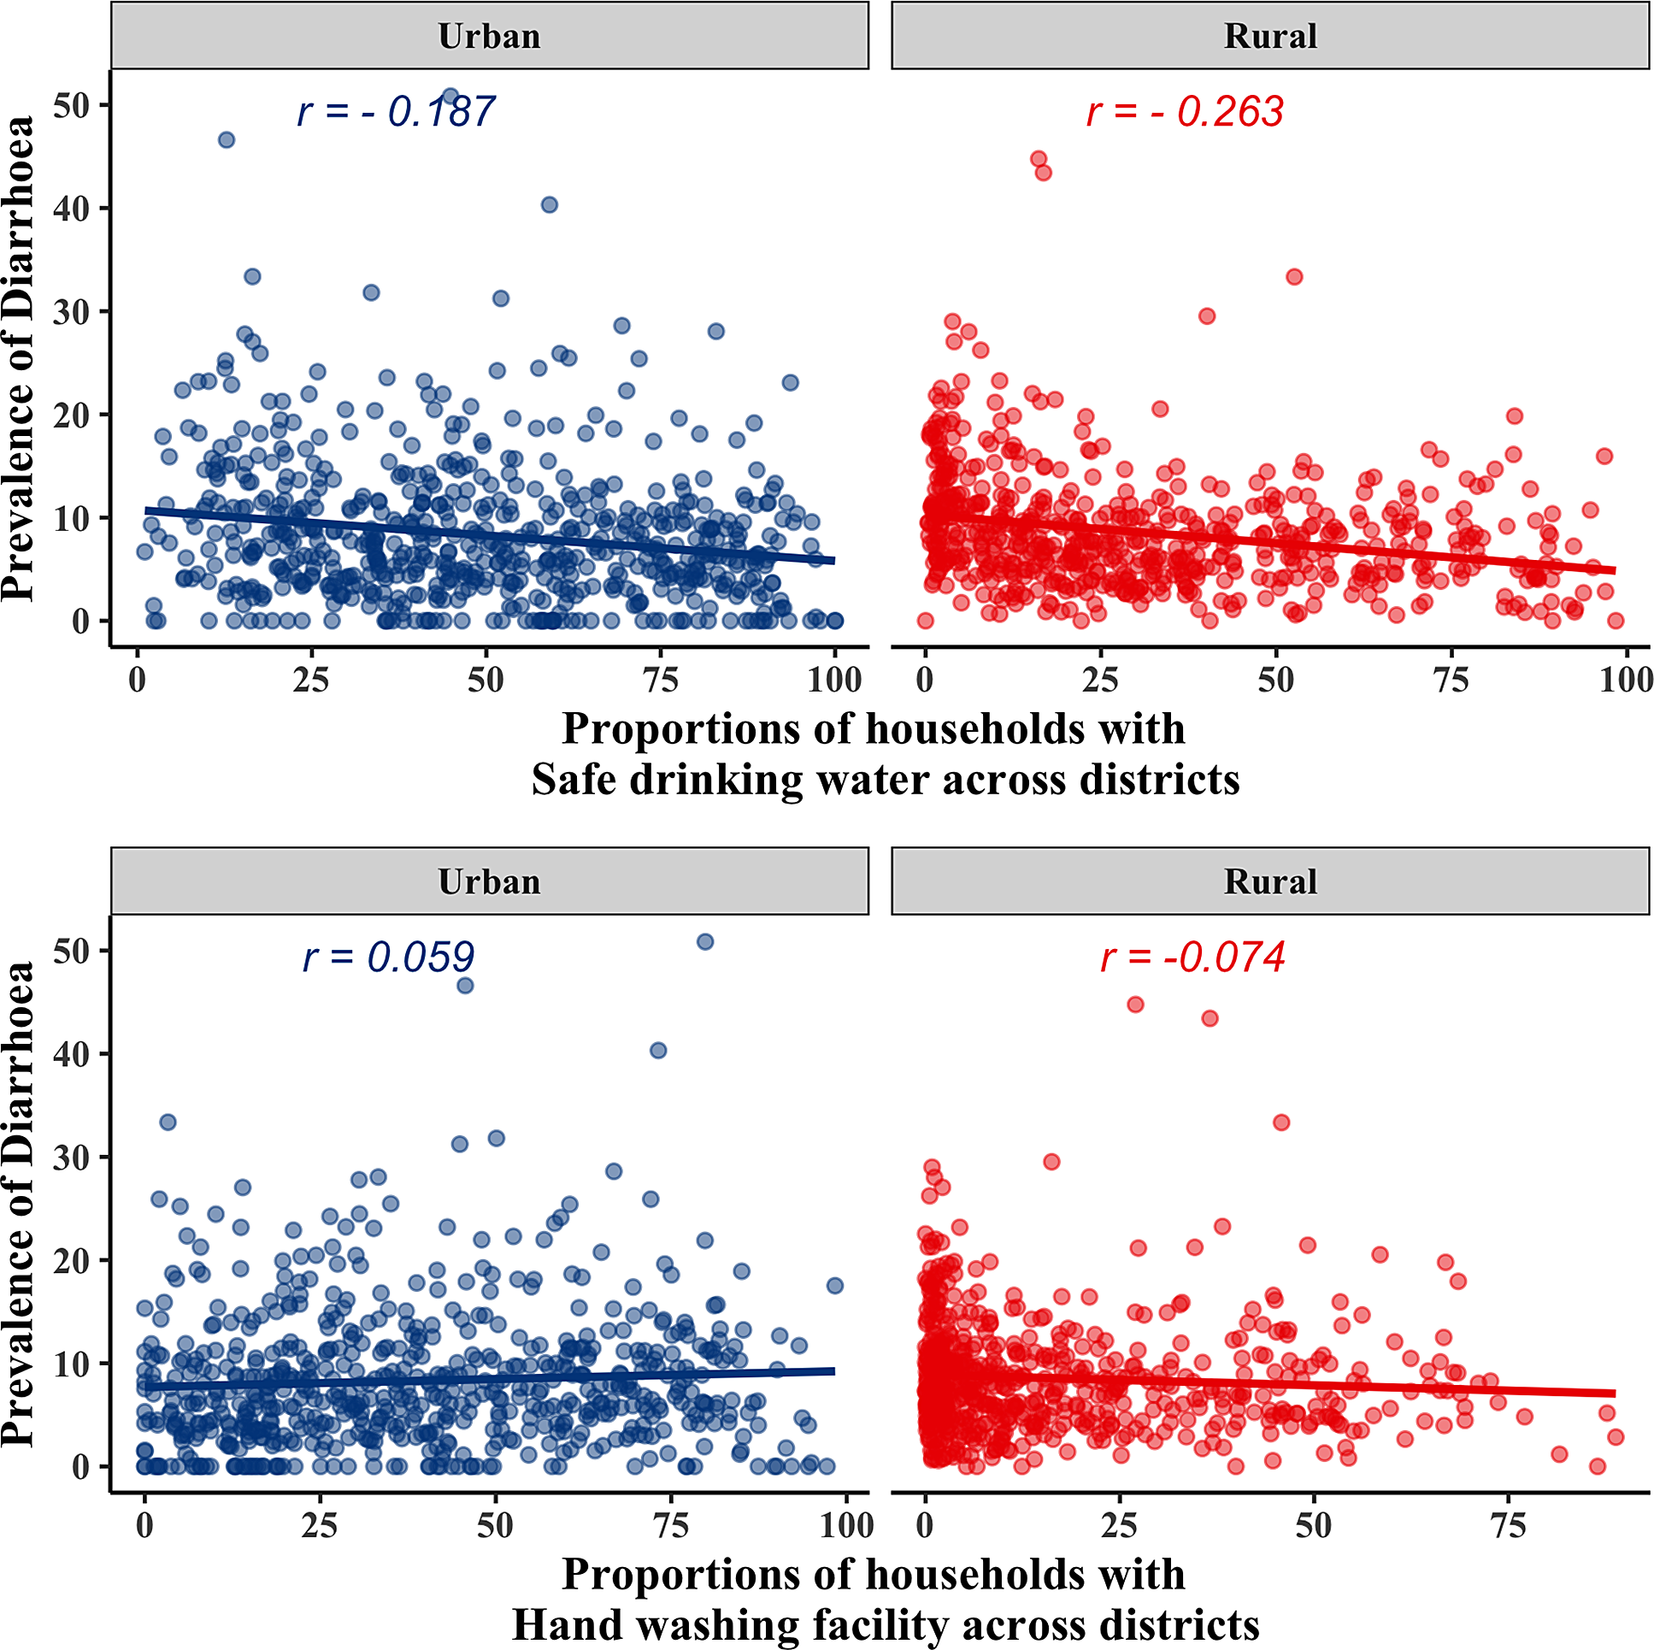
Figure 2. Relationship between prevalence of diarrhoea and conceptualized variables of safe drinking water and hand washing facility at district level, NFHS-4, 2015–2016.
In an attempt to verify the same, it is observed that with exclusion of the bottom 25 per cent and 30 percent of the observation the inverse relationship gets strengthened. Given the heterogeneity in the safe drinking water variable across districts we subjected its association with the prevalence of diarrhoea using sensitivity analysis for urban and rural areas. We used the median level of safe drinking water as a cut off to group the districts into below median and above median levels and then examined the association with prevalence of diarrhoea using Ordinary Least Squares (OLS) regression and the relationship is visualised in Figure 3. The ratio of the below median slope to the above median slope in urban areas was 1.21 when compared to 44.8 in rural areas indicating that the association is more sensitive at lower levels of safe drinking water in rural areas.
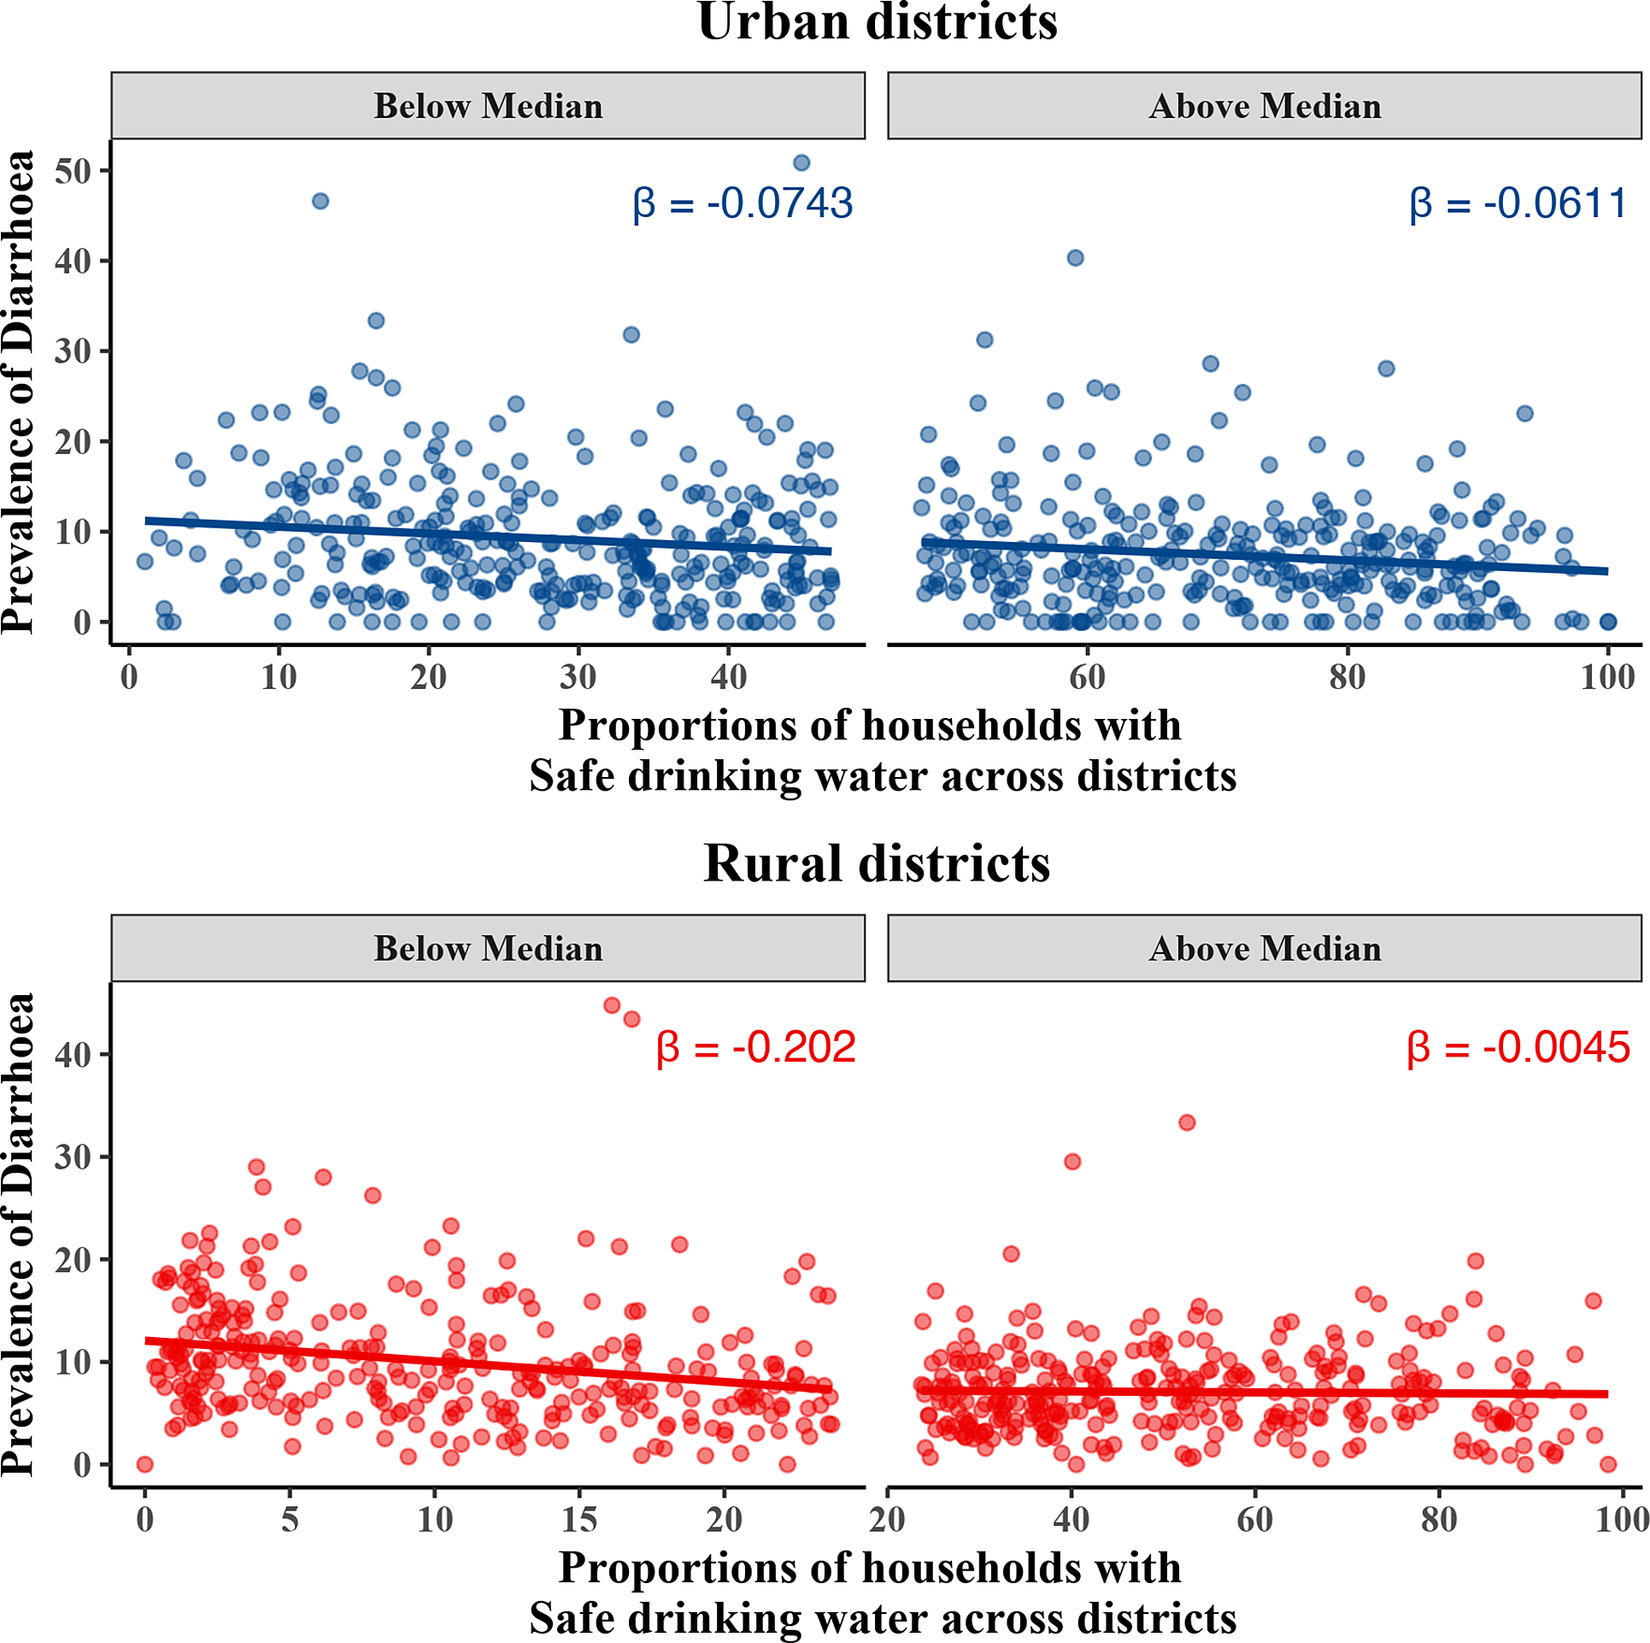
Figure 3. Sensitivity analysis of the relationship between prevalence of diarrhoea and safe drinking water at a district level, NFHS-4, 2015–2016
Discussion
One of the possible reasons behind the revealed contradictions could be that the questions or the observations being made in the survey discount specificity of contexts in defining safety. The JMP defines the levels for sanitation, drinking water and hand hygiene and the measurement indicators to enable their comparability across nations. The NFHS-4 too adopts these measures for estimates in their reports. Use of these measures in an Indian context does not seem to offer reliable patterns of association with relevant outcomes. The purpose of asking about the source of drinking water is to assess its cleanliness (International Institute for Population Sciences, 2014). Households having access to an improved source of water supply need not necessarily connote the use of safe water. The way water is stored and treated also plays a part in determining its safety. The definition of safe drinking water needs to be re-calibrated to account for the potential impact on health, particularly the health of vulnerable children.
In the instruction manual for data collectors for NFHS-4 they are required to ask the respondent “to show where the members of the household wash their hands”. If the location is observed then the presence of water or any detergent is also noted (International Institute for Population Sciences, 2014). The problem with this instruction is that it does not specify the instructor to look for any sink or device to regulate the flow of water as described by JMP. In such circumstances areas in the household used for washing clothes or vessels can be labelled as the facility for handwashing. One way to eliminate such potential errors is to be explicit about the purpose for collecting information on WASH indicators and ensuring that they unambiguously represent hand hygiene with respect to sanitation. However, this study is not without limitations. The analysis was carried out at a district level and there is a potential for ecological fallacy i.e. findings at the district level may not hold true at an individual level and vice versa. The degree of association has been demonstrated using correlation coefficients and this does not necessarily indicate causation.
Conclusion
Based on the exploration made by us it is evident that there remains a fallacy in collection of information in terms of their content, execution and reporting by the respondents. Often comparability of such information across various settings may not be worth the effort. A thought needs to be spared on collection of such information given its scientific potential for exploration and verification.
Author Contributions
BV and UM conceived and designed the study. BV performed statistical analysis which was verified by UM. Both BV and UM drafted the paper.
Funding Information
This research received no specific grant from any funding agency, commercial or not-for-profit sectors.
Data Availability Statements
The National Family and Health Survey- 4 (NFHS-4) data is available in the following link: https://dhsprogram.com/data/available-datasets.cfm. The data can be accessed by registering on the portal by stating the purpose of its intended use.
Conflict of Interest
Conflicts of Interest: Author BV and Author UM declare none.


 Open access
Comments
Comments to the Author: This is an interesting manuscript. We may get more insight if analyses is carried out for tape water, well water, bore well and others. The correlation matrix of each of these with diarrhoea prevalence may be presented. Also, multivariate analyses may be added advantages as it controlled for other factors.