General elections can be predicted well in advance because most people decide how to vote using a combination of partisan attachment—typically acquired early in life—and reflection on the “nature of the times” (Campbell et al. 1960). As Achen and Bartels (2016, 267) argued, “The primary sources of partisan loyalties and voting behavior…are social identities, group attachments and myopic retrospections, not policy preferences or ideological principles.” However, in congressional and presidential primaries, this process works differently. Voters choose between two or more candidates who all bear the same partisan label. Making distinctions among the minutia of policies in which these candidates disagree can be difficult, even for the most sophisticated voter. Most primary voters, therefore, must figure out who to support without the shortcuts provided by the partisan brand (Zaller Reference Zaller1992). Thus, an “insurgent” candidate occasionally comes along and unseats a well-known and possibly well-loved incumbent or the party’s presumptive nominee.
In the 2016 election, the United States experienced insurgent candidacies in both party primaries from Donald Trump and Bernie Sanders. In other countries that have multiparty systems, both might have run under a different party label. However, in the United States, third parties face barriers to running for public office, particularly the presidency. Because the primaries are open to a public vote, would-be third-party candidates can run strategically under major party labels.
We consider Trump and Sanders as insurgent candidates because they were (1) only nominal members of the parties with which they ran but, more important, because (2) their candidacies were not welcomed by the party establishment. Sanders has held elective office since 1991 as an Independent. Although he has caucused with Democrats, he has always made clear to both his home state and the national media that he is not a member of the Democratic Party. To run as a Democrat, he nominally switched his party affiliation only three months before the New Hampshire primary—and then switched it back within 24 hours of losing the nomination (Nicholas Reference Nicholas2016). Trump’s partisan affiliation has changed at least five times (Chasmar Reference Chasmar2015) and his positions on major policy issues also have changed multiple times during the course of his career (Krieg Reference Krieg2016). Although he has been a member of the Republican Party since 2012, Trump made a name for himself running against it while in it; he attacked almost every member of the Republican Party during his electoral campaign (Graham Reference Graham2016). Despite this, running as a Democrat and Republican, respectively, both candidates won a significant share of the primary vote. Trump won enough to gain the nomination. Although falling short of the nomination, Sanders won the primaries or caucuses of 23 states and gained 43% of the Democratic primary vote.
What explains support for insurgent candidates? The mainstream media characterized the Sanders candidacy as a challenge from the left and Trump’s support as generating from the right. However, the idea that voters can match their ideological beliefs to the positions of primary candidates also seems to flout much of what we know about American political behavior.
What explains support for insurgent candidates? The mainstream media characterized the Sanders candidacy as a challenge from the left and Trump’s support as generating from the right. However, the idea that voters can match their ideological beliefs to the positions of primary candidates also seems to flout much of what we know about American political behavior. Indeed, there is significant evidence that primary voters are not more ideologically extreme than the general electorate (Abramowitz Reference Abramowitz2008; Norrander Reference Norrander1989). We propose that these candidates’ bases of support originate from dissatisfaction with the current political establishment. Trust in government has been declining since the 1970s: recently, approval of typical indicators of US government including Congress, the office of the president, and even the Supreme Court has been at an all-time low (McCarthy Reference McCarthy2014).
Our research question is relatively simple, considering the complexities of the 2016 election: Did distrust in government predict support for the insurgent candidacies of Donald Trump and Bernie Sanders? It certainly could be the case that ideology drove support for them. Far right Republicans and Independents concerned about the willingness of the Republican Party establishment to compromise with Democrats may have backed an outsider because Trump was more conservative than those who voted for other Republican Party candidates. Likewise, left wing Democrats and Independents may have voted for Sanders because they had lost faith in the ability of Hillary Clinton to bring about liberal policies. This article contributes to this debate.
We examine intraparty support for Trump and Sanders using two surveys: (1) a random sample of New Hampshire registered voters taken a week before the 2016 first-in-the-nation primary election; and (2) a national survey of American adults fielded in June. We propose that distrust in government is a powerful motivator in choosing antiestablishment insurgent candidates and demonstrate that this effect was a larger factor than ideology in explaining primary support for Trump and Sanders.
TRUST IN GOVERNMENT AND CANDIDATE SUPPORT
Trust in government has been decreasing steadily in the past 40 years. The percentage of those who say that they trust the federal government always or most of the time to “do what’s right” was around 20% during most of the Obama administration.Footnote 1 So, what is trust in government? Whereas trust is partially connected to attitudes about the incumbent administration at any given point in time, it also reflects attitudes about the functional competence of government. That is, it is not only about whether government is doing a good job but also are those in government capable of doing the apolitical tasks assigned to them?
There already is credible evidence that trust is a powerful predictor of voting behavior in some electoral contests. For instance, distrusters are more likely to support third-party candidates (Hetherington Reference Hetherington2005; Peterson and Wrighton 1998) and to hold anti-tax- and spending-policy positions—even when those positions are inconsistent with party identification or ideology (Hetherington Reference Hetherington2005). Distrust also has been shown to be a powerful and independent predictor of voting in ballot-measure elections: distrust fuels votes against the ruling order in favor of electoral reform and against increases in taxes or spending (Dyck Reference Dyck2012). This is an important corollary because whereas ballot-measure campaigns often are fiercely ideological, they—like primary elections—also lack easy partisan cues on the ballot.
It also is no coincidence that levels of trust in government declined while elite polarization in Washington was growing. The two trends, in fact, are connected. One of the emerging stories in recent decades is the inactivity and rancor in Washington. In the early 1990s, scholars noted that Congress had become a more personally contentious institution (Uslaner Reference Uslaner1993). In 1994, President Bill Clinton and the newly emboldened Republican Congress disagreed over the budget, leading to a government shutdown in 1995. However, the fierce polarization within the institution was only beginning. The chamber has polarized further since the 1990s (McCarty, Poole, and Rosenthal 2016; McTague and Pearson-Merkowitz Reference McTague and Pearson-Merkowitz2013). Fewer moderates and deal makers exist within both parties, and the notion of bipartisan cooperation has become a reason to oust conservative leaders (e.g., John Boehner) from their positions. To be sure, there is evidence that the public also has polarized. However, there also is considerable evidence to suggest that voters (1) are more moderate than elected members of Congress; and (2) find the level of gridlock and dissension between the parties disagreeable (see especially Hibbing and Theiss-Morse Reference Hibbing and Theiss-Morse1998; Reference Hibbing and Theiss-Morse2002).
Hibbing and Theiss-Morse (Reference Hibbing and Theiss-Morse2002) argued specifically that it is process space (i.e., attitudes about how government works) and not policy space (i.e., attitudes about actual policies) that structures much of the public evaluation of government. Therefore, prolonged political gridlock and elite polarization would result in support for outsider candidates from those who have the most negative process evaluations in both parties. This opens the door for insurgent candidates who effectively run against government, against the political parties, against Congress, and against Washington. Even positive campaigns like Barack Obama’s historic 2008 campaign emphasized taking government out of the hands of special interests and giving it back to the people. Candidates thus have a choice: market themselves as ideological outsiders or as only Washington and political-party outsiders. Our argument is that support for the two insurgent candidates of 2016 is correlated more with distrust and satisfaction with government and the status quo than with any clear ideological divergence from the party establishment.
Our argument is that support for the two insurgent candidates of 2016 is correlated more with distrust and satisfaction with government and the status quo than with any clear ideological divergence from the party establishment.
HYPOTHESIS AND RESEARCH DESIGN
We hypothesize that distrust in government led voters to support Bernie Sanders and Donald Trump in the 2016 primary. We test this hypothesis using two surveys. The first comes from a 10-day tracking poll completed in New Hampshire between January 29 and February 7, 2016. The dataset has a high degree of external validity; the weighted estimate is 61% for Sanders and 39% for Trump among likely voters in the Democratic and Republican parties, respectively.Footnote 2 Because New Hampshire voters often buck national trends in primaries, and there might be something unique about this electorate that makes generalizing more difficult, we also validate these results with a national survey of American adults conducted in June of 2016. Both datasets contain the question “how much of the time do you think you can trust the federal government in Washington, DC to do what’s right?” We use the answers to this question, coded into a three-point scale, as our chief explanatory variable of interest.
The dependent variables in the New Hampshire data are simple dummy variables of vote intention coded 1 for votes for Trump and Sanders, respectively.Footnote 3 On the Democratic side, a few voters were uncertain or indicated that they intended to vote for Martin O’Malley. Whether we include them in the 0 category or exclude them as missing cases does not alter the results presented. On the Republican side, the modeling decisions are more complex given the number of candidates on the ballot. Our preferred model is a simple logit presentation of voting for Trump versus voting for another possible candidate. Given our sample size, the subgroup standard errors for the candidates are quite high and it became difficult to know how to classify “establishment” and “outsider” candidates. For instance, we are fairly certain that Ben Carson was an “outsider” candidate, but what about Ted Cruz? He was a sitting senator but ran his campaign like an outsider and had spent much of the past eight years challenging the Republican Party. By placing candidates who also may be outsiders and thus likely to gain votes from distrust for Trump, we are increasing the difficulty of finding any statistically significant results and therefore bias the results against finding evidence in favor of our hypothesis.
The dependent variable and modeling approach in our national data is slightly different. When the survey was fielded in June 2016, Donald Trump was already the presumptive Republican nominee and most accounts suggested that Hillary Clinton would be the Democratic nominee. Therefore, a vote-choice question was not included in the survey. However, the survey did ask respondents to rate Trump and Clinton along with Sanders, Rubio, and Cruz on a 100-point “feeling thermometer,” which we use as a proxy for vote choice under the assumption that respondents are likely to vote for the candidate toward whom they feel the “warmest.” We construct a variable measuring relative candidate evaluations by subtracting the average ratings of Trump and Sanders from those of other candidates. This estimation strategy has two advantages: (1) it measures relative difference in support instead of raw scores (Wilcox, Sigelman, and Cook Reference Wilcox, Sigelman and Cook1989); and (2) it more closely mirrors the choice that voters must make in choosing a candidate for whom to vote. Our dependent variables in the national model are: Sanders rating-Clinton rating and Trump rating-(average of Cruz and Rubio ratings). Positive numbers indicate greater support for the insurgent candidacies of both Sanders and Trump.
Both models (i.e., New Hampshire and national data) also include a measure of political ideology (i.e., liberal, moderate, and conservative) along with a dummy variable for whether the individual is registered (i.e., New Hampshire) or identifies as a partisan or an Independent (i.e., national).Footnote 4 New Hampshire uses an open primary system in which Independents can vote in either primary; however, party registrants must vote within their own party’s primary. Control variables are included for income, education, gender, race, age, and frequency of church attendance. Survey weights are accounted for in all models.
RESULTS
We begin with the results for New Hampshire shown in table 1. The logit estimations, along with marginal-effect probability changes, are presented in models 1 and 2 for Republicans and Democrats, respectively. Looking first at Trump support, those who trust the government at lower rates are more likely to support him compared to other candidates. The beta coefficient on trust is significantly larger than any other statistically significant variable. Notably, ideology does not come close to reaching standard levels of statistical significance.
Table 1 Voting for Trump and Sanders (0,1) in the 2016 New Hampshire Primary
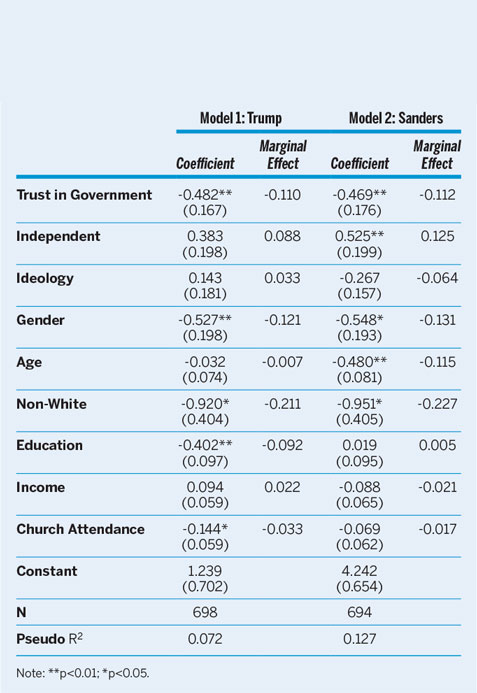
Note: **p<0.01; *p<0.05.
Figures 1a and 1b provide a sense of the magnitude of the effect of trust and ideology on support for Trump. The differences between the probability of voting for Trump among moderates and conservatives is unremarkable. However, a distruster is more than 20 percentage points more likely to support Trump than any other Republican candidate.

Looking at support for Sanders, we also find evidence for our hypothesis. The five statistically significant variables predicting support for Sanders are gender, age, race, party identification, and trust in government. Notably, ideology also is not significant at the p<0.05 level. It is important that in the Sanders model, there is a significant effect for Independents, who are 12 percentage points more likely to support him. However, as we demonstrate in figures 2a and 2b, the effect of distrust is again a considerably more powerful predictor of support for Sanders than ideology. The difference between trusters and distrusters is about 20 percentage points. In one respect, the Sanders finding provides stronger verification of our hypothesis, given the widespread belief that he was an ideologically extreme candidate compared to the competition.

For both models, we also investigated the extent to which alternative choices of modeling affected our results and found little differentiation between estimation strategies. Results of alternative models are in the online supplementary appendix.Footnote 5
Although the New Hampshire finding is interesting, we might wonder if this result is generalizable to the national electorate, given that registered voters in New Hampshire are exposed to an inordinate amount of campaign activity. To test this, results of our analysis of a national sample are shown in table 2.
Table 2 Relative Feeling-Thermometer Ratings for Trump and Sanders, June 2016
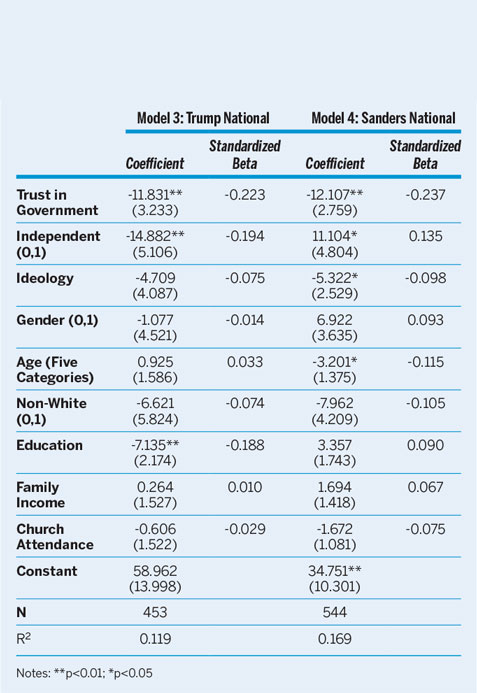
Notes: **p<0.01; *p<0.05
The models from the national data are regression models with Huber-White heteroskedastic-consistent robust standard errors; in practical terms, this makes them easier to interpret than the logit models from the New Hampshire data. In addition to the actual regression models and standardized beta coefficients, figures 3 and 4 include the predicted values of the model at varying levels of trust and ideology.
Column 1 includes results of the model predicting Trump’s relative feeling-thermometer ratings between Republicans and Independents (compared to Rubio and Cruz). Only three variables in the model are statistically significant at p<0.05: education, party identification, and trust. The two largest effects (as measured by the standardized beta) are trust in government and education; those with higher levels of education and trust both rate Trump lower compared to the Rubio/Cruz average. Independents rate Trump lower vis-à-vis Cruz and Rubio, a finding not supported in the New Hampshire model. This may be because we measure partisanship differently in the two models (i.e., party registration in New Hampshire and party identification with the national data).
Again, the effect of trust in government on support for Trump is not only statistically significant but also substantively large. On average, distrusters rate Trump about 15 points higher than the Rubio/Cruz average, whereas trusters rate Trump more than 8 points lower than the Rubio/Cruz average—a difference in ratings of 23 points. Moreover, ideology is not statistically significant in the model, and the difference between conservative and moderates is negligible.
The effect is similarly interesting and impressive on the Democratic side. To be sure, there are more significant predictors in the Democratic model. Independents, young respondents, and liberals rate Sanders higher than Clinton. Gender, race, and education fall just short of standard levels of statistical significance. Trust in government, as measured by the standardized beta coefficient, is by far the largest effect in the model. The substantive effect is depicted in figure 4b and contrasted with the effect of ideology in figure 4a. On average, distrusters tend to rate Sanders almost 14 points higher than Clinton, whereas trusters rate Clinton almost 11 points higher—a difference of 25 points on the 100-point scale between trusters and distrusters.
Looking at all four models, distrust consistently is the most important factor driving the intraparty choice between candidates for both Bernie Sanders and Donald Trump in 2016.Footnote 6
CONCLUSION
Why do voters support insurgent candidates who do not have a proven track record of ably navigating the system and achieving results for their constituents? By all accounts, leaders of the two parties and “establishment candidates” should be what voters want. They are the most effective at getting things done because they have the relationships to help them navigate a fractured system. Yet, there seems to be an increasing amount of support for insurgent candidates, especially as witnessed in the 2016 election cycle.
The popular understanding of support for insurgents and the role of the primaries in effecting the system is that primary voters are driven by their relatively extreme ideological positions. However, given how much information is necessary to participate in primaries and caucuses, the average primary voter is unlikely to fully understand the minutia of differences among candidates running for a nomination. Instead, we demonstrate that, at least in the case of the Trump and Sanders campaigns, support for these candidates was largely a product of underlying distrust in government.
SUPPLEMENTARY MATERIAL
To view supplementary material for this article, please visit https://doi.org/10.1017/S1049096517002505
ACKNOWLEDGMENTS
This research was supported by the Center for Public Opinion and the Office of the Provost, University of Massachusetts, Lowell (www.uml.edu/polls). A previous version of this article was presented at the 16th Annual State Politics and Policy Conference, in Dallas, Texas, May 19–21, 2016. We appreciate the feedback offered by Seth McKee, Kevin Banda, and anonymous reviewers. We extend special thanks to Frank Talty and Andy Hiller, who contributed to the genesis of this article through many conversations about the 2016 primary elections.