


Pundits, politicians, and reformers often cite legislative polarization as a significant problem undermining the functioning of government at the state and national levels, and many have urged reforms to directly address it. They offer a wide range of explanations for the sources of this legislative polarization. However, those diagnosing the causes rarely provide much evidence in support of their claims, and what little evidence is offered almost always focuses exclusively on the US Congress.
This is regrettable for a number of reasons. First, there is substantially more variance in the political constraints on the 99 state legislatures and the reforms aimed at them than there is on only one Congress, giving researchers significantly more investigative power in understanding how to affect legislative behavior. Second, given the current state of congressional gridlock (which is related to but not synonymous with polarization), substantially more lawmaking is occurring at the state level, making the potential for reform at that level far more consequential.
This article takes advantage of new measures of legislative partisanship in the states to test various folk theories about the causes and consequences of partisan polarization. I draw on state-legislative polarization measures reported by Shor and McCarty’s ideal-point–collection project (Shor Reference Shor2018) aggregated at the state-chamber level in 2016 to investigate some of these purported sources of division. Their data collection calculates ideal points from the recorded roll-call votes of all state legislators in all 99 state-legislative chambers in the past two decades. The authors used questionnaires administered by Project Vote Smart to act as a bridge across states and years so that all legislators were in a common space.
The results suggested little support for conventional folk theories about legislative polarization. I found no evidence to support claims that party spending, legislative professionalism, chamber size, gerrymandering, or primary-election rules are responsible for the rise in state-legislative polarization, which suggests that associated reforms would be unlikely to mitigate division. Indeed, there are no easy solutions to legislative polarization. New research, however, suggests that modern legislative polarization is largely attributable to economic inequality, distribution of voter public opinion, and decline in local media. Efforts to mitigate polarization that do not address these causes are not likely to be successful.
TRACKING STATE-LEGISLATIVE POLARIZATION
Several individual state-legislative time-series studies (e.g., Masket Reference Masket2009) showed a rise in party polarization at the state level in recent decades. A major contribution of the Shor–McCarty project was to show that this is occurring in nearly all the states during this same period. A main indicator that they used to measure state-chamber polarization is the difference in the median ideal points across the major parties within that chamber. Figure 1 shows the median polarization score for upper and lower chambers across the 50 states between 1996 and 2016. As clearly shown in the figure, polarization has proceeded apace at the state level, mirroring national-level trends during the same period.

Figure 1 Median State-Legislative Polarization by Chamber, 1996–2016
Notes: Plot relies on the “_diffs” measure of the difference between the two major parties’ median ideal points. This plot takes the median state measure for each year in each chamber.
This polarization, however, is not uniform. As Shor (Reference Shor2017) noted in a related research paper, the majority of the 99 state legislatures polarized in the past two decades, with the trend accelerating in 2010. However, 14 chambers have seen polarization hold steady during this time, whereas six actually became less polarized. This latter group included the state senates of New Hampshire, Connecticut, Kentucky, North Carolina, and North Dakota and the Hawaii House of Representatives. State legislatures provide important variance: unlike for Congress, we can observe chambers that are polarizing and those that are depolarizing. But what is driving this?
This article examines various potential causes of this polarization mentioned by reformers—party spending, chamber professionalization, chamber size, gerrymandering, and primary-election rules—and discusses their effects on lower-chamber polarization.
Party Spending
One cause that reformers have worked on for decades is limits on party spending. Senator John McCain and others viewed massive party spending on campaigns as a source of increasing polarization; this fueled support for the Bipartisan Campaign Reform Act of 2002 to limit party spending and theoretically undercut partisanship. Several states imposed similar limits in recent decades, operating under the belief that parties giving to candidates make those candidates more beholden to their parties and thus more inclined to vote the party line. Advocates of Colorado’s Amendment 27, which sharply limited donations to parties and parties’ donations to candidates, promised that the initiative would “reduce the impact of special interests on the political process and increase the influence of individual citizens” (Legislative Council of the Colorado General Assembly 2002). Party leaders there were concerned that they would need to close their doors within a few months of passage. Limiting what parties could give, the theory goes, would free up candidates from some of their partisan obligations.
State limits on party-to-candidate donations vary wildly, from Maine’s very low $375 to Illinois’ $80,900 in 2016.Footnote 1 Twenty-two states have no limits at all. Figure 2 charts the relationship between a measure of state-legislative polarization—that is, the mean difference in ideal points in the lower chamber—against the party-to-candidate donation limits in states that have these limits. Because these figures are highly clustered toward the lower end, I logged this variable.
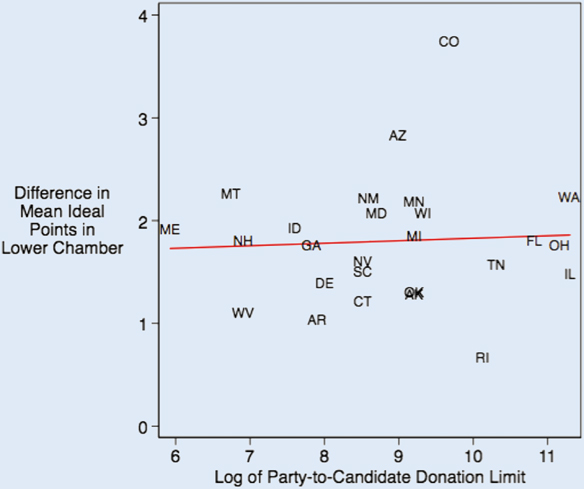
Figure 2 Legislative Polarization as a Function of State Donation Limits by Parties to Candidates
As shown in figure 2, there is no relationship at all. States with high limits are as similarly polarized as those with low limits. Indeed, the most and least polarized states—Colorado and Rhode Island, respectively—have almost identical party-to-candidate contribution limits. Further analysis suggests that there is little difference between the polarization levels of states with donation limits and those without: states without limits have a 1.65-point difference and those with limits have a 1.80-point difference. That is, those states with donation limits are slightly more polarized, although this does not approach conventional levels of statistical significance (p=0.20).
This echoes the findings of La Raja and Schaffner (2015), who demonstrated that states that have imposed limits on what parties can contribute to candidates have seen greater legislative polarization than those that have no imposed limits. As the authors argued, party organizations actually have a more moderate and pragmatic bent than most other organizations and individuals who donate to campaigns, which tend to be more ideologically motivated. That is, parties are the organizations most incentivized to focus their resources on moderate candidates in competitive districts. When they are removed from the equation, donations tend to come from sources that demand ideological purity in return.
An “amateur” or “citizen” legislature, with members who tend to hold non-government jobs outside of their legislative work, might be necessary to keep the government from being beholden to partisan interests.
Professionalization
Other theories suggest that the length of a legislative session may be related to legislative polarization. An “amateur” or “citizen” legislature, with members who tend to hold non-government jobs outside of their legislative work, might be necessary to keep the government from being beholden to partisan interests. Conversely, perhaps getting to know legislative colleagues better allows a chamber to become more civil and more productive; more time in the chamber might correlate with less polarization. Maestas (Reference Maestas2000) argued that more professionalized legislatures tend to have greater policy congruence, which could mitigate against polarization.
There does not seem to be much support for either direction suggested. Figure 3 shows the relationship between the legislative-session length in 2016 and the degree of polarization that year.Footnote 2 Notably, full-time legislatures included deeply polarized California and very non-polarized Rhode Island. Even when full-time legislatures are removed from the graph, not much of a relationship remains.
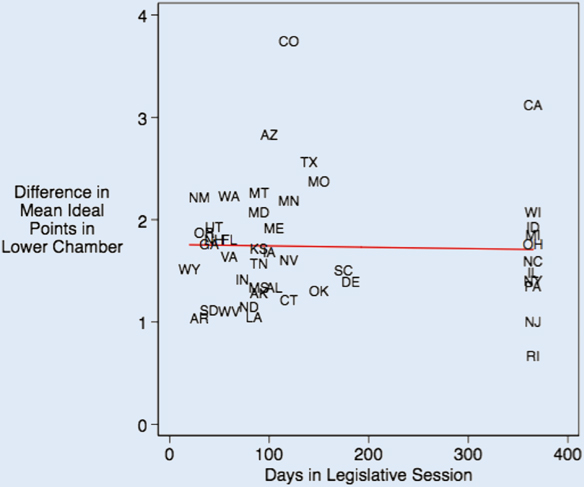
Figure 3 Legislative Polarization as a Function of Length of State Legislative Session
Chamber Size
What about the size of the legislature? There is considerable variation in chamber size: Delaware’s lower chamber has 40 members and similarly populated New Hampshire’s lower chamber has 10 times that many. Larger chambers ensure greater representation of constituencies. However, they are more difficult to manage and may require greater partisan influence to operate. Kirkland (Reference Kirkland2014), for example, found that larger legislatures tend to have more partisan collaborative networks.
Regardless of the suggestion, there again appears to be little relationship between chamber size and polarization, as shown in figure 4. Even when the considerable outlier of New Hampshire is removed, the trend line is flat. Notably, the most and least polarized states—Colorado and Rhode Island, respectively—have roughly the same number of members.
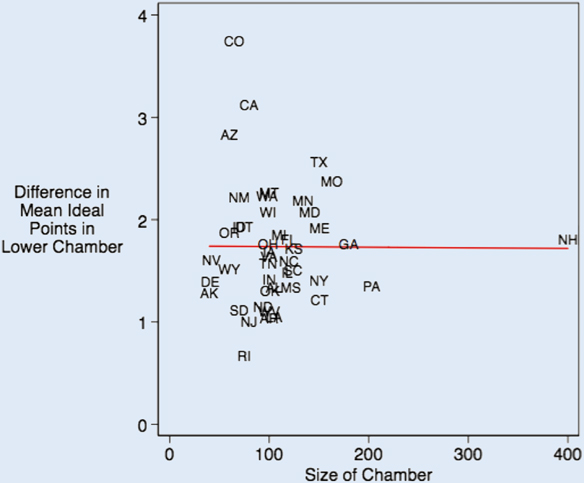
Figure 4 State-Legislative Polarization as a Function of Chamber Size
Redistricting
Few explanations for legislative polarization have received as much recent attention as redistricting. Several states have undertaken efforts to reform their redistricting processes before the next census, and combating polarization is a primary rationale provided. As the ballot literature on California’s Proposition 11 in 2008 argued, “Many of the problems we face in California are a direct result of politicians not being accountable to voters. When they draw their own districts, we end up with gridlock and nothing gets done. Proposition 11 will help end the gridlock and force the politicians to start solving problems. If they don’t, we can vote them out of office because they’ll have to run in fair districts.”Footnote 3
Legislators, the argument goes, want safer districts for themselves, and if they are allowed to draw the districts, we will see steadily safer and more polarized districts that simply elect representatives who never need to consider the other party’s viewpoints. Perhaps if this redistricting power was taken out of their hands and placed with a commission, the result would be districts that were more fair and competitive.
States vary greatly in terms of the methods used to draw up state-legislative districts every decade. However, BallotpediaFootnote 4 divides the states into three main categories: (1) legislative, in which the chamber draws the new maps; (2) commission, in which the legislature empowers a commission to draw maps and the legislature later votes on them; and (3) hybrid, in which redistricting power is shared across several branches of or agencies within government. If legislators are the cause of polarization through their redistricting efforts, then we would expect those states with legislative-redistricting systems in 2010 to have greater polarization in 2016.
In fact, figure 5 demonstrates the opposite: the most polarization is in commission-run redistricting states. This finding is consistent with that reported in Masket, Winburn, and Wright (Reference Masket, Winburn and Wright2012), which found that polarization had proceeded apace in state legislatures regardless of who was drawing the districts. Their study also found polarization occurring more rapidly between than during redistrictings, which suggests that other factors were more culpable.

Figure 5 State-Legislative Polarization as a Function of Redistricting Type
Relatedly, simple accusations that legislators are drawing safe districts often fail to accurately consider legislator incentives. To be sure, they sometimes want safer districts for everyone—which is a valuable strategy in a case of split-government control when it is otherwise difficult to find a plan to which members of both parties will agree. However, particularly when a state party has unified government control (as most currently do), the majority party may seek to increase the number of seats it can win. This often involves creating more competitive districts and marginally reducing polarization.
Primary Openness
A particularly popular explanation for legislative polarization focuses on primary electorates. Closed primaries, favored in elections in roughly 15 state legislatures, restrict the selection of party nominees to the most committed party voters. Perhaps opening up the selection of nominees to more moderate unaffiliated voters (as in a semi-closed system) or allowing voters of any party registration to choose their primary (as in an open system) would allow for the nomination of more moderate elected officials. Not only would moderates have more sway in these primary elections, candidates also would be incentivized to appeal to those moderates through their own moderation in a way that would not be necessary in a closed primary system.
As figure 6 suggests, there is little to no relationship between the openness of a primary system and the ideological extremism of the elected officials it produces. Indeed, the top-two system—perhaps the most radical approach to depolarization—has the most polarized legislatures on average. However, this result is driven largely by the inclusion of California within a small category. This finding is echoed by the more thorough analysis of McGhee et al. (Reference McGhee, Masket, Shor, Rogers and McCarty2014). Other analyses suggest a few modest influences of primary rules on polarization. McGhee and Shor (Reference McGhee and Shor2017), for example, suggested that California’s and Washington’s relatively recent experiences with the top-two primary slowed—if not reversed—polarization in those states due in large part to the existence of same-party runoffs (Crosson Reference Crosson2017). For the majority of states, however, no relationship can be found, and switching to a more open primary system appears unlikely to depolarize a legislature.
As figure 6 suggests, there is little to no relationship between the openness of a primary system and the ideological extremism of the elected officials it produces. Indeed, the top-two system—perhaps the most radical approach to depolarization—has the most polarized legislatures on average.

Figure 6 State-Legislative Polarization by Primary Type
There are several reasons why such a relationship would fail to manifest. First, moderate independents—even when they are permitted to—tend not to turn out in primary elections. California’s top-two system has been a notable disappointment for advocates of higher turnout. Colorado’s recent shift to an all-mail, semi-closed system saw unaffiliated voters turn out at approximately half the rate of partisans (Masket Reference Masket2018).
Second, following the logic of Bawn et al. (Reference Bawn, Cohen, Karol, Masket, Noel and Zaller2012), party elites have proven adept in securing the nomination of desired candidates—regardless of primary rules—through their strategic allocation of key resources such as endorsements, funding, and campaign expertise.
Third, as Norrander and Wendland (2016) noted, voters may behave strategically in their party registration—that is, those who want to participate in primary elections will join a party if the primary becomes closed, but they may remain independent if the primary is open. Thus, party membership may be a poor indicator of policy extremism.
DISCUSSION: THE REAL POLARIZERS
These examples are decidedly simplistic and largely bivariate and cross-sectional in nature. They do not strongly address concerns about causality, such as the fact that the states with the most severe polarization also may be those most likely to approve anti-polarization reforms. Nor do they demonstrate how legislatures may reform slowly or even adapt to a new set of rules over several years. To be sure, more robust studies have been done; however, they mostly uphold the non-correlations or counterintuitive relationships demonstrated in this article. In general, if polarization had as direct a cause as many reformers and officeholders suggest, we should be able to see such a relationship in a simple bivariate analysis. These simply do not materialize here.
Yet, even if these data provide some idea as to what is not causing polarization, we are still well short of understanding what is causing it. Voorheis, Shor, and McCarty (Reference Voorheis, McCarty and Shor2015) suggested an important role for economic inequality in state-legislative polarization. The link between polarization and inequality previously was demonstrated nationally (McCarty, Poole, and Rosenthal Reference McCarty, Poole and Rosenthal2006), but the Voorheis, Shor, and McCarty analysis looked at state-level income and partisan polarization and found a strong effect of the former on the latter. Furthermore, the authors found that where economic inequality is greater, Republicans tend to win more elections and the remaining Democrats become more ideologically extreme.
McCarty et al. (Reference McCarty, Rodden, Shor, Tausanovitch and Warshaw2018) also found an important influence of public opinion on state-legislative polarization. This is not a simple straightforward argument stating that the public has polarized and therefore so have legislators to reflect this. Rather, the key feature is the distribution of voter ideology within legislators’ districts. If district ideology has a single-peaked distribution, legislators representing it have greater certainty about public opinion—they can more easily represent the median voter. Conversely, if district ideology is heterogeneous or multi-peaked, there is greater uncertainty about where the median voter lies. Legislators do not know whom, exactly, to represent; district opinion thus provides less constraint on legislators, who fall back on partisan suggestions about how to vote. Therefore, the increasing ideological heterogeneity of districts may be a proximal cause of increasing legislative polarization.
Finally, the media may have a role to play in polarization. As Snyder and Strömberg (Reference Snyder and Strömberg2010) found, legislators tend to more closely represent their constituents—and deviate from their party caucuses—when local news coverage of politics is better. They examined the overlap between media markets and legislative districts and found that the greater the overlap, the more legislators cling to median voters. The declining budgets and payrolls of local newspapers and the decreasing presence of reporters in statehouses and city councils—combined with the increasing nationalization of news coverage (Hopkins Reference Hopkins2018)—therefore likely are contributing to polarization of the political system.
These three potential causes of state-legislative polarization—economic inequality, heterogeneous districts, and declining quality of media coverage—notably are not those often suggested by party reformers. They also are not those that lend themselves to easy solutions. Perhaps most important, just as the sources of polarization lie outside the legislature, so do its remedies.
There are solutions for economic inequality, including stronger labor unions and greater income redistribution. But any proposals suggesting this often run into strong opposition from at least one major political party. The heterogeneity of districts is a challenge but one that could be addressed through some version of redistricting reform. However, the idea of creating more homogeneous districts is a rather low priority for most redistricting-reform advocates—who tend to press for greater competition and representation of communities of interest—and indeed may cut against those goals.
The declining quality of local media has been noted and lamented for decades in the United States. Funding sources for local media, notably classified advertising, have largely vanished, and a declining desire for printed newspapers and aggregated electronic news sources among young readers has further undermined local news sources. Public funds could be created to support improved local media coverage, and wealthy philanthropists may be encouraged to take on a failing local newspaper. A few billionaires could replicate Jeff Bezos’s successes with the Washington Post at the local level many times over.
Indeed, polarization is a daunting issue with many important effects on the quality of governance. However, any polarization reforms that do not consider these three causes seem likely to fail and, arguably, are not taking the problem seriously.


