


Stunting affects 156 million children worldwide( 1 ). Optimal complementary feeding and hygiene practices can reduce the risk of stunting among children. Complementary feeding contributes to child growth as it promotes adequate intakes of energy and essential nutrients, while improved hygiene may decrease the risk of diarrhoeal morbidity and environmental enteropathy, a condition considered to be a potential cause of child stunting( Reference Bhutta, Das and Rizvi 2 , Reference Dangour, Watson and Cumming 3 ).
Approximately 40 % of Ethiopian children are stunted( 4 ). Although the prevalence of stunting has been reduced dramatically – by up to more than 20 percentage points( 5 ) – over the last two decades, it remains high. Suboptimal infant and young child feeding (IYCF) practices and environmental hygiene are associated with events of undernutrition among young children in Ethiopia( Reference Fekadu, Mesfin and Haile 6 – Reference Fikadu, Assegid and Dube 9 ). Such practices reported in the population are: only half of infants are exclusively breast-fed for the first 6 months after birth( 10 ); only 5 % of children 6–23 months of age meet the minimum dietary diversity of four or more food groups; and half of them do not consume the minimum number of meals they need( 10 ).
To address child undernutrition, interventions based on behaviour change communication comprise a promising strategy to improve feeding practices, given that they are appropriately contextualized, affordable and sustainable( Reference Shi and Zhang 11 , Reference Stewart, Iannotti and Dewey 12 ). Systematic reviews have demonstrated that group nutrition education or individual-level counselling is effective in improving linear and ponderal growth in various low- and middle-income settings( Reference Lassi, Das and Zahid 13 , Reference Imdad, Yakoob and Bhutta 14 ).
According to an ecological study in Ethiopia, large-scale nutrition programmes at national and provincial levels implemented during 2000–2010 could reduce stunting; progress could further be accelerated by economic growth( Reference Wirth, Matji and Woodruff 15 ). The authors pointed to unequal improvements in child stunting by province and suggested that programme impact evaluations using a robust design be employed to inform and develop effective programmes that can speed up the reduction of stunting. Indeed, only a few examples of in-depth impact/process evaluations of nutrition interventions exist in Ethiopia( Reference Negash, Belachew and Henry 16 – Reference Kim, Ali and Kennedy 18 ).
To promote appropriate child feeding and hygiene practices among caregivers and eventually aiming to improve child nutritional status, a novel, community-based participatory nutrition promotion (CPNP) programme( Reference Kang, Kim and Sinamo 19 ) was designed. Although government programmes such as Essential Nutrition Action (ENA) and Community-based Management of Acute Malnutrition (CMAM) exist in rural areas, limitations of those programmes were often reported. In the ENA programme, health extension workers were often overburdened with the amount of tasks that they needed to perform( Reference Banteyerga 20 ), and community volunteers had inadequate knowledge of ENA messages and counselling skills that did not convince mothers to maintain recommended practices( Reference Jennings and Hirbaye 21 ). These identified challenges motivated the introduction of the CPNP programme in rural Eastern Ethiopia, where mothers could be directly engaged in improving their feeding and hygiene practices.
A cluster randomized trial to evaluate the effectiveness of the CPNP programme on child nutritional status demonstrated a significant reduction in stunting( Reference Kang, Kim and Sinamo 19 ). The present study evaluates the secondary outcomes of child feeding and hygiene practices among caregivers. We hypothesized that, over a 12-month period, composite scores of child feeding and hygiene practices in the intervention area – where the CPNP programme was added to the existing government nutrition programmes – would be higher than the scores of the control area where only the government nutrition programmes were implemented.
Methods
Study settings
The present study was conducted in Habro and Melka Bello districts, Oromya region of Eastern Ethiopia. The population size was ~190 000 in Habro and ~170 000 in Melka Bello district( 22 ), and most households depended on traditional agricultural practices as their main living source. Most community members were economically poor and food insecure due to frequent droughts( 23 , 24 ), stimulating the implementation of temporary emergency nutrition programmes. World Vision Ethiopia has supported these districts with development programmes for more than 5 years.
Study design
The CPNP programme attempted to improve the feeding and hygiene behaviours of caregivers with children aged 6–24 months. Thus, the present study was designed to evaluate the programme’s effects on caregivers’ feeding and hygiene practices using a comparative design in intervention and control areas. Children were enrolled at 6–12 months and were followed up every 3 months, providing child feeding and hygiene data throughout the entirety of the 6–24-month period.
For the present cluster randomized trial, we created twelve geographical clusters – six intervention and six control clusters – based on forty-nine kebeles (the smallest administrative unit in Ethiopia) in the two districts. The estimated population size in a kebele was ~6300. By and large, two to three neighbouring kebeles constituted one cluster. One cluster was paired with another cluster in the district if they shared similar agricultural and socio-economic conditions. Allocation of the interventions was made by tossing a coin in front of community leaders and local authorities. If a cluster was randomly assigned to an intervention area, its paired cluster became the control area. Due to the pairing procedure employed, clusters were sometimes geographically adjacent and shared borders. In the intervention area, the CPNP programme was added to the existing government nutrition programmes; in the control area, only the ENA and CMAM programmes were operating. Because of the nature of the public nutrition programmes conducted in various places in the study area, study subjects and other community members in the control and intervention areas were not blinded to intervention allocations.
Interventions
Government nutrition programmes
The ENA and CMAM programmes were implemented in both control and intervention areas during the period of the CPNP programme implementation. In our study area, the ENA was designed to deliver key nutrition messages such as breast-feeding or complementary feeding to caregivers through health extension workers/volunteers in the Health Extension Program (HEP)( Reference Jennings and Hirbaye 21 ). CMAM programme activities served severely acutely malnourished children with a mid-upper arm circumference of less than 11·0 cm, by providing a Plumpy’Nut regimen at nearby health centres/health posts( 25 ); moderately acute malnourished children with a mid-upper arm circumference of 11·0–11·9 cm occasionally received corn–soya blend and vegetable oil.
Community-based participatory nutrition promotion programme
The main component of the CPNP programme was to involve mothers in daily group nutrition sessions for a 2-week period (12 d session attendance with breaks on Sunday). Programme design and implementation details are described elsewhere( Reference Kang, Kim and Sinamo 19 ). The CPNP programme promoted IYCF practices such as optimal breast-feeding, introducing varied and nutritious food groups in complementary foods to improve dietary diversity, and hygiene behaviours including individual and environmental hygiene practices. The nutrition sessions in the CPNP programme were organized by twenty-three operators recruited from their kebeles and overseen by nine supervisors. The large geographic area, the limited project period and the capacity of the project staff were main factors leading to this modification for implementation of the large-scale programme.
To identify which participants to include in their nutrition sessions, the operators screened underweight (weight-for-age Z-score <–2·0) children aged 6–24 months in their kebeles. Underweight children were prioritized to attend sessions. Mothers who agreed to participate in group sessions voluntarily contributed ingredients and materials such as firewood and cooking utensils. At the start of each session, seven to twelve mothers gathered at a convenient place in their kebele and started a nutrition session by singing a song together about the importance of child nutrition. Two mothers prepared meals according to recipes developed and recommended by World Vision nutrition experts. Locally available ingredients were used, such as grain flour, shiro flour (chickpea-based ingredient), potatoes, sweet potatoes, eggs, green leafy vegetables, animal milk, oil and tomatoes. As each meal was being prepared and distributed, mothers washed their and their children’s hands with soap and fed their children on the spot. Discussions that related key nutrition messages were then led by the operators. After the 2-week sessions were completed, the CPNP operators or supervisors made one or two follow-up visits in the following 2 weeks to participants’ homes to encourage/support the mothers to keep applying the lessons learned from the nutrition sessions. For 13 months (August 2012 to August 2013), a total of 372 nutrition sessions took place and 3299 mother–child pairs attended the nutrition sessions. Most mother–child pairs (n 3283; 99·5 % of 3299) attended the sessions once.
Study participants, sample size and sampling
The study participants consisted of mothers of children 6–12 months of age at enrolment living in the study area. A total of 2064 mother–child pairs (1032 per group) were randomly selected in the two districts. Study enrolment was conducted 3 months after CPNP sessions due to logistical limitations such as delays in preparing child rosters (see online supplementary material, Supplemental Fig. 1). Only one child per household was enrolled. Since study subjects were randomly selected based on age at enrolment, study subjects in the intervention area included children who had attended CPNP sessions ahead of being enrolled in the study, those who would ever attend over the study visits and lastly those who never attended the session until the last survey visit (Supplemental Fig. 2). As a result, the proportion of CPNP participants in the intervention area increased over study visits.
Since the present study evaluated secondary outcomes of the main evaluation, the sample size calculation estimated a difference of 0·2 in length-for-age Z-score at the end of 1-year follow-up, assuming 10 % lost to follow-up, Z-score sd of 0·9, intra-cluster correlation coefficient( Reference Fenn, Morris and Frost 26 ) of 0·054 (the actual intra-cluster correlation coefficient at the first data collection was ~0·05 for length-for-age Z-score) and type I (α) error set at 0·05 with 80 % power. Next, the calculated sample size was adjusted with the number of clusters (twelve) and average cluster sample size of 172. For the present study, the sample size – with assumed intra-cluster correlation coefficient at 0·01 for IYCF indicators – enabled us to detect a ≥10 % difference in the proportion of children achieving a minimum meal frequency and a 5 % difference in the proportion of children achieving a minimum dietary diversity as defined by WHO( 27 ) between control and intervention groups. The random selection of children was conducted using a random-number-generating table, proportional to the population size of each cluster.
Data collection
At enrolment, informed consent was obtained by reading the consent statement to the mothers and upon receiving consent getting her thumbprint (for illiterate mothers) or signature on the form. The first data collection (visit 1) was conducted following enrolment (20 November 2012 to 19 February 2013). Selected children and mothers were visited every 3 months thereafter, for a total of five times (visit 1 to visit 5) over the 12-month period. Thus, the children who were 6–12 months of age at the time of enrolment (visit 1) turned 18–24 months of age at the last data collection (visit 5, from 20 November 2013 to 19 February 2014). Enrolment information collected at visit 1 was used to assess comparability between the two groups. If an enrolled child was not found at a particular visit, attempts were continued to be made at subsequently scheduled visits.
Data collection was conducted by eighteen data collectors who had held, at minimum, a college education, were fluent in the Afan-Oromo language and were recruited from the study area. Data collectors were trained with structured questionnaires translated into the local language. The questionnaires included generic questions about IYCF practices in accordance with WHO guidelines( 27 ). Each mother was asked whether she was currently breast-feeding her child, how many times she had fed her child in the past 24 h (meal frequency) and what type of foods she had fed her child in the past 24 h using a list of food items (dietary diversity). Mothers were asked whether they had washed their hands with soap in the past 24 h at four critical time points (hand washing). The hand washing practice was evaluated at visits 1, 3 and 5 only, 6 months apart. Questions asked also included household demographic characteristics, dwelling conditions, main occupation, household assets, household food security, mothers’ social capital, and available water sources and sanitation facilities. At all five follow-up visits, mothers were asked whether they had attended CPNP sessions in the past 3 months.
Data collectors had no interaction with the project implementation team, but they knew which clusters had nutrition sessions through contact with selected mothers at the survey visit.
Protocols and definitions of variables
The age-specific feeding and hygiene scoring system is described in Table 1. The development of the scoring system was based on the multidimensional child feeding index developed by Ruel and Menon( Reference Ruel and Menon 28 ). The scores were defined separately for three age groups: 6–8, 9–11 and 12–24 months, and examined at each survey visit, except for the hygiene score, which was examined across three visits. The examined scores at five visits each were summed to present a year score for child feeding and hygiene practices of mothers while their child was 6–24 months of age.
Table 1 Scoring system used to construct scores for currently breast-feeding, meal frequency, dietary diversity, composite feeding and hand washing in Habro and Melka Bello districts, Ethiopia (2012–2014)Footnote *

* Scoring of indicators was adapted to the child feeding indices proposed by Ruel and Menon( Reference Ruel and Menon 28 ).
† Composite feeding score_1 is a sum of scores of currently breast-feeding, meal frequency and dietary diversity.
‡ Composite feeding score_2 is a sum of scores of meal frequency and dietary diversity.
§ Hand washing with water and soap was assessed at four critical points: (i) after the mother’s defecation; (ii) after cleaning the child’s bottom; (iii) before preparing foods; and (iv) before feeding the child in the past 24 h.
Current breast-feeding score
Current breast-feeding was defined as a mother reporting that she was currently breast-feeding the child (at the time of the visit). The score assigned a 0 for not breast-feeding and a 2 for breast-feeding among children 6–11 months of age; and a 0 for not breast-feeding or a 1 for breast-feeding among children 12 months of age or older at each visit. The total score summed across five visits gave a possible range of 0–7. Differential scoring for breast-feeding by age (6–11 months v. 12 months or beyond) was based on the bigger nutritional consequence of not breast-feeding a younger child as compared with an older child.
Meal frequency score
Meal frequency was defined as the number of times the infant/child was given meals other than breast milk in the past 24 h. Meal frequency during the previous day was categorized into three scores based on the child’s age range. The meal frequency score had a possible range of 0–2 at each visit before 12 months of age and a range of 0–3 from 12 months of age or older. These scores were summed across five visits, giving a possible range of 0–15.
Dietary diversity score
Dietary diversity was calculated based on the number of different food groups the child consumed in the past 24 h( 27 ). At each visit, each mother was asked whether she had fed her child foods from any of the following fifteen food items/groups: breast milk; formula; animal milk (e.g. cow’s milk); any food made from grains (e.g. sorghum, maize, wheat, teff or injera); any food made from pumpkins, carrots, red sweet potatoes or mango; any green leafy vegetables; any other fruits (bananas, tomatoes, apples or avocados); any liver, kidney, heart or other organ meats; any meat (e.g. beef, lamb or chicken); any food made from legumes or nuts (e.g. peas, lentils or peanuts); any food made with oil, fat or butter; eggs; fish; cheese or yoghurt; and any sugary foods (e.g. chocolates, sweets or sugary juice). These items were then grouped into seven food groups as follows: (i) grains; (ii) legumes and nuts; (iii) dairy foods; (iv) vitamin A-rich fruits and vegetables; (v) green leafy vegetables and other fruits; (vi) flesh foods such as meat, poultry and fish; and (vii) eggs. The sum of food groups consumed by the child during the previous day was categorized into three scores based on child age, giving a possible range of 0–2 for dietary diversity score at each visit. These scores were summed across five visits, giving a possible range of 0–10.
Hand washing score
The hand washing score was calculated by summing up the score of hand washing practices reported by mothers at visits 1, 3 and 5. Hand washing practices were assessed by asking whether the mother washed her hands with soap in the past 24 h at four critical points: after using a toilet; after cleaning the child’s bottom; before preparing food; and before feeding the child. Washing hands with soap at three or four different points was scored 2; washing at one or two different points was scored 1. If mothers reported not washing their hands with soap at those critical points, they were scored 0. These scores were summed across three visits, giving a possible range of 0–6.
Composite feeding score_1 and score_2
We constructed two types of composite feeding score: score_1 included indicators of current breast-feeding, meal frequency and dietary diversity; score_2 included indicators of meal frequency and dietary diversity only. These composite feeding scores for the 12-month follow-up were constructed by summing the scores of above indicators collected at each visit, giving a possible range of 0–30 for score_1 and 0–25 for score_2 over the five visits.
Statistical analysis
The comparability of enrolment characteristics of mothers in the control and intervention areas was tested. Linear, logistic or multinomial logistic regression analyses were used for continuous, binary and categorical variables, respectively, to be tested, accounting for study design effect.
Scores of feeding and hygiene involving current breast-feeding, meal frequency, dietary diversity, hand washing and two types of composite feeding were computed per visit to see the trend of these scores over survey visit. Bar graphs were used to plot unadjusted means (95 % confidence intervals) of feeding and hygiene scores per visit mentioned above.
Next, the scores at each of the five visits were summed to present year scores that indicate the feeding and hygiene practices of mothers of children 6–24 months of age. The differences in feeding and hygiene scores were examined between mothers in the control area v. mothers in the intervention area. Differences in scores of feeding and hygiene over the 12-month follow-up were estimated by multilevel mixed-effect linear regression models, accounting for the clustering effect, district location, and adjusting for confounders identified at enrolment such as household wealth index, father’s education level, type of nearest health facility and household food security. In addition, the differences in outcome scores within the intervention area were examined between mothers who had ever participated in a CPNP session (defined as CPNP participants) v. mothers who had not attended any CPNP sessions (defined as non-participants).
Significance of the intervention effect was tested at P<0·05. Data analysis was performed using the statistical software package Stata version 12.0.
Results
Out of the 2064 mothers randomly selected, 914 (88·6 %) in the control and 876 (84·9 %) in the intervention areas were enrolled and visited every 3 months over a 1-year follow-up period. Reasons for exclusion included participants’ absence at home at the time of follow-up or refusal to participate (n 89 in the intervention area and n 14 in the control area) or child’s ineligibility based on age (n 67 in the intervention area and n 104 in the control area). The study groups did not differ by percentage of those followed per visit; 86·8 % (n 1553) were visited at visit 2, 86·4 % (n 1547) at visit 3, 83·9 % (n 1501) at visit 4 and 77·9 % (n 1395) at visit 5 (Fig. 1).

Fig. 1 CONSORT (Consolidated Standards of Reporting Trials) flow diagram for trial participants from enrolment through the 12-month follow-up, Habro and Melka Bello districts, Ethiopia (2012–2014). Each child was followed up regardless of previous follow-up status, except for cases where the family had permanently moved or child death. The total number of children to be visited at each follow-up visit was calculated by subtracting previous permanently moved or death cases from 914 in the control area and 876 in the intervention area (CMAM, Community-based Management of Acute Malnutrition; CPNP, community-based participatory nutrition promotion; ENA, Essential Nutrition Action)
The enrolment characteristics such as mother’s education and age, child’s age and sex, household dwelling condition, access to land for farming and social capital did not differ between the intervention and control areas when adjusted for clustering effect (Table 2). The mean age of mothers was 26·1 (sd 5·4) years and 82·3 % of mothers were illiterate in the control and intervention areas. The mean age of children was 8·8 (sd 1·9) months in the intervention area and 8·7 (sd 1·9) months in the control area. The mean age of the child increased by 3 months at each visit, such that the mean age at visit 5 was 20·8 (sd 1·9) and 20·7 (sd 1·9) months in the two areas. More fathers had primary school education or higher (48·6 v. 37·8 %, P=0·04), fewer households showed severe household food insecurity (12·4 v. 34·7 %, P=0·001) and more households lived near a clinic/hospital (14·4 v. 1·0 %, P<0·001) in the intervention area compared with the control area. Household wealth status was marginally (P=0·05) better in the intervention area.
Table 2 Enrolment characteristics of subject mothers at visit 1, Habro and Melka Bello districts, Ethiopia (2012–2014)Footnote *

* Values are means and standard deviations (continuous variables) or percentages (categorical variables).
† P values were obtained from linear, logistic or ordinal logistic regression analysis accounting for clustering effect using the vce option to obtain cluster-correlated robust estimates of variance.
‡ Protected water sources include public tap/standpipe, tube well/borehole and protected well.
Out of 1790 enrolled mothers, 1199 (67·0 %) mothers – 629 (68·8 % of 914) in the control area and 570 (65·1 % of 876) in the intervention area – who were assessed at all five visits comprised a complete longitudinal data set of feeding and hygiene analyses (Fig. 1). Compared with the mothers (n 1199) included in the analysis, those who were not included in the analysis (i.e. mothers missing at least one visit; n 591) had significantly greater radio possession (36·2 v. 26·1 %, P=0·01), lived without latrines (18·4 v. 26·1 %, P=0·002) and experienced more severe food insecurity (36·0 v. 18·5 %, P<0·001).
Data are presented by visit (Fig. 2 and online supplementary material, Supplemental Table 1). At visit 1, the mean currently breast-feeding score for all children was 1·89 (sd 0·32), showing that almost all children were breast-fed. The mean meal frequency score was highest at 1·80 (sd 0·67) at visit 1, decreased by visit 2 and plateaued by visit 5. The mean dietary diversity score for all children increased from 0·70 (sd 0·85) at visit 1 to 1·43 (sd 0·73) at visit 5. The mean hand washing score did not change much over a year: 0·99 (sd 0·89) at visit 1 and 0·93 (sd 0·81) at visit 5. The mean score_1 was highest at 4·40 (sd 1·09) at visit 1, lowest at 3·20 (sd 1·11) at visit 3 and increased over subsequent visits, while score_2 increased over time with the highest score, mean 3·77 (sd 1·15), at visit 5.
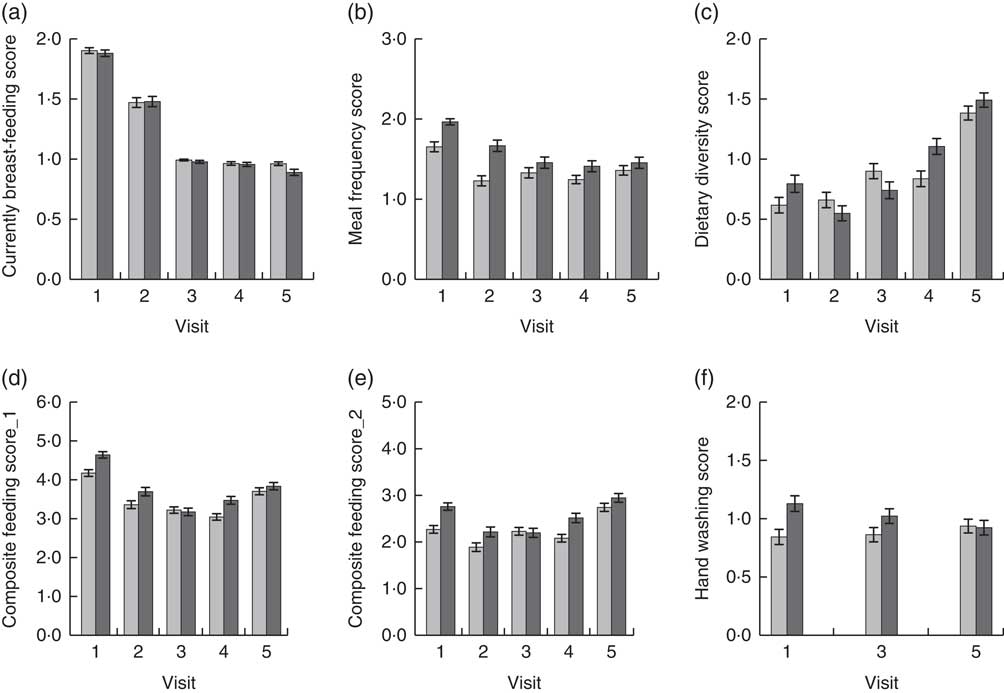
Fig. 2 Child feeding and hygiene scores among study subjects in the control area (![]() ) and intervention area (
) and intervention area (![]() ), Habro and Melka Bello districts, Ethiopia (2012–2014). Values are unadjusted means with their 95 % confidence intervals represented by vertical bars for: (a) currently breast-feeding score; (b) meal frequency score; (c) dietary diversity score; (d) composite feeding score_1 (score_1); (e) composite feeding score_2 (score_2); and (f) hand washing score. n 1199 for (a), (b), (c), (d) and (e); n 1350 for (f). Score_1 was constructed based on scores of breast-feeding, dietary diversity and meal frequency; score_2 was based on scores of dietary diversity and meal frequency
), Habro and Melka Bello districts, Ethiopia (2012–2014). Values are unadjusted means with their 95 % confidence intervals represented by vertical bars for: (a) currently breast-feeding score; (b) meal frequency score; (c) dietary diversity score; (d) composite feeding score_1 (score_1); (e) composite feeding score_2 (score_2); and (f) hand washing score. n 1199 for (a), (b), (c), (d) and (e); n 1350 for (f). Score_1 was constructed based on scores of breast-feeding, dietary diversity and meal frequency; score_2 was based on scores of dietary diversity and meal frequency
Mothers in the intervention area were found to feed their children significantly more often and practise better child feeding behaviours than their counterparts in the control area over the 12-month follow-up: meal frequency (difference: 1·04, 95 % CI 0·35, 1·73), score_1 (difference: 1·25, 95 % CI 0·37, 2·13) and score_2 (difference: 1·40, 95 % CI 0·49, 2·32; Table 3). There were no differences in scores of current breast-feeding (difference: −0·15, 95 % CI −0·35, 0·05), dietary diversity (difference: 0·38, 95 % CI −0·22, 0·97) or hand washing (difference: 0·40, 95 % CI −0·22, 1·02) between mothers in these two areas.
Table 3 Scores of currently breast-feeding, meal frequency, dietary diversity, composite feeding and hand washing for all five visits among study mothers in control and intervention areas, Habro and Melka Bello districts, Ethiopia (2012–2014)Footnote *

* n 1199 for scores of currently breast-feeding, meal frequency, dietary diversity, composite feeding_1 and composite feeding_2; n 1350 for hand washing score.
† Control area, mothers/children enrolled from the control area; intervention area, mothers/children enrolled from the intervention area.
‡ Differences (95 % confidence intervals) in scores between control and intervention areas were derived from contrasts of each score using mixed-effect linear regression analysis accounting for clustering effect, father’s education level, type of nearest health facility, household food insecurity and district location.
§ P values were obtained using mixed-effect linear regression analysis accounting for clustering effect, child age and sex, father’s education level, type of nearest health facility, household food insecurity and district location.
║ Composite feeding score_1 was constructed based on scores of breast-feeding, dietary diversity and meal frequency; composite feeding score_2 was constructed based on scores of dietary diversity and meal frequency.
The number of mothers who participated in the CPNP programme in the intervention areas increased over time as follows: ninety-two (16·1 %) out of 570 mothers in the intervention area had attended the CPNP session when recruited (at visit 1), 164 (28·8 %; cumulative proportion) mothers were found to have attended the CPNP session by visit 2, 194 (34·0 %) attended by visit 3 and 232 (40·7 %) attended by visit 4. As the CPNP programme phased out at the time of visit 4, there were no additional participants at visit 5. CPNP participants showed significantly better meal frequency score (difference: 0·43, 95 % CI 0·07, 0·78), score_1 (difference: 0·49, 95 % CI 0·01, 0·96) and score_2 (difference: 0·49, 95 % CI 0·01, 0·96) over the 12-month follow-up compared with non-participants (Table 4). However, no significant difference was found in the scores of current breast-feeding (difference: −0·11, 95 % CI −0·28, 0·05), dietary diversity (difference: 0·06, 95 % CI −0·26, 0·38) and hand washing (difference: 0·07, 95 % CI −0·18, 0·32) between CPNP participants and non-participants.
Table 4 Scores of currently breast-feeding, meal frequency, dietary diversity, composite feeding and hand washing for all five visits among non-participants and CPNP participants in intervention area, Habro and Melka Bello districts, Ethiopia (2012–2014)Footnote *

CPNP, community-based participatory nutrition promotion.
* n 570 for scores of currently breast-feeding, meal frequency, dietary diversity, composite feeding_1 and composite feeding_2; n 674 for hand washing score.
† Non-participants, mothers who never attended CPNP session in the intervention area; CPNP participants, mothers who ever attended CPNP session in the intervention area.
‡ Differences (95 % confidence intervals) in scores between non-participants and CPNP participants were derived from contrasts of each score using mixed-effect linear regression analysis accounting for clustering effect, father’s education level, household food insecurity and district location.
§ P values were obtained using mixed-effect linear regression analysis accounting for clustering effect, father’s education level, household food insecurity and district location
║ Composite feeding score_1 was constructed based on scores of breast-feeding, dietary diversity and meal frequency; composite feeding score_2 was constructed based on scores of dietary diversity and meal frequency.
Discussion
The CPNP – a new community-based nutrition programme model – was added to the ongoing government programmes and improved some child feeding practices in rural Eastern Ethiopia. Using summary scores, we found that the meal frequency score and two types of composite feeding score were significantly higher among mothers in the intervention area than in the control area over the 12-month follow-up period. During the same follow-up period, the meal frequency score and two composite feeding scores within the intervention area were higher among CPNP participants than among non-participants.
There was a declining trend of breast-feeding while diet diversity increased over time in both groups (Fig. 2). This trend was led by age-specific scoring of breast-feeding and children ageing over time. For the currently breast-feeding score, our scoring system assigned 0 or 2 points for the child’s age of 6–11 months and 0 or 1 point for the age of 12–24 months (Table 2). At visit 3 all children were 12–18 months old with their scores of 0 or 1 for currently breast-feeding. A slightly decreasing trend from visit 3 to visit 5 was due to their cessation of breast-feeding with completely replaced meals. An increasing trend of dietary diversity over time reflected the consumption of more diverse food by older children. A disaggregation of findings suggests that the differences in the two composite feeding scores between intervention and control areas and between CPNP participants and non-participants over the 12-month follow-up period were mainly driven by meal frequency scores. An analysis of each visit demonstrates that the differences in composite feeding scores between the intervention and control areas resulted primarily from better meal frequency scores at early visits and from higher dietary diversity scores at later visits.
These results may imply that the CPNP programme in this context could be effective in increasing meal frequency in a relatively short period among younger children, but that longer exposure to the programme may be needed to improve dietary diversity. Specifically, dietary diversity scores among CPNP participants seemed to run above the scores of mothers in the control area in all visits, while the dietary diversity scores of non-participants in the intervention area were likely to reach below those of the control area by visit 3 (data not shown). Thus, although CPNP participants kept better dietary diversity practices from the start of follow-up, significant improvements in dietary diversity in the whole intervention area was not evident in early visits. Non-participants in the intervention area, however, gradually caught up to the level of dietary diversity of CPNP participants, and, by visit 4, the non-participants had significantly higher dietary diversity scores than those of the control area, which again led to a significant difference in favour of the entire intervention area (data not shown). Meanwhile, such discernible advances were not seen in the meal frequency of non-participants at each visit despite significant differences in meal frequency scores between the participants and non-participants over the year of follow-up.
A spill-over effect of the CPNP programme in improving feeding practices in the entire intervention area would be plausible given the assumption of frequent contacts involving the transfer of feeding messages from nutrition sessions among CPNP participants and non-participants. Indeed, more mothers could have come in contact with CPNP participants over time in the intervention area, especially given the 40·7 % increase of the participant population in the intervention area. Even at visit 1, ~45 % of all mothers in the intervention area reported ever having contact with participants in the past 3 months. The increase in the proportion of participants and frequent contacts between the participants and non-participants may have increased information sharing and potentially influenced the social norm around child feeding practices among all mothers in the intervention area.
The lack of differences in breast-feeding scores between the two areas was understandable, considering that the programmatic nature of the CPNP placed more emphasis on complementary feeding.
The non-significant difference in hand washing practices over the year of follow-up between control and intervention areas might be due to the availability of information in the community on hygiene practices. For example, the HEP, a government-led primary health care programme, promotes hand washing and sanitation at the kebele level. Therefore, the knowledge of hand washing with soap may have already been prevalent among mothers in all study areas.
Interestingly, the differences in scores between control and intervention areas were reduced at the last visit when children turned 18–24 months of age. We suggest several possible reasons for this decrease. First is a possibly weakened CPNP programme effect at the community level after the programme’s phase-out (at visit 4). Although mothers directly or indirectly experienced the CPNP programme by that time, a longer exposure to the programme (until children turn 24 months of age, for example) may be necessary for mothers to maintain improved child feeding practices. Second, increased sharing of messages from the nutrition sessions in intervention areas may have ‘contaminated’ the knowledge of mothers in the control area. This would lead to improvements in feeding practices in the control area, in turn shrinking the differences in practices when compared against those from the intervention area. Since there is no physical border separating people from the control and intervention areas, mothers in the control area might have had opportunities to get information about CPNP lessons either from the participants or community members in the intervention area. Third, the programme may have a stronger effect among younger v. older children (e.g. before 18 months of age). In an intervention that attempts to change mothers’ behaviours during the child’s 6–24-month period, it would be comprehensible for concerns of child nutritional status to be greatest when the child is youngest. Despite the need of further investigation, these considerations would help programme practitioners improve the CPNP programme so as to maximize impact and sustainability.
The environment in which the study was conducted, where food resources are limited, also likely imposes constraints on mothers’ ability to prepare sufficient and diversified foods for young children. In some food-secure contexts such as Peru and China, nutrition education or counselling alone delivered by health-care providers at health centres enhanced consumption of specific types of food such as animal foods, which were affordable to mothers in these settings( Reference Penny, Creed-Kanashiro and Robert 29 , Reference Shi, Zhang and Wang 30 ). A study in Peru showed that children in the intervention area had higher energy intake and greater consumption of animal foods, Fe and Zn from complementary foods( Reference Penny, Creed-Kanashiro and Robert 29 ). In a study in China, the intervention improved the percentage of meat, beans, and yellow- and orange-coloured foods consumed( Reference Shi, Zhang and Wang 30 ).
In contrast, in food-insecure settings, paraprofessional community workers or peer mothers often played a role of delivering nutrition education to caregivers in their communities( Reference Bhandari, Mazumder and Bahl 31 ). Complementary feeding education trials in food-insecure environments have been shown to be effective in increasing meal feeding frequency and energy intakes from complementary foods among intervened children, but no improvements were seen regarding dietary diversity( Reference Bhandari, Mazumder and Bahl 31 – Reference Vazir, Engle and Balakrishna 33 ). A randomized controlled trial in Vietnam that evaluated the impact of the Positive Deviance/Hearth programme showed increased breast-feeding frequency and increased daily food consumption among intervened children( Reference Pachon, Schroeder and Marsh 34 ). Our study is meaningful because it adds to the literature on complementary feeding education interventions, showing consistent findings with the above studies, such as in improving meal frequency and composite child feeding practices.
Child feeding indices were often used to examine comprehensive feeding practices and their associations with child growth or macro- or micronutrient intake in some African and Asian settings( Reference Ruel and Menon 28 , Reference Bork, Cames and Barigou 35 – Reference Moursi, Treche and Martin-Prevel 37 ). In general, five types of indicators – breast-feeding, dietary diversity based on seven or eight food groups in the past 24 h, meal frequency, bottle-feeding and food group frequency in the past week – have been used to construct these indices. Our study used only three of these indicators: breast-feeding, meal frequency and dietary diversity.
The strength of our study was the use of a cluster randomized trial to compare feeding and hygiene practices among a longitudinal cohort of mothers over a 12-month follow-up period. Nevertheless, there are a few limitations that deserve mention here. First, true baseline data for feeding and hygiene practices were not available. This limited our ability to understand the outcomes in feeding and hygiene scores at visit 1. For example, it remained unclear as to how much of the differences observed between intervention and comparison areas were attributable to the CPNP programme, and how much of the differences resulted from variations of the control and intervention areas at enrolment. Considering the decreasing trend of such differences in some outcome scores between the intervention and control areas or between participants and non-participants over the follow-up, we infer that the programme effects may have already occurred before the first survey visit. This is the reason why we evaluated summary scores over the 12 months of follow-up rather than focusing on outcomes at individual visits. Second, the CPNP programme was not blinded because the CPNP activities could be observed by any community member; however, data collection procedures were standardized and enumerators were trained to remain unbiased towards all mothers to reduce bias. Third, comparability between control and intervention areas was lacking, yet potential confounders were adjusted for in the analysis, which might result in changes in study findings. This suggests that some of these factors (such as household food insecurity) may have influenced behavioural outcomes. Lastly, all assessments relied on maternal recall and were not based on direct observation, so we cannot exclude the possibility that CPNP groups or other mothers in the intervention area might have exhibited higher social desirability to provide the correct answer to the questions asked rather than to report their true practices. This might be a source of bias to the outcomes despite interviewers’ training to retain neutral attitudes towards all study mothers. However, given the programme’s effects on other health/functional outcomes that we also assessed( Reference Kang, Kim and Sinamo 19 ), our results indicate that the CPNP intervention may have had positive effects and that behaviours may have in fact changed.
Our study findings imply that efforts to promote optimal IYCF with behaviour change communication should not be underestimated in resource-limited settings, despite the limited evidence of effects of nutrition education in improving IYCF and child nutritional status. The CPNP has an advantage as a platform where mothers themselves could practise and adopt necessary feeding behaviours in an affordable and community-accepted way. Furthermore, the CPNP programme leveraged a context where other nutrition programmes (CMAM, for example) were implemented. That condition would help stable operations of the CPNP programme in the study area by addressing acutely malnourished cases among children. Therefore, we recommend that the CPNP model is applied in similar settings where nutrition interventions that provide supplementary foods or therapeutic supplements are available.
The sustainability of the CPNP approach could be discussed in two ways: its ‘benefit over time’ and ‘capacity to maintain the programing’( Reference Schell, Luke and Schooley 38 ). First, the CPNP programme contributed benefits to the existing ENA programme. The district health offices in Habro and Melka Bello areas reported that the CPNP component drew greater involvement from participants and played a key role in the ENA programme over the study period( 39 ). This suggests that the CPNP approach could be harmonized with and strengthen existing programmes, which sheds light on the programme’s potential to be sustained in this context. Second, the present study, which followed up a longitudinal group up to 24 months of age, has a limitation in explaining the sustained programme impact after the programme’s phase-out. Thus, the impact of the recommended practices needs to be evaluated using cross-sectional surveys of children aged 6–24 months at intervals of several years. Third, the capacity to maintain the CPNP programming should be proven within the community health system. Our study was based on the CPNP programme managed by a non-governmental organization which hired operators and supervisors. After the phase-out of the programme, the study district health offices advocated for the continuation of the CPNP programme and promoted community volunteers as operators. This spontaneous adoption and expansion of the programme supports a promise that CPNP can and will be integrated into the community health system, as a means of ensuring the programme’s sustainability.
Acknowledgements
Acknowledgements: The authors are indebted to all the participating mothers and children in Habro and Melka Bello districts. They thank the Ethiopia Integrated Nutrition Project (EINP) team, district health offices, World Vision Ethiopia Area Development Program Offices, Habro and Melka Bello districts, Ethiopia, and World Vision Ethiopia Head Office, Addis Ababa, Ethiopia, for their support and affection for the study. They also thank the International Ministry Division, World Vision Korea, and Wholistic Interest Through Health (WITH), Seoul, South Korea, for their administrative support. The authors thank Dr Keith West, Dr David Paige and Jane Kim, Johns Hopkins School of Public Health, USA, for providing guidance and comments with the preparation of this manuscript; also Martin Blair and Julie Ruel-Bergeron for editing assistance. Financial support: The research was funded by World Vision Korea (project #E197684) and Korea International Cooperation Agency (KOICA). Conflict of interest: Y.K., Y.K.S., H.-S.J. and P.C. have no conflicts of interest. L.D. was an employee of World Vision Ethiopia during a certain period of the project implementation. The funding agencies had no role in the design of the study, data collection and analysis, or presentation of the results. Authorship: The authors’ responsibilities were as follows: Y.K., P.C. and Y.K.S. designed the study and prepared a proposal; Y.K. and L.D. (former World Vision Ethiopia staff member) conducted the research in the field; Y.K. and P.C. analysed data and wrote the manuscript; H.J., Y.K.S. and L.D. reviewed the manuscript and substantially contributed to interpretation of the results; Y.K. had primary responsibility for final content. All authors read and approved the final manuscript. Ethics of human subject participation: The effectiveness study proposal and protocol were reviewed and approved by the Institutional Review Board at Oromia Regional Health Bureau, Addis Ababa, Ethiopia. This trial was registered at Current Controlled Trials as ISRCTN 89206590.
Supplementary material
To view supplementary material for this article, please visit https://doi.org/10.1017/S1368980016003347


