


Healthy eating plays a vital role in maintaining a high quality of life and in the prevention and management of chronic diseases such as overweight and obesity, diabetes, hypertension, certain types of cancer and CVD. Traditionally, research has focused on the relationship between individual nutrients/food items/food groups and health outcomes, yet this approach has often resulted in conflicting findings( Reference Hu 1 ). Researchers have recognised that nutrients and bioactive compounds in foods are consumed in complex combinations, and studies of individual nutrients and foods can be difficult to interpret because of strong inter-correlations between them( Reference Jacobs, Gross and Tapsell 2 ). Therefore, the study of complex meals and overall diet may be more beneficial in assessing potential associations between dietary intake and health outcomes.
In many cultures, main meals are composed around the protein source, typically meat, poultry or fish. The accompanying food groups may vary considerably according to the protein source, eating occasion, taste, availability, cost and other factors. Hence, the choice of protein source will impact on the healthiness of the total meal( Reference Verbeke, Perez-Cueto and de Barcellos 3 ). For example, epidemiological studies have identified a shift in consumption from red meat to poultry in some developed countries( Reference Daniel, Cross and Koebnick 4 , Reference Pot, Prynne and Almoosawi 5 ) that is likely to affect the accompanying foods or side dishes. However, little research has been done in this area.
The objective of the present study was to explore the composition of main meals and snacks consumed by the Australian population and to examine associations between meat/poultry/fish and other foods. This information will provide better insights into current meal composition.
Methods
Participants and dietary data collection
The present study utilised the 2011–12 National Nutrition and Physical Activity Survey (NNPAS), undertaken by the Australian Bureau of Statistics (ABS) between May 2011 and June 2012. The survey approached 12 366 dwellings and completed a sample of approximately 9500 private dwellings across Australia (response rate 77·0 %). All adult respondents were interviewed in person to collect data on the exact quantity of food consumption and the time of consumption. For children and adolescents less than 5 years old, parents/guardians were used as proxies, while 5–17-year-olds were interviewed in person (if permission granted by parent) or by parent proxy. The validity of proxy report for children’s 24 h dietary intake data collection has been reported previously( Reference Bornhorst, Bel-Serrat and Pigeot 6 ). Ethics approval for the survey was granted by the Australian Government Department of Health and Ageing Departmental Ethics Committee in 2011( 7 , 8 ).
The NNPAS contains food and nutrient information from two 24 h recalls (the first one collected by interview, the second one by telephone) and information on selected dietary behaviours (e.g. usual consumption of fruit and vegetables in servings and whether food intakes on the day interviewed were more or less than usual; further details are available from the ABS) by age group and gender at the national level. To take account of possible seasonal effects on health and nutrition characteristics, the NNPAS sample was spread randomly across a 12-month enumeration period. Further details about the scope and the methodology of the survey are available from the ABS( 8 ).
In the current analysis, data from 12 154 respondents aged 2 years or over who completed the first 24 h recall were used, with the results weighted to reflect the Australian population( 7 – 9 ). The weighting procedure was provided by the ABS to ensure that the survey estimates conform to the independently estimated distribution of the population by age, gender and area of usual residence, rather than to the distribution within the sample itself. Demographic details and energy and macronutrient intakes of all respondents were reported by the ABS and are summarised in the online supplementary material, Supplemental Table 1.
Meals and eating occasions
The 24 h dietary recall interview collected detailed information on all foods and beverages consumed on the previous day, from midnight to midnight. Information collected from the respondents included the time of consumption, the name of the eating occasion (e.g. breakfast), a detailed food description and the amount consumed( 8 ). The names of the eating occasions (e.g. breakfast) were self-defined by the respondents. In the present study, we analysed main meals separately as ‘breakfast’, ‘lunch’ and ‘dinner’, while ‘snack occasions’ included eating occasions such as brunch, morning tea, afternoon tea, supper, snacks and others because it was not clear whether these eating occasions replaced any main meals.
Categorisation of meat/poultry/fish and accompanying food groups
The term ‘meat/poultry/fish’ as used herein refers to red meat, offal/organ meats, poultry, fish/seafood and processed meat. ‘Red meat’ refers to beef (including veal), lamb (including mutton), pork, kangaroo and game meats (including goat, venison and rabbit) as described in the Australian Guide to Healthy Eating( 9 , 10 ). All offal and organ meats were reported together due to small numbers. ‘Poultry’ refers to chicken and other poultry such as turkey and duck. ‘Fish and seafood’ refers to all fresh finfish, seafood, canned fish and fish/seafood products. ‘Processed meat’ includes sausage, ham, bacon, and luncheon meat and other processed meats (salami, nuggets, canned meat and dried meat). Other food groups included meat alternatives (eggs, legumes/beans, nuts/seeds), non-starchy vegetables (excluding legumes and beans), starchy vegetables (potato, sweet potato, taro, cassava and corn), fruit, grains (bread, cereals, rice, pasta), dairy products (milk, cheese, yoghurt and alternatives), discretionary foods (cakes, biscuits, pastries, deep-fried fast foods, crisps, ice cream, confectionery, butter and sweet spreads( 8 )), discretionary beverages (soft drinks, fruit drinks, energy drinks and sports drinks) and alcoholic drinks (beer, wine, spirits and mixed drinks). The term ‘discretionary food/beverage’ combined both foods and beverages but not alcohol. The term ‘drinks’ refers to non-discretionary drinks including water, tea and coffee. These drinks were not analysed as the reported consumption was not clearly separated by eating occasion in NNPAS 2011–12.
To assess consumption of all foods within a food group, all individually recorded food items and foods as part of a mixed dish were included. The individual food components from a mixed dish were estimated using the AUSNUT 2011–13 recipe file( 11 ); for example, the amounts of chicken and non-starchy vegetable components in a chicken stir fry were disaggregated and classified accordingly.
The term ‘consumer of meat/poultry/fish’ refers to respondents who reported consumption of meat/poultry/fish at a particular eating occasion. The term ‘accompanying food’ as used herein refers to food groups consumed at the same eating occasion as the meat/poultry/fish component. The term ‘popular choices’ refers to meals with a meat/poultry/fish component, at any eating occasion, which were consumed frequently by more than 1·0 % of the population. The first step in identifying these dishes included coding the meat/poultry/fish components according to their cut (e.g. steak, mince, strips, chop, fillet). Second, if identifiable, each meal containing meat/poultry/fish and accompanying foods was coded with a dish name (e.g. beef steak meal, chicken meal, pasta dish) for every respondent in the survey. For example, a ‘beef steak meal’ comprised beef coded as steak cut and other accompanying foods, but not labelled as a mixed dish by the respondent, at a particular eating occasion. A ‘chicken meal’ (grilled/baked/roast) comprised any cut of chicken with accompanying foods but not labelled as a mixed dish. A ‘chicken curry’ comprised any cut of chicken, some or no accompanying foods, and curry paste/powder, and labelled as a mixed dish by the respondent. A ‘sandwich or roll with canned fish’ comprised canned fish, bread (or equivalent) and some or no other accompanying foods.
The contribution to energy intake from total meat/poultry/fish and other food groups was estimated using the AUSNUT 2011–13 food nutrient database( 11 ) for each participant, and then averaged across the relevant age/gender groups.
Data analysis
Statistical analyses were performed using the statistical software package IBM SPSS Statistics for Windows Version 22.0 (released 2013). Results were reported separately for gender (males v. females), age groups (children aged 2–13 years; adolescents aged 14–18 years; young adults aged 19–34 years; adults aged 35–64 years; older adults aged 65 years or above) and socio-economic status represented by the Socio-Economic Index of Disadvantage for Areas (SEIFA). Respondents’ SEIFA categorisations were divided into quintiles, where the first SEIFA quintile indicates the least advantaged areas. SEIFA includes assessment of income, level of education, disability, poor English skills, employment type (labourers or unemployed), access to a motor vehicle, marital status (divorced or separated), single-parent households, overcrowded living conditions, low-cost housing and no home Internet access. Descriptive statistics were used to report the proportions of respondents (%), per capita consumption (mean intake (g/d) among the whole population), portion size (median intake (g/d) of food per eating occasion) and contribution to energy intake (%) according to different meals consumed. Per capita consumption was analysed using all respondents, whereas portion size was analysed among consumers only. Portion sizes were reported as 25th, 50th and 75th percentiles by dish and eating occasion. Popular choices for different eating occasions were identified based on the frequency of reported meals. Because of the large variety of dishes reported by the respondents, only those reported by more than 1·0 % of the population are shown. The names of dishes reported by less than 1·0 % of the population (e.g. sushi, burritos and dumplings) are not shown.
Results
The consumption of meat/poultry/fish and other food groups by eating occasion is shown in Table 1 (proportion consuming) and Table 2 (per capita intake).
Table 1 Proportion of persons consuming meat/poultry/fish and other food groups on the day interviewed according to eating occasion; Australians aged 2 years or above (n12 153), 2011–12 National Nutrition and Physical Activity Survey

* Individual meat/poultry/fish types not reported if consumed by less than 1·0 % of the population at any eating occasion, e.g. kangaroo, game, offal/organ, other poultry, fish/seafood products and other processed meat.
Table 2 Per capita intake of meat/poultry/fish and other food groups on the day interviewed according to eating occasion; Australians aged 2 years or above (n12153), 2011–12 National Nutrition and Physical Activity Survey

* Individual meat/poultry/fish types not reported if consumed by less than 1·0 % of the population at any eating occasion, e.g. kangaroo, game, offal/organ, other poultry, fish/seafood products and other processed meat.
Breakfast
At breakfast, less than 10 % of the respondents consumed meat/poultry/fish, mostly as bacon (Table 1). In contrast, grains, dairy products and fruit were consumed in the largest amounts at breakfast. Age, gender and SEIFA differences were observed at breakfast. Males and young adults reported the highest proportion and per capita intake of meat/poultry/fish at breakfast. SEIFA categorisation showed no differences in consumption of meat/poultry/fish, but fruit, grains and dairy products were consumed in the highest proportions and amounts in the least disadvantaged socio-economic quintiles. Detailed information about proportion of consumption and per capita intake of different food groups can be found in the online supplementary material, Supplemental Tables 2 and 3.
Lunch
Consumption of meat/poultry/fish at lunch was reported by over 55 % of the population and approximately one-third of meat/poultry/fish was consumed at this meal. Processed meat was the most commonly reported meat/poultry/fish category at lunch, consumed by one in five respondents, with ham being the most popular type. However, chicken and beef had the highest per capita intake within this food group. Other food groups with high per capita intakes at lunch were grains, non-starchy vegetables and discretionary beverages. Age, gender and SEIFA differences were also observed at the lunch meal. Males were more likely to report red meat, poultry and processed meat, but less likely to report fish/seafood, than females. Young adults were more likely to report meat/poultry/fish and in the highest amounts, while children were most likely to report processed meat (one in four). Categorisation by SEIFA showed that fish/seafood consumption was reported most, and in higher amounts, in the least disadvantaged socio-economic quintiles (Supplemental Tables 2 and 3).
Dinner
At dinner, the majority of the population consumed meat/poultry/fish and in the highest amounts, approximately two-thirds of daily intake. Beef and chicken were the most commonly reported meat/poultry/fish types. Dinner was the largest meal of the day reflected by total per capita intakes of all food groups. The largest components of dinner, apart from meat/poultry/fish, were grains, starchy and non-starchy vegetables, and discretionary foods and beverages. Similar age, gender and SEIFA differences were observed at dinner as at lunch. Males reported higher consumption of all foods except fruit than females. Among all age groups, adolescents were most likely to report meat/poultry/fish at dinner, in particular red meat and processed meat. Categorisation by SEIFA showed differences only in fish/seafood consumption, with higher consumption levels in the least disadvantaged socio-economic quintiles (Supplemental Tables 2 and 3).
Snack occasions
At snack occasions, consumption of meat/poultry/fish was reported by 12 % of the respondents, with per capita intakes being small (8·9 g). Processed meat was the most reported meat/poultry/fish category. For all respondents, snack occasions mostly comprised dairy products, fruit, discretionary foods and beverages, and alcohol. Males reported larger consumption of total and individual categories of meat/poultry/fish than females. Adolescents were most likely to report meat/poultry/fish at snack occasions mostly as processed meat (one in ten). Across SEIFA quintiles, no differences in food group consumption were observed (Supplemental Tables 2 and 3).
Contribution to energy intake at different eating occasions
The contributions of meat/poultry/fish and other food groups to energy intake at all eating occasions are reported in Table 3. The average contribution to energy intake from meat/poultry/fish was minimal at breakfast and snacks (<3 %). Meat/poultry/fish contributed 14·7 % to energy at lunch and 20·3 % at dinner, mostly from red meat and poultry.
Table 3 Contribution to energy intake from meat/poultry/fish and other food groups on the day interviewed according to eating occasion; Australians aged 2 years or above (n12153), 2011–12 National Nutrition and Physical Activity Survey
Figure 1 illustrates the comparison of meat/poultry/fish categories for lunch and dinner in terms of their contribution to food and energy intakes. At both lunch and dinner, respondents who consumed red meat, poultry or fish/seafood reported higher proportions of non-starchy vegetables than those who consumed processed meat. In contrast, consumers of processed meat reported the highest proportion of discretionary beverages. In the context of contribution to energy intake, the consumers of fish/seafood reported the lowest proportion of energy from discretionary choices at both lunch and dinner.
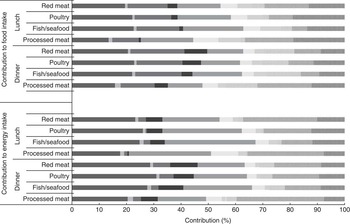
Fig. 1 Composition of lunch and dinner meals (![]() , meat/poultry/fish;
, meat/poultry/fish; ![]() , meat alternatives;
, meat alternatives; ![]() , non-starchy vegetables;
, non-starchy vegetables; ![]() , starchy vegetables;
, starchy vegetables; ![]() , grains;
, grains; ![]() , dairy products;
, dairy products; ![]() , fruits;
, fruits; ![]() , alcoholic drinks;
, alcoholic drinks; ![]() , discretionary foods;
, discretionary foods; ![]() , discretionary beverages) among consumers of different meat/poultry/fish types; Australians aged 2 years or above (n12153), 2011–12 National Nutrition and Physical Activity Survey (NNPAS). Consumers may eat more than one meat/poultry/fish category per meal. Breakfast and snacks are not shown in the figure because the per capita consumption of meat/poultry/fish was less than 10 g. Drinks are not included in the figure. The term ‘drinks’ refers to non-discretionary drinks including water, tea and coffee. These drinks were not analysed as the reported consumption was not clearly separated by eating occasion in NNPAS 2011–12. Discretionary foods include energy-dense nutrient-poor foods such as cakes, biscuits, pastries, deep-fried fast foods, crisps, ice cream, confectionery, butter and sweet spreads. Discretionary beverages include energy-dense nutrient-poor beverages such as soft drinks, fruit drinks, energy drinks and sports drinks. Alcoholic drinks include beer, wine, spirits and mixed drinks
, discretionary beverages) among consumers of different meat/poultry/fish types; Australians aged 2 years or above (n12153), 2011–12 National Nutrition and Physical Activity Survey (NNPAS). Consumers may eat more than one meat/poultry/fish category per meal. Breakfast and snacks are not shown in the figure because the per capita consumption of meat/poultry/fish was less than 10 g. Drinks are not included in the figure. The term ‘drinks’ refers to non-discretionary drinks including water, tea and coffee. These drinks were not analysed as the reported consumption was not clearly separated by eating occasion in NNPAS 2011–12. Discretionary foods include energy-dense nutrient-poor foods such as cakes, biscuits, pastries, deep-fried fast foods, crisps, ice cream, confectionery, butter and sweet spreads. Discretionary beverages include energy-dense nutrient-poor beverages such as soft drinks, fruit drinks, energy drinks and sports drinks. Alcoholic drinks include beer, wine, spirits and mixed drinks
Portion size
The portion sizes of meat/poultry/fish and other food groups at all eating occasions are reported in Table 4 for children and adults. Portion sizes for meat/poultry/fish at all eating occasions varied considerably from 15 g for bacon to 104 g for lamb (children) and from 17 g for ham or bacon to 178 g for sausages (adults). The portion sizes of all meat/poultry/fish categories were larger at dinner than lunch or breakfast. Similarly, portion sizes of non-starchy vegetables, starchy vegetables, grains and discretionary foods were largest at dinner. Children reported smaller portion sizes than adults in all food groups except fruits and discretionary foods and beverages.
Table 4 Portion size of meat/poultry/fish and other food groups among consumers on the day interviewed according to eating occasion; Australians aged 2 years or above (n 12 153), 2011–12 National Nutrition and Physical Activity Survey

P25, 25th percentile; P75, 75th percentile.
* No portion size reported if food group consumed by less than 1·0 % of the population.
Popular choices
Table 5 shows the portion sizes of meat/poultry/fish and accompanying foods of frequently reported or ‘popular’ meals at all eating occasions for adults. At breakfast, the most popular meat-containing meal comprised bacon, egg (meat alternative) and bread/toast (2 slices), reported by 3·5 % of adults. At lunch, sandwiches/rolls/wraps with chicken, beef or canned fish were among the most popular meat-containing meals. At dinner, chicken cuts or beef steak with vegetables, starchy and non-starchy, were most popular. Pasta dishes with beef, such as spaghetti bolognaise, were also frequently consumed, with smaller portion size of meat. In general, portion sizes of cuts of meat (chicken, beef steak, lamb steak, pork steak) were larger than meat as part of a mixed dish such as pasta dishes, stir fries and hamburgers.
Table 5 Most popular meat/poultry/fish meals by eating occasion: proportion reported and portion size of different meat/poultry/fish types and popular choices at different eating occasions among adult consumers; Australians aged 2 years or above (n 12 153), 2011–12 National Nutrition and Physical Activity Survey

* Portion size not shown in the table if reported by less than 1·0 % of the population as accompanying food of the dish.
† Sandwich or roll in breakfast with ham/bacon also covers cooked breakfast with processed meat, egg and toast.
Discussion
In studies of food intake and nutritional epidemiology, meat/poultry/fish are generally examined as one homogeneous food group. In the present secondary analysis we have examined the types of meat/poultry/fish consumed more closely, in terms of their consumption at different eating occasions and which foods accompany particular meat types. This provides the first nationally representative data on meal composition at different eating occasions and the positioning of meat/poultry/fish in relation to other food groups at different meal occasions.
Overall, breakfast was the smallest meal of the day, consistent with literature from other Western cultures, and consisted mostly of foods high in carbohydrates and fewer foods high in protein and fat than the other meals( Reference Meiselman 12 , Reference Myhre, Loken and Wandel 13 ). In our analysis, food groups that contributed most to breakfast were grains, dairy products and fruit. Lunch was the second largest meal and consisted mostly of grains, non-starchy vegetables, meat/poultry/fish and discretionary beverages. The largest meal of the day was dinner, consisting mostly of meat/poultry/fish, vegetables (starchy and non-starchy), grains and discretionary beverages (children) or alcohol (adults). All snacking occasions (including snack, morning tea, brunch, afternoon tea, supper, extended consumption, beverage/drink and others) combined had a larger contribution to total per capita intake than dinner, with the main food groups contributing being dairy, fruit, discretionary foods and beverages, and alcohol (adults).
Our analysis found that lunch and dinner were the main eating occasions for meat/poultry/fish, with approximately one-third of daily meat/poultry/fish consumed at lunch and two-thirds at dinner. At lunch, ham was the most frequently reported meat type, while beef and chicken were more frequently consumed at dinner. For the small proportion of people who consumed meat at breakfast, it was most likely to be bacon.
Discretionary foods and beverages were consumed at all meals and snacks, and made a large contribution to energy intake, irrespective of gender and age group. ABS showed that the Australian population consumed 35 % of total energy intake from discretionary foods/beverages( 8 , Reference Sui, Wong and Louie 14 ). Consumers of red meat, poultry or fish/seafood at lunch or dinner reported higher intakes of non-starchy vegetables in comparison to the consumers of processed meat, who reported the largest proportion of energy from discretionary choices. In consideration that processed meat is a type of discretionary choice, among those who consumed processed meat at lunch and dinner, the contribution to energy from all discretionary sources could be as high as 60 %. In addition, subgroup analysis showed that the younger age groups were most likely to consume processed meat as a part of their main meal, highlighting a possible target group for future public health interventions.
Data on accompanying foods with meat-centred meals are scarce. Results of most overseas studies are not directly comparable to ours as these focus on specific meat types and lack details on accompanying foods( Reference Verbeke, Perez-Cueto and de Barcellos 3 ). A study of Irish adults showed that compared with red meat, fish and poultry, intake of processed meat was associated with lower total diet quality in adults( Reference Cosgrove, Flynn and Kiely 15 ). A review also found that red meat consumption was associated with higher vegetable intake than processed meat( Reference Corpet 16 ). Processed meat consumption has long been recognised as contributing to adverse health outcomes including obesity( Reference Rouhani, Salehi-Abargouei and Surkan 17 ) and certain types of cancer( Reference Larsson and Orsini 18 ). Our results highlight that processed meats are accompanied by poor choices of other foods.
We found that the portion sizes of red meat, poultry and fish/seafood varied to a large extent and were in general larger than that of processed meat, consistent with previous portion size literature in the Australian population. Zheng et al.’s analysis on typical portion sizes also utilised data from the 2011–12 NNPAS (using crude food group data) and found that portion sizes of red meat, poultry and fish/seafood ranged from 86 g to over 240 g for adults, while portion sizes of ham ranged from 17 to 34 g depending on age and gender subgroup( Reference Zheng, Wu and Louie 19 ).
In addition, our analysis showed that the portion size of non-starchy vegetables as accompanying foods for red meat, poultry and fish/seafood varied but was larger than that for processed meat, further confirming the association between intake of fresh meat/poultry/fish and non-starchy vegetables.
The popular choices at lunch were sandwiches/bread rolls containing chicken, beef and canned fish. Hot meals such as beef/lamb steak/grilled meal and pasta dish were not commonly consumed at lunch. At dinner, beef/lamb/pork steak meal, chicken meal, sausage meal and pasta meal were the most frequently reported choices. A large diversity of other meal choices, such as Indian, Thai, Chinese, Mexican, Japanese and Middle-Eastern foods, is indicative of Australian multicultural cuisine. The popularity of processed meat at both main meals and snacks has also been noted( Reference Cosgrove, Flynn and Kiely 15 ) and a previous Australian study using the National Children’s Survey found that processed pork was the most frequently consumed type of pork by Australian children( Reference Nolan-Clark, Neale and Charlton 20 ).
The strength of the present study included the use of a large representative sample of Australians, covering all days of the week and seasons of the year. Food groups were comprehensive and contained all disaggregated data from mixed dishes containing meat/poultry/fish, meat alternatives, fruit, vegetables and grains. However, our results should not be directly used to comment on the comprehensive diet quality of the population as we do not have detailed nutrient profile information for many food items, such as refined grains/whole grains separation and fat contents of dairy products. Further analysis using multiple days of dietary information is warranted to examine the diet quality on a population level against the current dietary guidelines. Another potential limitation was the use of self-report to estimate food consumption. Further, as highlighted by the ABS, there appears to be a high level of under-reporting of energy intake for both males and females( 8 ). Further work into the impact of under-reporting on the change in consumption patterns of different foods from the survey results is underway.
To date, our study is the first one to investigate detailed meal composition in the Australian population using nationally representative data. Improving diet is a crucial factor to prevent and/or manage many chronic health outcomes. Hence, understanding the meal composition is important before designing dietary interventions or treatments to improve diet quality and to support the development of more realistic strategies towards healthier meals. Future nutritional advice considering a meals-based approach might be more practical and make it easier for the population to understand and follow dietary guidelines.
Acknowledgements
Acknowledgements: The authors thank the ABS for permission to use the 2011–12 NNPAS data set. Financial support: This research was funded by Meat and Livestock Australia, but the sponsors had no input into the results presented in the current analysis. Conflict of interest: None. Authorship: Z.S. and A.R. were responsible for data analysis, and together with D.R. interpreted the data and prepared the manuscript. Ethics of human subject participation: Ethics approval for the survey data used in this study was granted by the Australian Government Department of Health and Ageing Departmental Ethics Committee in 2011.
Supplementary material
To view supplementary material for this article, please visit https://doi.org/10.1017/S1368980017000982


