


For many decades, beginning with the altercation between Ancel Keys and John Yudkin( Reference Scrinis 1 ), the scientific community has debated whether the principal driver of obesity is the excessive consumption of fats or carbohydrates( Reference Bray and Popkin 2 – Reference Simpson and Raubenheimer 5 ). Historically, the role of protein has received comparatively little attention, both because it is proportionally a minor part of the energy content in the diet and because its absolute and relative intakes have remained more constant over time and across populations than those of either fats or carbohydrates( Reference Simpson and Raubenheimer 5 – Reference Westerterp-Plantenga 7 ). More recently, however, attention has turned to dietary protein, particularly in the context of body weight management, with specific emphasis on the role of this macronutrient in appetite regulation( Reference Weigle, Breen and Matthys 8 , Reference Astrup, Raben and Geiker 9 ).
The fact that all three macronutrients have now been implicated in obesity suggests that there is a need to broaden the focus from specific nutrients to questions of how each contributes both individually and in interaction with others to drive energy overconsumption. In 2005, Simpson and Raubenheimer postulated the ‘protein leverage hypothesis’ (PLH) to address this issue. Like numerous other animal species( Reference Raubenheimer and Simpson 10 – Reference Raubenheimer, Machovsky-Capuska and Gosby 14 ), human macronutrient regulation minimizes variation in absolute protein intake. Consequently, any factor that causes a decrease in the dietary proportion of protein energy will also result in increased absolute intakes of fats and/or carbohydrates, and total energy; conversely, increased dietary protein will result in decreased energy intake (‘protein leverage’)( Reference Simpson and Raubenheimer 5 , Reference Gosby, Conigrave and Raubenheimer 15 – Reference Martens, Lemmens and Westerterp-Plantenga 18 ). The PLH proposes that this characteristic of human macronutrient regulation has interacted with an extrinsic cause of dietary protein dilution, for example increased availability of cheap low-protein foods, to drive energy overconsumption and the rise in obesity( Reference Simpson and Raubenheimer 5 , Reference Raubenheimer, Machovsky-Capuska and Gosby 14 ).
Protein leverage in human subjects is supported by a recently published compendium of experimental studies( Reference Gosby, Conigrave and Raubenheimer 15 ), which shows how decreases in percentage of protein across the range typically seen in human populations with adequate food supply (10–25 % of total energy from protein) resulted in increased intake of energy in the form of either carbohydrates or fat( Reference Simpson and Raubenheimer 5 ). Increases above 20 % protein yielded a lesser rate of decline in energy intake than from 10 to 20 %( Reference Gosby, Conigrave and Raubenheimer 15 ), as was also found in controlled trials with diets of disguised macronutrient content( Reference Gosby, Conigrave and Lau 16 ). A recent experimental study, also using diets of disguised macronutrient content, showed an approximately linear increase in both energy intake and body weight change as dietary protein decreased from 25 % to 15 % and 10 % of energy( Reference Campbell, Raubenheimer and Badaloo 17 ). Another experimental study found that relative to 15 % of energy from protein, energy intakes were reduced on a diet of 30 % protein, as predicted by the PLH, but not increased on a diet of 5 % protein( Reference Martens, Lemmens and Westerterp-Plantenga 18 ). A likely explanation for this is that 5 % of energy from protein is lower than seen naturally in human populations with food sufficiency and outside the range of diets to which the species is evolutionarily adapted( Reference Raubenheimer, Machovsky-Capuska and Gosby 14 , Reference Gosby, Conigrave and Raubenheimer 15 ). Population-level data also support the PLH. In the USA, according to FAOSTAT nutrient availability estimates( 6 ), the dietary protein content gradually decreased from 14 % of total energy in 1961 to 12·5 % in 2000. In this situation, maintaining the absolute protein intake relatively constant required a 14 % total increase in fat and carbohydrate consumption( Reference Simpson and Raubenheimer 5 ). Another study carried out in the USA with data from the National Health and Nutrition Examination Survey (NHANES) estimated that the drop in relative dietary protein content in normal-weight men from 15·9 % in 1971–1975 to 15·4 % in 2005–2006 was associated with a 10 % increase in total daily energy intake( Reference Austin, Ogden and Hill 19 ).
Evidence exists that global food supplies are increasingly becoming dominated by ultra-processed food and drink products( Reference Stuckler, McKee and Ebrahim 20 – 24 ). These are industrial formulations manufactured mostly or entirely from ingredients derived from constituents of foods and additives. These components are blended and processed to make ultra-processed foods hyper-palatable, provide novel sensory experiences and even imitate sensorial qualities of unprocessed or minimally processed foods and their culinary preparations, amplifying reward and suppressing satiety( Reference Monteiro, Levy and Claro 25 – 27 ). Given the disparity in cost of the different macronutrients, it makes economic sense for food processors to replace expensive protein with cheaper carbohydrates and fats( Reference Brooks, Simpson and Raubenheimer 28 ). Ultra-processed food and drink products could therefore play an important role in determining the relative dietary protein content (% of total energy intake), trapping people in a suboptimal diet in which attempting to maintain absolute protein intake drives an increase in energy intake( Reference Simpson and Raubenheimer 5 ).
In the present study, we examine how the consumption of ultra-processed food and drink products (hereafter denoted simply as ‘ultra-processed foods’) is associated with the relative dietary protein content and the absolute energy and protein intakes of the US diet, and test whether the relationships fit the predictions of the PLH model.
Materials and methods
Data source, population and sampling
We used nationally representative data from the 2009–2010 NHANES, specifically the dietary component What We Eat in America( 29 ).
NHANES is a continuous, nationally representative, cross-sectional survey of non-institutionalized, civilian US residents( Reference Johnson, Paulose-Ram and Ogden 30 ). The NHANES sample was obtained by using a complex, stratified, multistage probability cluster sampling design, based on the selection of counties, blocks, households and the number of people within households( Reference Johnson, Paulose-Ram and Ogden 30 ). To improve the estimate precision and reliability, NHANES 2009–2010 oversampled the following subgroups: Hispanic, non-Hispanic Black, non-Hispanic White and Other persons at or below 130 % of the federal poverty level; and non-Hispanic White and Other persons aged ≥80 years( Reference Johnson, Paulose-Ram and Ogden 30 ).
The survey included an interview conducted in the home and a subsequent health examination performed at a mobile examination centre. All NHANES examinees were eligible for two 24 h dietary recall interviews. The first dietary recall interview was collected in-person in the mobile examination centre( 31 ), while the second was collected by telephone 3 to 10 d later( 32 ). Dietary interviews were conducted by trained interviewers using the validated( Reference Moshafegh, Rhodes and Baer 33 – Reference Rumpler, Kramer and Rhodes 35 ) US Department of Agriculture Automated Multiple-Pass Method( 36 ). For children under 9 years of age, the interview was conducted with a proxy; for children between 6 and 8 years of age, in the presence of the child. Children aged 9 to 11 years provided their own data assisted by an adult household member (assistant). The preferred proxy/assistant was the most knowledgeable person about the child’s consumption the day before the interview. If the child had more than one caregiver, several individuals could contribute to the intake data( 31 , 32 ).
Among the 13 272 people screened in NHANES 2009–2010, 10 537 (79·4 %) participated in the household interview and 10 253 (77·3 %) also participated in the health examination at the mobile examination centre( 37 ). Of these, 9754 individuals provided one day of complete dietary intakes and 8406 provided two days( 38 ).
We evaluated 9042 survey participants aged ≥2 years who had at least one day of 24 h dietary recall data and had not been breast-fed on either of the two days. These individuals had similar sociodemographic characteristics (in terms of gender, age, race/ethnicity, family income and education) to the full sample of 9787 interviewed participants aged ≥2 years.
Food classification according to processing
We classified all recorded food items (4981 different Food Codes were consumed in cycle 2009–2010) according to NOVA, a food classification based on the extent and purpose of industrial food processing( Reference Monteiro, Levy and Claro 25 , Reference Monteiro, Cannon and Levy 26 , Reference Moubarac, Parra and Cannon 39 ). This classification includes four groups: ‘unprocessed or minimally processed foods’ (such as fresh, dry or frozen fruits and vegetables; packaged grains and pulses; grits, flakes or flours made from corn, wheat or cassava; pasta, fresh or dry, made from flours and water; eggs; fresh or frozen meat and fish; and fresh or pasteurized milk); ‘processed culinary ingredients’ (including sugar, oils, fats, salt and other substances extracted from foods and used in kitchens to season and cook unprocessed or minimally processed foods and to make culinary preparations); ‘processed foods’ (including canned foods, sugar-coated dry fruits, salted meat products, cheeses and freshly made unpackaged breads, and other ready-to-consume products manufactured with the addition of salt or sugar or other substances of culinary use to unprocessed or minimally processed foods); and ‘ultra-processed foods’.
The group of ultra-processed foods, of particular interest in the present study, includes soft drinks, sweet or savoury packaged snacks, confectionery and industrialized desserts, mass-produced packaged breads and buns, poultry and fish nuggets and other reconstituted meat products, instant noodles and soups, and many other ready-to-consume formulations of several ingredients. Besides salt, sugar, oils and fats, these ingredients include food substances not commonly used in culinary preparations, such as modified starches, hydrogenated oils, protein isolates and additives, whose purpose is to imitate sensorial qualities of unprocessed or minimally processed foods and their culinary preparations, or to disguise undesirable qualities of the final product, such as colorants, flavourings, non-sugar sweeteners, emulsifiers, humectants, sequestrants, and firming, bulking, de-foaming, anti-caking and glazing agents. A detailed definition of each NOVA food group and examples of food items classified in each group are shown elsewhere( Reference Martinez Steele, Baraldi and Louzada 40 ). The rationale underlying the classification is described elsewhere( Reference Moodie, Stuckler and Monteiro 22 , Reference Monteiro 41 – Reference Monteiro, Cannon and Levy 43 ).
For all food items (Food Codes) judged to be a hand-made recipe, the classification was applied to the underlying ingredients (Standard Reference Codes (SR Codes)) obtained from the US Department of Agriculture Food and Nutrient Database for Dietary Studies (FNDDS) version 5.0( Reference Ahuja, Montville and Omolewa-Tomobi 44 ). Further details have been published previously( Reference Martinez Steele, Baraldi and Louzada 40 ).
Assessing energy and protein contents
For the present study, we used Food Code energy values as provided by NHANES.
For hand-made recipes, we calculated the underlying ingredient (SR Code) energy and protein values using variables from both the FNDDS version 5.0( Reference Ahuja, Montville and Omolewa-Tomobi 44 ) and the US Department of Agriculture National Nutrient Database for Standard Reference, Release 24 (SR24)( 45 ).
Protein intake was converted into MJ using the conversion factor 0·016736 MJ/g.
Data analysis
We used all available dietary data for each participant, using means of both recall days when available (86 % of participants). Food items were sorted into mutually exclusive food subgroups within unprocessed or minimally processed foods (n 11), processed culinary ingredients (n 4), processed foods (n 4) and ultra-processed foods (n 17), as shown in Table 1. First, we evaluated the contributions of each of the NOVA food groups and subgroups to total energy and protein intakes. Thereafter, we calculated the average relative protein content, expressed as a proportion of total energy intake, in the overall US diet and in fractions of this diet composed by each of the NOVA food groups and subgroups. We also calculated the relative protein content of the group of unprocessed or minimally processed foods combined with the group of processed culinary ingredients, as the items belonging to these two groups are usually combined in culinary preparations and therefore consumed together.
Table 1 Distribution of total energy and protein intakes according to NOVA food groups, and mean protein content of each food group. US population aged ≥2 years (n 9042), National Health and Nutrition Examination Survey 2009–2010
* Including nuts and seeds (unsalted); yeast; dried fruits (without added sugars) and vegetables; non-pre-sweetened, non-whitened, non-flavoured coffee and tea; coconut water and flesh; home-made soup and sauces; flours; tapioca.
† Including honey, molasses, maple syrup (100 %).
‡ Including butter, lard and cream.
§ Including starches; coconut and milk cream; baking chocolate, cocoa powder and gelatine powder; vinegar; baking powder and baking soda.
║ Including salted or sugared nuts and seeds; peanut, sesame, cashew and almond butter or spread; beer and wine.
¶ Including energy drinks, sports drinks, non-alcoholic wine.
** Including ready-to-eat and dry-mix desserts such as pudding.
†† Including soya products such as meatless patties and fish sticks; baby food and baby formula; dips, spreads, mustard and catsup; margarine; sugar substitutes, sweeteners and all syrups (excluding 100 % maple syrup); distilled alcoholic drinks.
We used Gaussian regression to estimate the association of the dietary contribution of ultra-processed foods with the relative dietary protein content (% of total energy intake) and the absolute energy (MJ) and protein intakes (MJ). Dietary contribution of ultra-processed foods was transformed using restricted cubic spline functions to allow for non-linearity.
Crude and adjusted average dietary protein content and absolute energy and protein intakes were compared across quintiles of the dietary contribution of ultra-processed foods. Poisson regression was used to evaluate whether the percentage of individuals with relative dietary protein contents lower than 20 %, 15 % or 10 % of total energy intake decreased across quintiles( Reference Barros and Hirakata 46 ). This decrease was also assessed across demographic subgroups in stratified analysis. Tests of linear trend were performed to evaluate the effect of quintiles as a single continuous variable.
All regression models were adjusted for race/ethnicity (Mexican-American, Other Hispanic, non-Hispanic White, non-Hispanic Black, Other Race including Multi-racial), ratio of family income to poverty (categorized based on Supplemental Nutrition Assistance Program eligibility as 0·00–1·30, >1·30–3·50 and ≥3·50)( 29 ) and educational attainment of respondents for participants aged ≥20 years and of the household reference person otherwise (<12 years, 12 years and >12 years). To take account of different dietary protein content requirements according to age group (5–20, 10–20 or 10–35 % of total energy), different daily protein intake requirements according to sex–age groups (0·2176, 0·3179, 0·569, 0·7699, 0·8703, 0·9372 or 1·1883 MJ) and different daily energy intake requirements according to sex–age–physical activity level groups (4·184, 5·0208, 5·8576, 6·6944, 7·5312, 8·368, 9·2048, 10·0416, 10·8784, 11·7152, 12·552 or 13·3888 MJ)( 47 ), analyses using relative dietary protein content, protein daily intake or energy daily intake as outcomes were accordingly adjusted for these requirements (as dummy variables). As 886 participants had missing values on family income and/or education, adjusted analyses included 8156 individuals. Analysis also adjusting for daily energy intake requirements included 8128 because thirty-one had missing values for physical activity. As the included sample differs across models, results may not always be comparable.
NHANES survey sample weights were used in all analyses to account for differential probabilities of selection for the individual domains, non-response to survey instruments, and differences between the final sample and the total US population. The Taylor series linearization was used for variance estimation to account for the complex sample design and the sample weights( Reference Johnson, Paulose-Ram and Ogden 30 ).
Statistical hypotheses were tested using a two-tailed P<0·01 level of significance. Data were analysed using the Stata statistical software package version 12.1.
Results
Distribution of total energy intake by food group
The average US daily energy intake in 2009–2010 was 8·6 MJ, with nearly 3 in 5 MJ (57·6 %) coming from ultra-processed foods (Table 1). Unprocessed or minimally processed foods contributed 30·1 % of total energy intake, processed foods an additional 9·4 % and processed culinary ingredients the remaining 2·9 %. The most common ultra-processed foods in terms of energy contribution were breads; soft and fruit drinks; cakes, cookies and pies; salty snacks; frozen and shelf-stable plate meals; pizza; and breakfast cereals. Meat, fruit and milk provided the most energy among unprocessed or minimally processed foods; ham and cheese, the most energy among processed foods; and table sugar and plant oils, the most energy among processed culinary ingredients.
Distribution of total protein intake by food group
The average US daily protein intake corresponded to 1·3 MJ (Table 1) and almost half (48·7 %) of this intake came from unprocessed or minimally processed foods. Ultra-processed foods contributed 38·3 %, processed foods an additional 12·8 % and the remaining 0·2 % of the protein intake came from processed culinary ingredients. The main sources of protein among unprocessed or minimally processed foods were meat, milk, eggs and fish, while among processed foods they were cheeses and ham and among ultra-processed foods they were breads and frozen and shelf-stable plate meals.
The average protein content in ultra-processed foods (9·5 % of total energy intake) was less than half that in both processed foods (24·3 %) and unprocessed or minimally processed foods and processed culinary ingredients grouped together (25·3 %; Table 1).
Association between dietary contribution of ultra-processed foods and overall dietary protein content
The unadjusted restricted cubic spline Gaussian regression analysis showed an inverse linear association between the dietary contribution of ultra-processed foods and the overall dietary protein content (both expressed as % of total energy intake; coefficient for linear term=−0·08; 95 % CI −0·13, −0·03; Fig. 1). The strength of the association remained similar after adjusting for the sex–age dummies corresponding to groups with different protein content requirements, race/ethnicity, family income and education (coefficient for linear term=−0·07; 95 % CI −0·12, −0·02; Wald test for linear term P=0·008; Wald test for all non-linear terms P=0·05). Overall, each increase of 14 percentage points in dietary contribution of ultra-processed foods was associated with 1 percentage point lower relative dietary protein content.
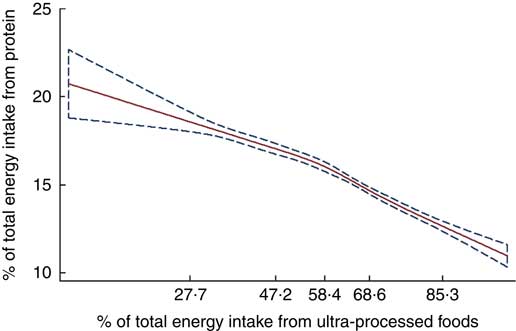
Fig. 1 Regression of dietary protein content v. the dietary contribution of ultra-processed foods evaluated by restricted cubic splines (![]() , predicted values;
, predicted values; ![]() , 95 % CI), among the US population aged ≥2 years (n 9042), National Health and Nutrition Examination Survey 2009–2010. The values shown on the x-axis correspond to the 5th, 27·5th, 50th, 72·5th and 95th percentiles for percentage of total energy from ultra-processed foods (knots). Coefficient for linear term=−0·08 (95 % CI −0·13, −0·03). There was little evidence of non-linearity in the restricted cubic spline model (Wald test for linear term P=0·006; Wald test for all non-linear terms P=0·07)
, 95 % CI), among the US population aged ≥2 years (n 9042), National Health and Nutrition Examination Survey 2009–2010. The values shown on the x-axis correspond to the 5th, 27·5th, 50th, 72·5th and 95th percentiles for percentage of total energy from ultra-processed foods (knots). Coefficient for linear term=−0·08 (95 % CI −0·13, −0·03). There was little evidence of non-linearity in the restricted cubic spline model (Wald test for linear term P=0·006; Wald test for all non-linear terms P=0·07)
Consistent with the spline models, across quintiles of the dietary contribution of ultra-processed foods, unadjusted mean dietary protein content decreased substantially and monotonically, from 18·2 % of total energy intake in the lowest quintile to 13·3 % in the highest (Table 2). Across the same quintiles, the proportion of individuals consuming less than 15 % of total energy from protein increased from 25·1 to 73·3 %, respectively. An even more pronounced increase was seen in the proportion of individuals consuming less than 10 % of energy from protein, rising from 2·8 to 14·9 %, respectively. The increases cut across demographic subgroups although they varied somewhat by subgroup (see the online supplementary material, Supplemental Table 1). The magnitude and the statistical significance of the association between the dietary contribution of ultra-processed foods and the overall dietary protein content did not change with adjustment for age groups with different dietary protein content requirements, race/ethnicity, family income and education.
Table 2 Indicators of dietary protein content according to the dietary contribution of ultra-processed foods. US population aged ≥2 years (n 9042), National Health and Nutrition Examination Survey 2009–2010
* Significant linear trend across all quintiles (P≤0·001).
† Adjusted for protein % requirements (dummy variables), race/ethnicity (Mexican-American, Other Hispanic, non-Hispanic White, non-Hispanic Black and Other Race – including Multi-racial), ratio of family income to poverty (categorized based on Supplemental Nutrition Assistance Program eligibility as 0·00–1·30, >1·30–3·50 and ≥3·50) and educational attainment (<12 years, 12 years and >12 years).
‡ PR=prevalence ratios estimated using Poisson regression.
§ PRadj=prevalence ratios adjusted for percentage protein requirements (dummy variables), race/ethnicity, ratio of family income to poverty and educational attainment as above (n 8156).
Association between dietary contribution of ultra-processed foods and absolute energy and protein intakes
Restricted cubic spline Gaussian analysis suggested a non-linear association of dietary contribution of ultra-processed foods with absolute energy intake (Fig. 2(a)), especially the adjusted model (coefficient for linear term=0·044; 95 % CI 0·012, 0·076; Wald test for linear term P=0·01; Wald test for all non-linear terms P=0·009). Total energy intake rose with increases in the dietary contribution of ultra-processed foods up until this contribution reached nearly 70 % of total energy intake. Further increases in the contribution of ultra-processed foods were associated with slight reductions in total energy intake. These results were consistent with the analysis across quintiles of the dietary contribution of ultra-processed foods (Table 3), which showed that adjusted mean energy intake increased between the first (8·2 MJ) and the fourth quintiles (8·9 MJ) while decreasing slightly in quintile 5 (8·8 MJ). Despite the statistically non-significant slight decrease in energy intake between quintiles 4 and 5 (adjusted Wald test P=0·5), there was an overall positive significant linear trend across all quintiles (P<0·001).
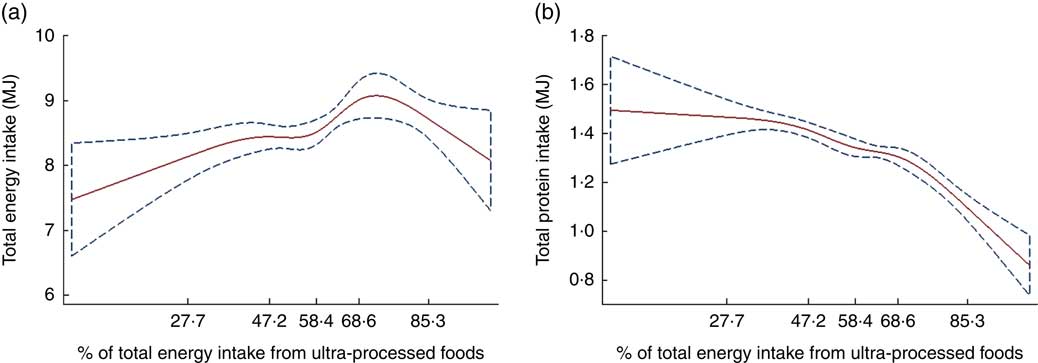
Fig. 2 Regression of total energy intake and total protein intake v. the dietary contribution of ultra-processed foods, evaluated by restricted cubic splines (![]() , predicted values;
, predicted values; ![]() , 95 % CI), among the US population aged ≥2 years (n 9042), National Health and Nutrition Examination Survey 2009–2010. (a) The values shown on the x-axis correspond to the 5th, 27·5th, 50th, 72·5th and 95th percentiles for percentage of total energy from ultra-processed foods (knots). Coefficient for linear term=0·024 (95 % CI 0·002, 0·046). There was little evidence of linearity in the restricted cubic spline model (Wald test for linear term P=0·035; Wald test for all non-linear terms P=0·049). (b) The values shown on the x-axis correspond to the 5th, 27·5th, 50th, 72·5th and 95th percentiles for percentage of total energy from ultra-processed foods (knots). Coefficient for linear term=−0·001 (95 % CI −0·007, 0·004). There was little evidence of linearity in the restricted cubic spline model (Wald test for linear term P=0·7; Wald test for all non-linear terms P=0·0009; Wald test for all terms P<0·001)
, 95 % CI), among the US population aged ≥2 years (n 9042), National Health and Nutrition Examination Survey 2009–2010. (a) The values shown on the x-axis correspond to the 5th, 27·5th, 50th, 72·5th and 95th percentiles for percentage of total energy from ultra-processed foods (knots). Coefficient for linear term=0·024 (95 % CI 0·002, 0·046). There was little evidence of linearity in the restricted cubic spline model (Wald test for linear term P=0·035; Wald test for all non-linear terms P=0·049). (b) The values shown on the x-axis correspond to the 5th, 27·5th, 50th, 72·5th and 95th percentiles for percentage of total energy from ultra-processed foods (knots). Coefficient for linear term=−0·001 (95 % CI −0·007, 0·004). There was little evidence of linearity in the restricted cubic spline model (Wald test for linear term P=0·7; Wald test for all non-linear terms P=0·0009; Wald test for all terms P<0·001)
Table 3 Total energy and protein intakes according to the dietary contribution of ultra-processed foods. US population aged ≥2 years (n 9042), National Health and Nutrition Examination Survey 2009–2010
* Significant linear trend across all quintiles (P≤0·001).
† Adjusted for energy requirements (dummy variables), race/ethnicity (Mexican-American, Other Hispanic, non-Hispanic White, non-Hispanic Black and Other Race – including Multi-racial), ratio of family income to poverty (categorized based on Supplemental Nutrition Assistance Program eligibility as 0·00–1·30, >1·30–3·50 and ≥3·50) and educational attainment (<12 years, 12 years and >12 years).
‡ Adjusted for absolute protein requirements (dummy variables), race/ethnicity, ratio of family income to poverty and educational attainment as above.
In combination with falling relative dietary protein content and rising total energy intake, total protein intake remained much the same with increases in the dietary contribution of ultra-processed foods up until this contribution reached nearly 40 % of total energy intake. Further increases in the contribution of ultra-processed foods were first associated with slight declines in total protein intake (up to the point that ultra-processed foods represented nearly 70 % of total energy intake) and then with greater declines as ultra-processed energy intakes fell away (Fig. 2(b)). Similar results were obtained in adjusted models (coefficient for linear term=0·002; 95 % CI −0·005, +0·008; Wald test for linear term P=0·5; Wald test for all non-linear terms P<0·001). Adjusted mean total protein intake changed little from the first to the third quintiles of dietary contribution of ultra-processed foods while a slight decline was observed from the third to the fifth quintile (Table 3).
The protein leverage hypothesis
Figure 3 presents a synthesis of our results which addresses the protein leverage model. The positively sloped radials show the ratio of protein energy to non-protein energy in the diet, and the negative diagonals show the total energy intakes associated with each quintile of the dietary contribution of ultra-processed foods. The vertical black line represents the prediction under 100 % protein energy prioritization (i.e. constant absolute protein energy intake leverages excess non-protein energy intake), assuming a target protein energy intake of 1·4 MJ (determined as quintile 1 adjusted mean, Table 3). The horizontal black line represents the model of 100 % non-protein prioritization, assuming a non-protein energy intake target of 6·7 MJ (quintile 1 adjusted mean). The black negative diagonal line represents the third alternative model of total energy prioritization (i.e. constant total energy intake regardless of the relative dietary protein content), assuming in this illustrative case a total energy intake target of 8·2 MJ (quintile 1 adjusted mean value).
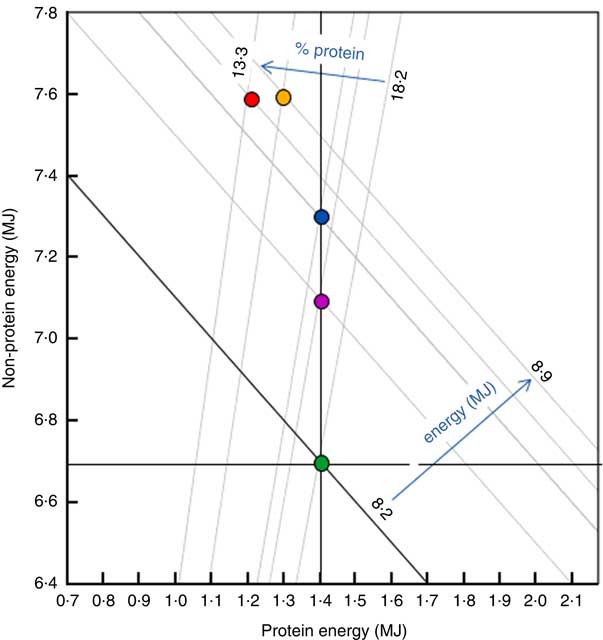
Fig. 3 Macronutrient and energy correlates of the dietary contribution of ultra-processed foods (discretized into quintiles: ![]() , 1;
, 1; ![]() , 2;
, 2; ![]() , 3;
, 3; ![]() , 4;
, 4; ![]() , 5). The negatively sloped diagonals represent daily total energy intakes (calculated as the sum of X +Y) and the positive radials represent the ratio of dietary protein energy to non-protein energy (X/Y). The dark vertical, horizontal and diagonal lines represent alternative models to explain the data. Vertical: complete protein prioritization, in which absolute protein energy intake remains constant with decreasing dietary percentage of protein. Under this scenario, a decrease in dietary percentage of protein (upper blue arrow) leads to an increase in total energy intake (lower blue arrow). Horizontal: complete non-protein prioritization, in which non-protein energy intake remains constant and protein energy intake changes with decreasing dietary percentage of protein. Diagonal: total energy prioritization, in which decreasing dietary percentage of protein is associated with counter-balancing changes in protein and non-protein energy intakes, such that total energy intake is not affected by increasing ultra-processed food contribution in the diet. The data closely fit the protein prioritization model
, 5). The negatively sloped diagonals represent daily total energy intakes (calculated as the sum of X +Y) and the positive radials represent the ratio of dietary protein energy to non-protein energy (X/Y). The dark vertical, horizontal and diagonal lines represent alternative models to explain the data. Vertical: complete protein prioritization, in which absolute protein energy intake remains constant with decreasing dietary percentage of protein. Under this scenario, a decrease in dietary percentage of protein (upper blue arrow) leads to an increase in total energy intake (lower blue arrow). Horizontal: complete non-protein prioritization, in which non-protein energy intake remains constant and protein energy intake changes with decreasing dietary percentage of protein. Diagonal: total energy prioritization, in which decreasing dietary percentage of protein is associated with counter-balancing changes in protein and non-protein energy intakes, such that total energy intake is not affected by increasing ultra-processed food contribution in the diet. The data closely fit the protein prioritization model
The data strongly suggest protein prioritization, as demonstrated in experimental studies( Reference Gosby, Conigrave and Raubenheimer 15 – Reference Martens, Lemmens and Westerterp-Plantenga 18 ), which is consistent with the PLH. First, absolute protein energy intakes were relatively constant (vertical black line) across ultra-processed food dietary contribution quintiles, consistent with the strong human protein appetite. Second, as the percentage of dietary energy from protein decreased (positive radials, 18·2–13·3 %), in this case corresponding with increasing ultra-processed food consumption (quintiles 1–5), the intake of non-protein energy and consequently total energy (negative diagonals, 8·2–8·8 MJ) increased. There is, by contrast, no correspondence to the prediction of non-protein prioritization (in which non-protein energy intake remains constant across ultra-processed food quintiles) or total energy prioritization (where total energy intake is independent of macronutrient ratios, in which case the points for ultra-processed food quintiles would align along the black negative diagonal).
Discussion
In the present analysis of nationally representative data, we provide evidence that ultra-processed foods represent almost 60 % of all energy intake in the US diet and contribute less than 40 % of all protein. Protein represented 1 of every 10 MJ in the average ultra-processed food (9·5 %), far lower than the protein content in either processed foods (24·3 %) or unprocessed or minimally processed foods and processed culinary ingredients grouped together (25·3 %). A strong inverse relationship was found between the dietary contribution of ultra-processed foods and the overall dietary protein content. Moreover, the probability of dietary protein content below 15 % increased three times from the lowest to the highest quintile of the dietary contribution of ultra-processed foods and six times for dietary protein content below 10 %. Consistent with the PLH, we observed that increases in the dietary contribution of ultra-processed foods were associated with a dilution of dietary protein density and a rise in total energy intake, while absolute protein intake remained relatively constant. This was seen for increases in ultra-processed food consumption up to values corresponding to approximately 70 % of total energy intake, or up to values found among four-fifths of the US population. Beyond this point, rises in dietary contribution of ultra-processed foods yielded slight drops in both total energy and protein intakes. A possible explanation for the latter result may be limits in increasing energy intake after a certain level (e.g. as discussed elsewhere( Reference Gosby, Conigrave and Raubenheimer 15 )) and other mechanisms triggered by consequences of excessive energy intake such as the accumulation of adipose tissue.
To our knowledge, the present study is the first to establish the relationship of the dietary contribution of ultra-processed foods with the overall dietary protein content and the absolute energy and protein intakes in the USA.
A modest elevation in dietary protein concentration, which could be achieved by a reduction in the consumption of ultra-processed foods, has been predicted by Simpson and Raubenheimer( Reference Simpson and Raubenheimer 5 ) to alleviate the problems of energy overconsumption. At a mechanistic level, this follows both because of protein’s influence on appetite control systems, through reduced postprandial hunger and increased postprandial satiety( Reference Weigle, Breen and Matthys 8 , Reference Gosby, Conigrave and Lau 16 ), and a concomitant reduction in hyper-palatability from highly palatable, energy-dense fats and sugars, which might also induce energy overconsumption. Our study shows that both processed foods and unprocessed or minimally processed foods combined with processed culinary ingredients provide more than twice as much protein per unit of energy than ultra-processed foods. A reduction in ultra-processed foods should also increase the intake of more healthful, minimally processed foods such as milk, fruits and nuts, and freshly prepared dishes based on whole grains and vegetables, which would provide additional health benefits( Reference Solon-Biet, Mitchell and de Cabo 48 ).
Few studies have assessed the impact of food processing levels on the protein nutrient profile of the US diet. One study( Reference Eicher-Miller, Fulgoni and Keast 49 ) based on NHANES 2003–2008 data employed a food classification system( 50 ) including two food groups which are mostly ultra-processed foods (‘Mixtures of combined ingredients’ and ‘Ready-to-eat’). That study showed that these two food groups together contributed about half of total energy intake and 40 % of energy intake from protein. An investigation in Canada, using 2001 household purchasing data, found that ultra-processed foods are low in protein and that the relative dietary protein content also decreased linearly across quintiles of the dietary contribution from ultra-processed foods (from 14·9 to 11·6 % of total energy)( Reference Moubarac, Martins and Claro 51 ). Being based on household purchasing data, that prior study and others based on the NOVA classification system( Reference Monteiro, Moubarac and Cannon 23 , Reference Monteiro, Levy and Claro 25 , Reference Monteiro, Levy and Claro 52 – Reference Canella, Levy and Martins 54 ) could not evaluate fraction of wasted food nor purchases at restaurants, which represent a substantial proportion of US energy intake. A study carried out in Brazil with dietary consumption data from 2008–2009 also found a linear drop in protein content across quintiles of ultra-processed food consumption, from 19·3 to 14·8 %( Reference Louzada, Martins and Canella 55 ). Our findings build upon and considerably extend these prior reports by evaluating food processing and protein intake using contemporary, nationally representative dietary intake data in the USA.
Our study has several strengths. We tested an a priori prediction of the PLH using data for a large, nationally representative sample of the US population, increasing generalizability. Our investigation was based on individual consumption data, rather than household purchasing data which do not evaluate the fraction of wasted food nor purchases at restaurants.
Potential limitations should be considered. As with most population dietary measures, data obtained by 24 h recalls are imperfect( Reference Subar, Freedman and Tooze 56 ), although the standardized methods and approach of NHANES and use of two recalls per person minimize potential error and bias. Even though some authors have recommended not using self-reported energy intake as a measure of true energy intake( Reference Subar, Freedman and Tooze 56 , Reference Dhurandhar, Schoeller and Brown 57 ), it must be noted that the primary aim of the present study was not to estimate true energy intakes but rather differences in energy intake across levels of ultra-processed food consumption. Some people (e.g. obese) may under-report food intake( Reference Murakami and Livingstone 58 , Reference Murakami and Livingstone 59 ) and more specifically fat intake( Reference Moshafegh, Rhodes and Baer 33 , Reference Livingstone and Black 60 ) or consumption of foods with caloric sweeteners( Reference Bingham, Luben and Welch 61 ) such as desserts and sweet baked goods( Reference Lafay, Mennen and Basdevant 62 , Reference Pryer, Vrijheid and Nichols 63 ), which may lead to an underestimation of total energy intake or an overestimation of the percentage of energy contributed by protein. This might lead us to underestimate the association of the dietary contribution of ultra-processed foods with energy intake if high consumers of ultra-processed foods tend to be overweight( Reference Louzada, Baraldi and Steele 64 ) and these, in turn, tend to be under-reporters. If so, this sort of bias would only work against the PLH. Although NHANES collects some information indicative of food processing (i.e. place of meals, product brands), these data are not consistently determined for all food items which may result in errors in food group classification. Also, the number of food items reported in NHANES is smaller than the number available in the marketplace, and national food composition data are imprecise and not updated as required( Reference Slining, Yoon and Davis 65 ).
Conclusion
In conclusion, we found that ultra-processed foods have lower protein content when compared with both processed foods and unprocessed or minimally processed foods combined with processed culinary ingredients; and also that their dietary contribution is associated with reduced relative protein content in the diet. Consistent with the PLH, the dilution of the overall dietary protein content in the US diet by ultra-processed foods is associated with higher total energy intake, while the absolute protein intake remains relatively constant. Therefore, reducing the contribution of ultra-processed foods in the US diet may be an effective way to increase its dietary protein concentration and prevent excessive energy intake.
Acknowledgements
Financial support: This research received funding from Conselho Nacional de Desenvolvimento Científico e Tecnológico, Edital MCTI/CNPq/Universal (Processo CNPq nº 443477/2014-0) and from Fundação de Amparo à Pesquisa do Estado de São Paulo (Processo FAPESP nº 2015/14900-9). CNPq and FAPESP had no role in the design analysis or writing of this article. Conflict of interest: All authors declare no potential conflicts of interest for the submitted work. Authorship: E.M.S. and C.A.M. designed the research; E.M.S., D.R., S.J.S., L.G.B. and C.A.M. analysed the data; E.M.S., D.R., S.J.S. and C.A.M. wrote the paper. All authors read and approved the final manuscript. Ethics of human subject participation: NHANES 2009–2010 underwent institutional review board approval and Included written informed consent.
Supplementary material
To view supplementary material for this article, please visit https://doi.org/10.1017/S1368980017001574


