


Introduction
Conservationists need to raise funds and support to tackle the current biodiversity crisis. Environmental NGOs play a major part in achieving this goal (Wright et al., Reference Wright, Veríssimo, Pilfold, Ventre, Cousins and Jefferson2015), often using marketing campaigns to influence the behaviour and spending patterns of their target audience (Veríssimo et al., Reference Veríssimo, Vaughan, Ridout, Waterman, MacMillan and Smith2017). One of the most popular NGO marketing approaches is based on flagships. This involves campaigns that focus on species with traits that appeal to the target audience, with the goal of harnessing their affinity for the flagship to achieve a wider conservation objective (Veríssimo et al., Reference Veríssimo, MacMillan and Smith2011). This approach is especially important for international NGOs that run campaigns targeting a broad audience; many in this audience lack knowledge of the conservation issue highlighted by the campaign but identify with the associated flagship (Smith et al., Reference Smith, Veríssimo, Isaac and Jones2012). These flagships are used in one of three ways to raise funds or awareness: (1) for specific projects to conserve the flagship that also benefit other species sharing its range, (2) for a broader issue using the flagship as the recognizable symbol of the campaign, such as using African elephants Loxodonta africana to stop wildlife trafficking online, or (3) for the NGO directly, using the flagship as the recognizable symbol of the organization (Smith et al., Reference Smith, Veríssimo, Isaac and Jones2012).
Despite the importance of flagship species campaigns, they have limitations, particularly with respect to benefiting biodiversity more broadly. Most campaigns rely on a narrow set of species, especially large, charismatic mammals (Clucas et al., Reference Clucas, McHugh and Caro2008). This can skew priorities and create unintended consequences, with the flagship species receiving the majority of the funds and attention (Joseph et al., Reference Joseph, Maloney, Watson and Possingham2011; Smith et al., Reference Smith, Veríssimo, Isaac and Jones2012). There are ways to tackle this problem, such as using a complementary set of species in a so-called flagship fleet (Veríssimo et al., Reference Veríssimo, Fraser, Girão, Campos, Smith and MacMillan2013), promoting a wider range of charismatic species (Smith et al., Reference Smith, Veríssimo, Isaac and Jones2012; McGowan et al., Reference McGowan, Beaumont, Smith, Chauvenet, Harcourt and Atkinson2020), or putting more marketing effort into promoting less charismatic species (Veríssimo et al., Reference Veríssimo, Vaughan, Ridout, Waterman, MacMillan and Smith2017). However, there is still scope for adopting more creative approaches (Smith et al., Reference Smith, Veríssimo, MacMillan, Leader-Williams, Adams and Smith2010).
One option is using areas as conservation flagships. This diversification has been occurring de facto (Veríssimo et al., Reference Veríssimo, MacMillan and Smith2011), with certain high-profile protected areas acting as so-called celebrity sites (Sandbrook et al., Reference Sandbrook, Cavanagh and Tumusiime2018). Supporting such a conservation area can increase the ecological resilience of neighbouring conservation areas and the wider landscape or seascape, and some organizations use the tourism revenue from these areas to cross-subsidize the rest of their network. However, this approach still resembles the first type of flagship campaign defined above, with the majority of benefits going to the specific conservation area. Another approach could be to adopt the second flagship campaign type, using specific conservation areas as the symbol of campaigns designed to tackle issues that affect broader conservation area networks. These issues include improving management effectiveness, governance and equity at the site level, and increasing ecological representativeness and connectivity at the network level (Maxwell et al., Reference Maxwell, Cazalis, Dudley, Hoffmann, Rodrigues and Stolton2020). Increased resourcing and political support to address these issues would allow conservation areas to fulfil their key roles of conserving biodiversity and maintaining ecosystem services.
This suggests that there would be many benefits to developing campaigns that use conservation area-based flagships. However, this is hindered by the fact that unlike for flagship species, we know little about the factors that drive donor preferences for conservation areas (Veríssimo et al., Reference Veríssimo, MacMillan and Smith2011; Lundberg et al., Reference Lundberg, Vainio, Macmillan, Smith, Veríssimo and Arponen2019). Here, we address this by using a choice experiment to investigate which attributes of conservation areas are likely to appeal to a target audience of UK-based donors. Choice experiments provide insight into how people value goods and services (Louviere & Hensher, Reference Louviere and Hensher1982), and have been widely used to investigate the preferences of donors for different types of conservation projects (Morse-Jones et al., Reference Morse-Jones, Bateman, Kontoleon, Ferrini, Burgess and Turner2012; Zander et al., Reference Zander, Pang, Jinam, Tuen and Garnett2014; Garnett et al., Reference Garnett, Zander, Hagerman, Satterfield and Meyerhoff2018; Lewis et al., Reference Lewis, Young, Gibbons and Jones2018) and of various stakeholder groups for flagship species (Veríssimo et al., Reference Veríssimo, Fraser, Groombridge, Bristol and MacMillan2009, Reference Veríssimo, Fraser, Girão, Campos, Smith and MacMillan2013).
Our study focused on the preferences of UK residents for a selection of attributes related to hypothetical conservation areas in South Africa. The UK was chosen because its population provides a large pool of potential donors: the UK population participates strongly in charitable giving compared to other countries (CAF, 2018) and nearly 10% of the UK's adult population are members of an environmental organization (Cracknell et al., Reference Cracknell, Miller and Williams2013). We chose conservation areas in South Africa because the country is relatively familiar to this UK target audience (Statistics South Africa, 2020) and well-known for its landscape-scale conservation (Lindsey et al., Reference Lindsey, Alexander, Mills, Romañach and Woodroffe2007). We used choice experiments to identify the most important conservation area attributes, together with multinomial logit and latent class modelling to assess how much people are willing to pay for the presence of different conservation area attributes and whether their preferences are affected by their socio-economic characteristics (Hensher et al., Reference Hensher, Rose and Greene2015).
Methods
Choice experiment design
In a choice experiment, respondents are presented with groups of two or more scenarios that are described by differing levels of a set of attributes. Respondents choose their preferred scenario from each group and the relative value placed on each attribute is then calculated from their aggregated responses (Veríssimo et al., Reference Veríssimo, Fraser, Groombridge, Bristol and MacMillan2009). A monetary variable can also be included to facilitate the calculation of willingness to pay values; this is the amount respondents are willing to give up for a step change in the level of each attribute (Mangham et al., Reference Mangham, Hanson and Mcpake2009). Although there can be a disconnect between hypothetical willingness to pay values and the amount people would give in reality, they provide a good indication of relative preferences. Stated choice experiments are an effective method to understand real preferences (Louviere et al., Reference Louviere, Hensher and Swait2000).
We used a choice experiment to assess which attributes of conservation areas drive donor preferences. Through an online questionnaire, we presented respondents with a series of paired hypothetical conservation areas, each of which had differing levels of a specific set of attributes (Table 1). For each pair, we asked respondents to choose the area they would rather donate to in aid of its protection. We labelled the conservation areas A and B to prevent label bias (Veríssimo et al., Reference Veríssimo, Fraser, Groombridge, Bristol and MacMillan2009) and described all areas to be in South Africa, to control for respondents associating the areas with local sites, which could introduce biases such as sentimental value. Each area was associated with a donation amount to calculate willingness to pay values. We did not include a ‘no choice’ option to prevent respondents from earning their reward without weighing up the alternatives, but respondents were informed they were free to stop at any point if the choice-making became too difficult. We also did this because studies have found that respondents disproportionately choose the ‘no choice’ alternative (Meyerhoff & Liebe, Reference Meyerhoff and Liebe2009), especially when faced with complex choices (Boxall et al., Reference Boxall, Adamowicz and Moon2009), which restricts one's ability to assess aggregate trade-offs between attributes.
Table 1 Descriptions of the attributes and levels used in the choice experiment (coding in parentheses), and the socio-economic data collected. Underlined attribute levels are those used as reference levels in the model specification.
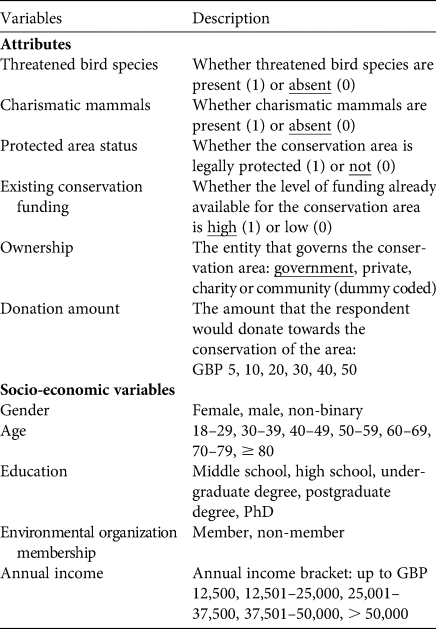
Designing an effective choice experiment requires careful selection of relevant attributes and associated levels (Mangham et al., Reference Mangham, Hanson and Mcpake2009). Conservation areas have a variety of characteristics that we could have tested, but including too many variables in a choice experiment places a heavy cognitive burden on respondents and can produce unreliable results (Mangham et al., Reference Mangham, Hanson and Mcpake2009). Hence, we selected attributes through: (1) a literature review to identify conservation area attributes with the potential to influence preferences, (2) discussing the suitability of these attributes with conservation practitioners working for the NGO BirdLife International, and (3) assessing the shortlist for feasibility in terms of being able to split them into a small number of levels. For example, habitat type within the conservation area (such as a wetland, tropical forest or grassland) was originally identified as an important attribute, but was not feasible to include in the choice experiment because there are many different types of habitat, and a single area can include multiple habitat types.
The final list consisted of five attributes (Table 1): (1) presence or absence of threatened bird species, as the protection of threatened birds can be highly valued in conservation projects (Loomis & White, Reference Loomis and White1996; Lewis et al., Reference Lewis, Young, Gibbons and Jones2018) and the notion of threatened provides a strongly conservation-related attribute, (2) presence or absence of charismatic mammals, as these can be highly valued in flagship species campaigns (Smith et al., Reference Smith, Veríssimo, Isaac and Jones2012) and occur in many South African conservation areas, (3) presence or absence of legal protection, as legal designations can make conservation areas seem more legitimate to donors (Hayes & Ostrom, Reference Hayes and Ostrom2005), (4) high or low existing conservation funding, as some flagship species campaigns highlight level of neglect as a key marketing approach (Veríssimo et al., Reference Veríssimo, Vaughan, Ridout, Waterman, MacMillan and Smith2017), and (5) ownership by government, private entity, charity or community, as this relates to notions of power and accountability (Borrini-Feyerabend & Hill, Reference Borrini-Feyerabend, Hill, Worboys, Lockwood, Kothari, Feary and Pulsford2015) and could affect donor perceptions of how their money would be spent, as well as what the social implications might be. We originally named this final attribute ‘governance’ because this term is used by IUCN when describing oversight of protected area management (Borrini-Feyerabend et al., Reference Borrini-Feyerabend, Dudley, Jaeger, Lassen, Broome, Phillips and Sandwith2013). However, after carrying out a pilot of the choice experiment with a small group of UK residents, we found that ownership type was more clearly understood by respondents.
We recruited respondents for the choice experiment via Prolific (2019b), an online research platform where respondents are paid a small amount for participating in online studies. This ensured that the sample size was large enough to generate reliable model estimates (Bliemer & Rose, Reference Bliemer and Rose2011) and it allowed access to a broad sample of the UK population. Online platforms provide a valid and reliable method of behavioural data collection (Horton et al., Reference Horton, Rand and Zeckhauser2011; Peer et al., Reference Peer, Brandimarte, Samat and Acquisti2017) and we chose Prolific because it has a large proportion of UK-based respondents (Peer et al., Reference Peer, Brandimarte, Samat and Acquisti2017), is specifically designed for academic research, and has ethical standards for respondent payment (Palan & Schitter, Reference Palan and Schitter2018). We recruited 852 UK-based respondents in May 2019 who were paid GBP 0.50 each.
We used NGENE 1.2 to generate an unlabelled choice experiment with a Dz efficient design, assuming a multinomial logit and null (zero) priors (Choicemetrics, 2018). This consisted of 36 choice pairs split into four blocks, so each respondent only answered one block of questions (nine choice pairs) and was less likely to show respondent fatigue (Mangham et al., Reference Mangham, Hanson and Mcpake2009). At the start of the questionnaire, respondents were presented with a table of attribute descriptions. They were then allocated to a block of questions according to their birth month, producing a relatively even spread of respondents across the blocks. We presented the choice pairs in cards that appeared one at a time (Supplementary Fig. 1). The order of the attributes presented on the choice cards was shuffled for every card to prevent location bias (Mangham et al., Reference Mangham, Hanson and Mcpake2009). At the end of the questionnaire, we collected socio-economic data (Table 1).
To ensure validity, we checked all responses for unreasonably short completion times, using two minutes as the minimum required time. We also checked the data for signs of respondent fatigue (Bradley & Daly, Reference Bradley and Daly1994). This would show as straight As or Bs being chosen towards the end of the questionnaire, or it could appear as different attributes determining respondents' choices at the beginning compared with the end of the nine choice questions (Veríssimo et al., Reference Veríssimo, Fraser, Groombridge, Bristol and MacMillan2009). To test for this fatigue, we used χ 2 tests to assess the proportion of As and Bs and the proportion of each binary attribute level chosen at each choice position in the questionnaire.
Econometric data analysis
Choice experiments have a strong grounding in random utility theory (Hensher et al., Reference Hensher, Rose and Greene2015) and it is assumed that an individual's (n) preferences are the sum of a systematic, observable component and a random component:
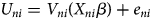 $$U_{ni} = V_{ni}( {X_{ni}\beta } ) + e_{ni}$$
where Uni is the perceived utility of alternative i, Vni is the systematic component of utility that is a function of the attributes (Xni) and a vector of the parameter coefficients that relate to the appeal of the attributes (β), and eni is the random error component (Garnett et al., Reference Garnett, Zander, Hagerman, Satterfield and Meyerhoff2018).
We initially employed the multinomial logit model (Louviere & Hensher, Reference Louviere and Hensher1982) to estimate our data. The model specification for our multinomial logit analysis was:
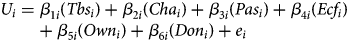 $$U_i = \beta _{1i}( {Tbs_i} ) + \beta _{2i}( {Cha_i} ) + \beta _{3i}( {Pas_i} ) + \beta _{4i}( {Ecf_i} ) + \beta _{5i}( {Own_i} ) + \beta _{6i}( {Don_i} ) + e_i$$
Explanations of the abbreviated attributes are shown in order in Table 1. When specifying the full utility functions for the multinomial logit model, we dropped one level per attribute to avoid collinearity and used this as a reference level (Table 1). Thus, the parameter estimates calculated show preferences in relation to these reference levels. We also determined the mean willingness to pay, which involves calculating the ratio of each attribute's parameter coefficient to the negative of the donation coefficient (Ryan et al., Reference Ryan, Kolstad, Rockers and Dolea2012).
To add greater nuance to our analysis, we constructed a latent class model to identify groups (i.e. preference heterogeneity) within the sample according to respondents' preferences and socio-economic traits (Swait, Reference Swait and Kanninen2007). Each respondent was assumed to belong probabilistically to one of the identified groups (Garnett et al., Reference Garnett, Zander, Hagerman, Satterfield and Meyerhoff2018). When estimating a latent class model, researchers must determine the number of groups, or classes, to be estimated in the model, plus which variables to use to explain class membership. We ran extensive tests using different combinations of socio-economic variables with different numbers of classes and made our class decisions based on an assessment of the statistical fit of the class variables, the statistical information criteria, the class sizes, and the overall model performance (Supplementary Table 1). When interpreting the latent class model results, we looked at the parameter coefficients for each attribute, as while these should not be compared directly across the groups because of confounding scale issues (Magidson & Vermunt, Reference Magidson and Vermunt2007), the relative order of attribute preferences can be compared, where increasing magnitude of parameter coefficients reflects increasingly valued attributes.
Results
Our sample comprised more female than male respondents (69% female), probably because Prolific has slightly more female users (Prolific, 2019a). The median age group was 30–39, and the sample was well educated (61% had at least an undergraduate degree) and relatively wealthy (37% earned > GBP 25,000 per year). The dataset showed no signs of respondent fatigue, suggesting it is a reliable representation of respondent preferences.
Respondent preferences
The multinomial logit model was significant according to the log likelihood-ratio test (Hensher et al., Reference Hensher, Rose and Greene2015) and showed that, in order of highest to lowest willingness to pay, respondents preferred areas that had community ownership, threatened bird species, low existing conservation funding, charismatic mammals and charity ownership (Fig. 1, Table 2). Overall, respondents were willing to pay 40% more for the most preferred attribute compared to the least preferred (Fig. 1).
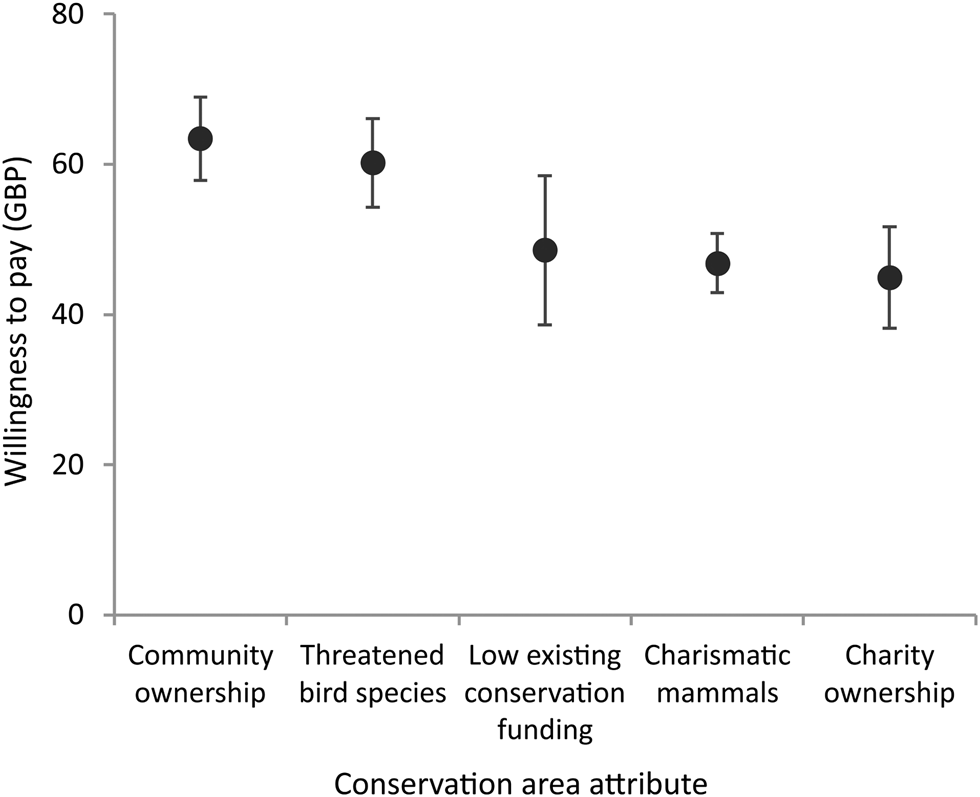
Fig. 1 Mean willingness to pay (with 95% confidence intervals) for the significant conservation area attributes from the multinomial logit model. These model-generated willingness to pay values are indicative of the difference between donor preferences for individual attributes rather than absolute values.
Table 2 Parameter estimates (± SE) for conservation area attribute preferences for the multinomial logit model (MNL) and the latent class model (LCM) with three groups of respondents. For the latent class model, the per cent probability of an individual belonging to each group is shown in parentheses after the group name.
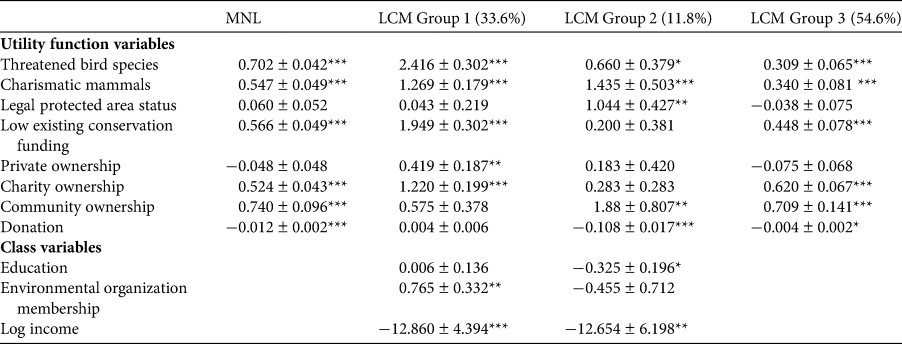
*P < 0.05; **P < 0.01; ***P < 0.001.
Heterogeneity of preferences
Latent class modelling involves allocating respondents probabilistically to the classes (i.e. groups) based on their socio-economic characteristics. Our latent class model consisted of three classes, with education, environmental organization membership and income as class variables (Supplementary Table 1). For Group 1, the latent class probability of membership was c. 33%, with respondents more likely to be in this group if they are a member of an environmental organization and less wealthy, and more likely to prefer areas with threatened bird species, followed by low existing conservation funding, charismatic mammals, and charity or private ownership (Fig. 2, Table 2). The Group 2 latent class probability was c. 12%, with respondents more likely to be less educated and less wealthy, as well as more likely to value community ownership most, followed by charismatic mammals, legal protected area status and threatened bird species (Fig. 2, Table 2). Finally, the Group 3 latent class probability was slightly > 50%, with respondents in this class generally being wealthier and more likely to value community ownership most, followed by charity ownership, low existing conservation funding, and charismatic mammals and threatened bird species (Fig. 2, Table 2).
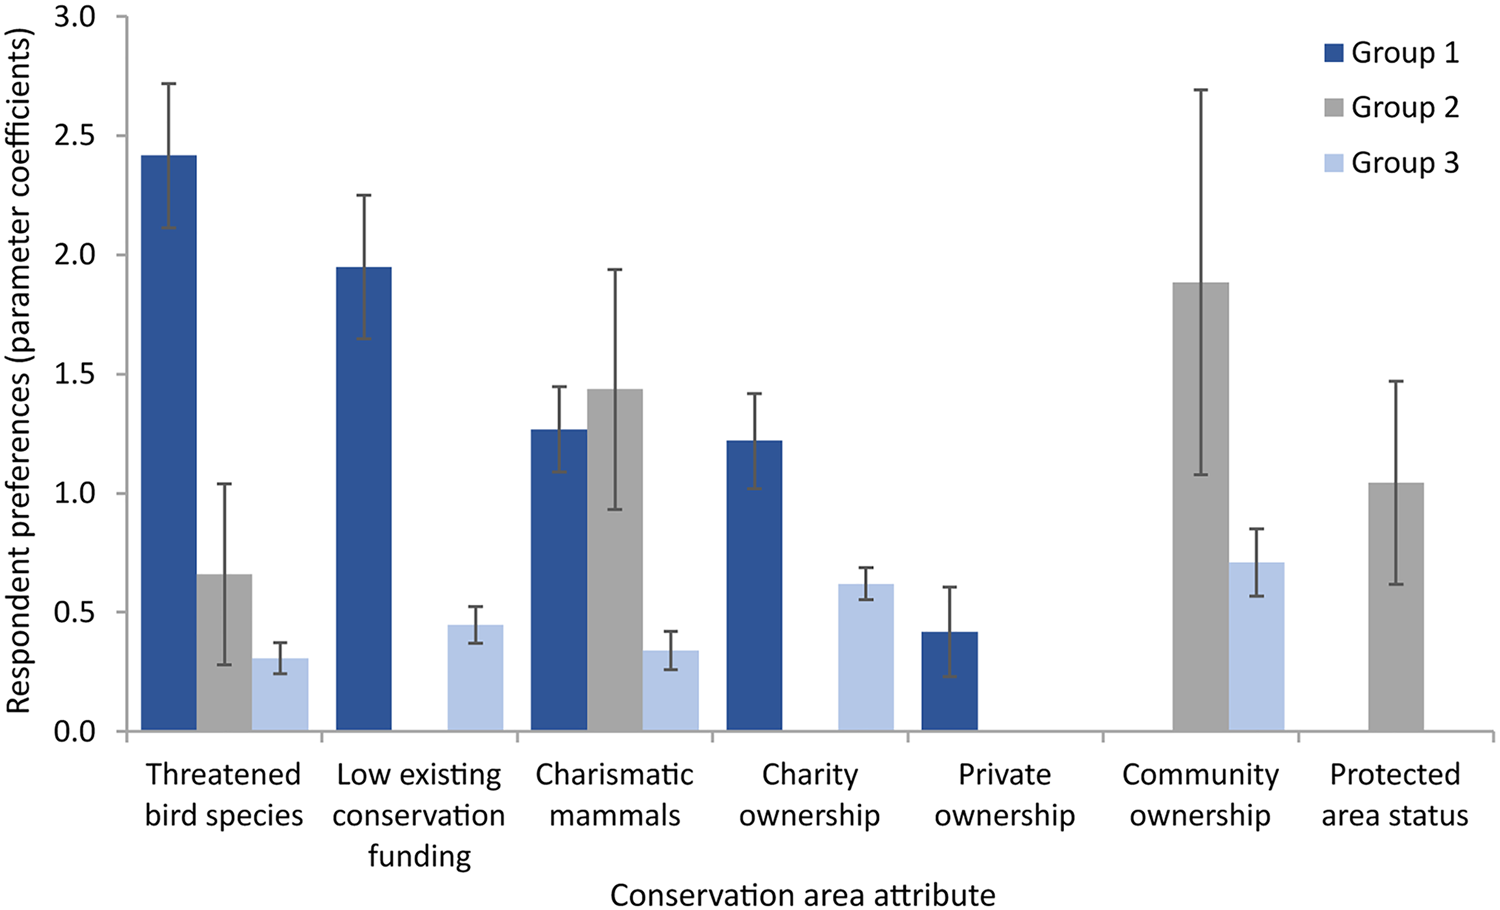
Fig. 2 Relative preferences (± SE) for the significant conservation area attributes in Group 1, 2 and 3 of the latent class model.
The attribute preference order clearly differed between the groups (Fig. 2). For example, community ownership was the most important attribute for both Groups 2 and 3, but was not significantly valued by Group 1. In contrast, although threatened bird species were valued by all three groups, Group 1 saw this as the highest priority whereas Groups 2 and 3 saw this as the least important attribute. Willingness to pay differed greatly between the groups. Group 1 had a non-significant value for the donation coefficient, so their donation response can be assumed equal to zero. Groups 2 and 3 were willing to pay for a selection of the attributes, but Group 3 was willing to pay substantially more, although with a large standard error of willingness to pay values (Fig. 3).
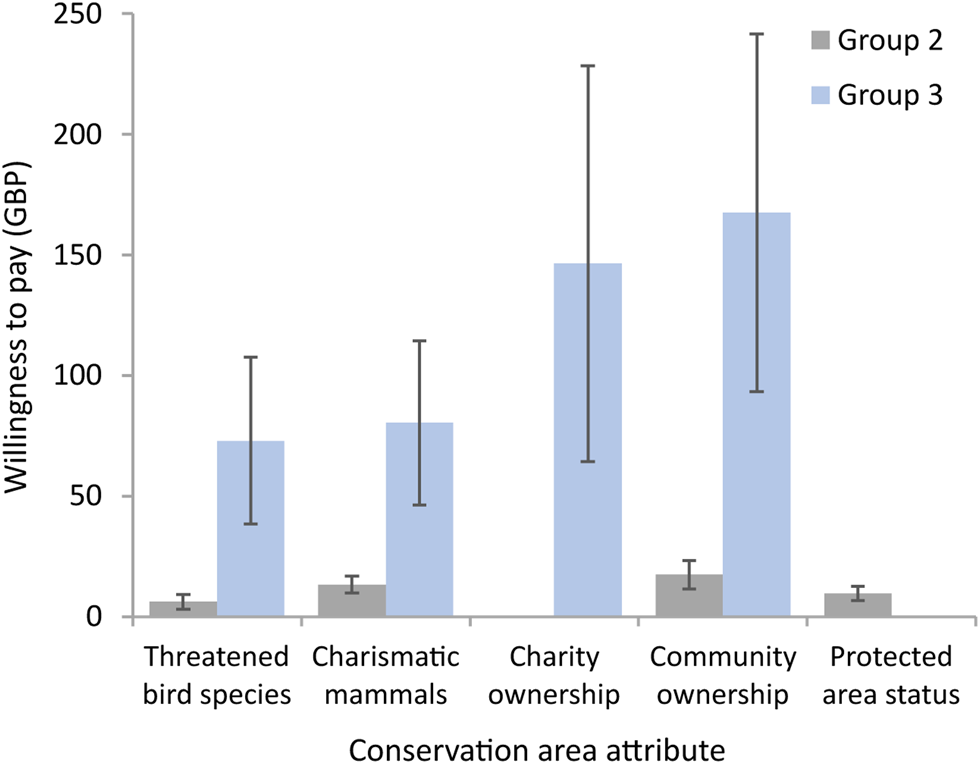
Fig. 3 Willingness to pay (± SE) for the significant conservation area attributes in Groups 2 and 3 of the latent class model.
Discussion
Like all marketing campaigns, it is important to identify and understand the target audience when selecting flagships (Smith et al., Reference Smith, Salazar, Starinchak, Thomas-Walters, Veríssimo, Sutherland, Brotherton, Davies, Ockendon, Pettorelli and Vickery2020). Our analysis was based on asking respondents from the UK to choose between donating different amounts to a selection of hypothetical conservation areas in South Africa. Our sample included more women, and people who were young, well-educated and relatively wealthy. However, this sample is similar to potential donors to overseas conservation flagship campaigns given that in the UK, more women donate to environmental conservation charities than men (Piper & Schnepf, Reference Piper and Schnepf2007), the 35–54 age group gives the most to charity (McHattie, Reference McHattie2018), more educated people are more likely to give to overseas causes (Micklewright & Schnepf, Reference Micklewright and Schnepf2007), and wealthier people have more disposable income for charitable giving (CAF, 2019). This means we can be confident that our study can provide potentially valuable insights. We first discuss the conservation area attributes that respondents found important and then discuss how this can be used to inform campaigns based on flagship conservation areas.
Preferences for conservation area attributes
Community ownership was the most important attribute in our model, which suggests that donors are not solely driven by biodiversity objectives but also by social concerns. This is consistent with a similar study in which participatory conservation was strongly valued by potential donors (Lewis et al., Reference Lewis, Young, Gibbons and Jones2018). Community ownership may be seen as fairer and more legitimate than other forms of ownership, or more likely to bring benefits to poorer people (Markova-Nenova & Wätzold, Reference Markova-Nenova and Wätzold2017; Lewis et al., Reference Lewis, Young, Gibbons and Jones2018). This may particularly be the case when considering conservation areas in South Africa, a country with relatively high poverty levels and a colonial history that included the forced removal of people from their land (Carruthers, Reference Carruthers1995). It should be noted, however, that our questionnaire provided no detail on what community ownership entailed, so more research is needed to identify the specific details that could potentially encourage donations. Charity ownership was also valued over government and private ownership, perhaps reflecting public trust in environmental charities to spend their money well. This is an encouraging result considering that research suggests that trust in UK charities has recently been diminishing (Hyndman & McConville, Reference Hyndman and McConville2018). However, these preferences may instead have resulted from a reluctance to support government- or privately-owned conservation areas and this possibility warrants further investigation.
Some biodiversity-related factors were important to our respondents, as presence of threatened bird species was the second most highly valued attribute and presence of charismatic mammals was fourth. Preference for these attributes was expected, as a number of studies have shown that people place a high value on the protection of threatened birds in conservation projects (Loomis & White, Reference Loomis and White1996; Lewis et al., Reference Lewis, Young, Gibbons and Jones2018) and prefer charismatic mammal species as flagships (Veríssimo et al., Reference Veríssimo, Vaughan, Ridout, Waterman, MacMillan and Smith2017). Less expected was the fact that the threatened bird species appealed more to donors than the charismatic, non-threatened mammal species. Charisma has been found to be one of the few consistently important flagship species traits (Clucas et al., Reference Clucas, McHugh and Caro2008; Smith et al., Reference Smith, Veríssimo, Isaac and Jones2012), although a recent willingness to pay study found that donors were more interested in funding species in need of conservation attention than species with high aesthetic appeal (Lundberg et al., Reference Lundberg, Vainio, Macmillan, Smith, Veríssimo and Arponen2019). Our finding could be related to how our choice experiment was framed, as it was made clear that the funding was for the conservation area and that the charismatic mammal species was not threatened.
Low existing conservation funding was the third most important attribute, suggesting that people preferred to donate to more neglected sites. This is in contrast to a previous study, which found that donor support was not related to whether a species was already receiving conservation attention (Veríssimo et al., Reference Veríssimo, Vaughan, Ridout, Waterman, MacMillan and Smith2017). Our results suggest that flagship areas could be used to generate resources for wider initiatives to fill funding gaps, supporting conservation areas that are currently neglected, although current shortfalls mean that some of these areas may need more funding to become viable (Coad et al., Reference Coad, Watson, Geldmann, Burgess, Leverington and Hockings2019). The final attribute, protected area status, did not significantly affect people's choices. This could be because of a lack of understanding of legal designations for conservation areas; Booth et al. (Reference Booth, Gaston and Armsworth2009) found that visitors to protected sites in the UK are generally unaware of the specific designations of areas. The non-significant result suggests that although protected area status is important for policy (Borrini-Feyerabend et al., Reference Borrini-Feyerabend, Dudley, Jaeger, Lassen, Broome, Phillips and Sandwith2013), it is not as important for marketing.
Considerations for the design of area-based flagship campaigns
Analysis of our latent class model groups revealed that not everyone was willing to pay for this kind of conservation project. Most notably, respondents in Group 1, who were most likely to be members of environmental organizations and less wealthy, were not interested in funding conservation areas (Table 2). This could be because they think conserving areas is less important than conserving species, which would explain why the presence of threatened species was their most preferred attribute (Fig. 2). Or it could be because they feel they already support this kind of activity through their environmental organization membership and cannot afford additional donations from their limited income. This suggests that NGOs need to clearly justify the need for funding beyond that provided by membership fees when developing flagship campaigns targeted at their members. Other studies have found that environmental organization membership does not necessarily increase willingness to pay for conservation activities (Baral et al., Reference Baral, Stern and Bhattarai2008), and although people may value biodiversity, they are not always willing to pay for its conservation (Martín-López et al., Reference Martín-López, Montes and Benayas2007). This is less encouraging for using these flagships for fundraising; however, area-based flagship campaigns could still be successful for awareness raising and movement building. For example, campaigns that target audiences such as those in Group 1 could focus on the importance of effective area-based conservation for threatened bird species. They could even aim to encourage people to mobilize and join environmental movements that are pressuring governments to commit to ambitious action for nature (Jordan & Maloney, Reference Jordan and Maloney1997).
Despite Group 1 members not being interested, the majority of respondents were willing to donate. Group 3 members were willing to pay the most (Fig. 3), which is understandable given they were likely to be wealthier than Group 2 members. However, the standard error on the willingness to pay estimates for Group 3 was large, so there was substantial variation in how much people were willing to give. This could be related to findings that wealthier people do not always see themselves as having more money to donate (Berman et al., Reference Berman, Bhattacharjee, Small and Zauberman2020), so NGOs cannot assume that targeting a wealthier audience will automatically result in greater donations. Both Groups 2 and 3 valued community ownership the most (Fig. 2), suggesting that the idea of communities having agency and benefiting from conservation is appealing. Charismatic mammals were also important for Group 2, a group with members who were generally less educated, reinforcing the well-studied appeal of charismatic species to a wide range of people (Martín-López et al., Reference Martín-López, Montes and Benayas2007). Therefore, analysis of these two groups highlights the potential of community ownership and, to a lesser extent, charismatic mammals, as powerful marketing hooks for people who are less engaged with conservation. Campaigns could capitalize on these elements, telling stories about the area, focusing on the people from the communities involved, and describing the charismatic mammals that rely on its protection.
It is important to stress that designing a flagship campaign involves many considerations other than selecting a site with the most attractive attributes. These include assessing the cultural, political or economic sensitivities related to the area and examining the context-specific relationship between the target audience and the conservation issue highlighted by the campaign (Veríssimo et al., Reference Veríssimo, MacMillan and Smith2011). For example, although South African conservation areas provided a good case study for this research, preferences may have differed if the areas had been described to be in another country. Our results should therefore be viewed as a contribution towards improving flagship approaches and not as a rigid description of the most effective flagship areas for a UK audience. There are, however, two broad findings with potentially high relevance for conservation. The first is that the majority of respondents showed a willingness to fund conservation areas. This suggests that conservation areas that appeal to potential donors could be used effectively in two types of flagship campaign: to benefit the conservation area directly, or to act as the ‘face’ of broader campaigns to benefit conservation area networks. The second is that when making trade-offs in their choices, people relied more on conservation, social and pragmatic values than on aesthetic values. In particular, these potential donors, especially those who were not members of environmental NGOs, seemed to be interested in funding areas owned and managed by communities.
Our results suggest that diversifying the flagship concept to include conservation areas has great potential to generate more support for wider biodiversity protection (Veríssimo et al., Reference Veríssimo, MacMillan and Smith2011), as these campaigns could appeal to new audiences, fund new types of projects and groups, and cover a wider range of species and ecosystems through site-based conservation. Our research is just the first step, however, and we need researchers and practitioners to co-develop work on how best to use these flagships to address issues that affect broader conservation area networks. In particular, given the potentially high appeal of community-owned flagship conservation areas, care will be needed to ensure that spending patterns match campaign promises and funds are disbursed transparently and fairly. If designed well, flagship area campaigns could benefit all types of protected areas and also other effective area-based conservation measures. This could help to meet targets for increasing the global extent of land and sea under conservation by supporting existing conservation areas and the creation and effective management of new ones (Jonas et al., Reference Jonas, Barbuto, Jonas, Kothari and Nelson2014; Corrigan et al., Reference Corrigan, Bingham, Shi, Lewis, Chauvenet and Kingston2018; Dudley et al., Reference Dudley, Jonas, Nelson, Parrish, Pyhälä, Stolton and Watson2018).
Acknowledgements
We thank the Durrell Institute for Conservation and Ecology at the University of Kent for funding this research, and Stuart Butchart (BirdLife International) for advising on the choice experiment design.
Author contributions
Study design: FD, RJS, IF; data collection: FD; analysis: FD, IF; writing: FD, RJS.
Conflicts of interest
None.
Ethical standards
This work abided by the Oryx guidelines on ethical standards.


 Open access