


1. Introduction
The 17 sustainable development goals (SDGs) under the United Nations 2030 Agenda for sustainable development represent global ambitions for achieving economic development, social inclusion, and environmental stability (UN, 2015). Progressing towards the diverse and ambitious SDGs requires compromising between competing sustainability priorities and harnessing synergies over deeply uncertain, long-term futures (Bandari et al., Reference Bandari, Moallemi, Lester, Downie and Bryan2021; Pradhan et al., Reference Pradhan, Costa, Rybski, Lucht and Kropp2017). To assist in reasoning and planning, computer models and simulations, referred to as integrated assessment models (IAMs) (van Beek et al., Reference van Beek, Hajer, Pelzer, van Vuuren and Cassen2020), models of multisector dynamics (Jafino et al., Reference Jafino, Kwakkel, Klijn, Dung, van Delden, Haasnoot and Sutanudjaja2021), or transition models (Köhler et al., Reference Köhler, de Haan, Holtz, Kubeczko, Moallemi, Papachristos and Chappin2018; Moallemi & de Haan, Reference Moallemi and de Haan2019), have been effectively used to systematically analyse the interactions of conflicting, inter-connected sustainability priorities in integrated human–Earth systems (Calvin & Bond-Lamberty, Reference Calvin and Bond-Lamberty2018) and to navigate actionable compromises between competing agendas (Gold et al., Reference Gold, Reed, Trindade and Characklis2019). These modelling efforts aim to advance the understanding and analysis of integrated human–Earth system co-evolution over time by bridging sectors, and support societal transformation planning through computational analysis.
A diverse set of models has been used to inform sustainable development (Verburg et al., Reference Verburg, Dearing, Dyke, Leeuw, Seitzinger, Steffen and Syvitski2016), including input–output models (Wiedmann, Reference Wiedmann2009), macro-economic and optimisation models (DeCarolis et al., Reference DeCarolis, Daly, Dodds, Keppo, Li, McDowall, Pye, Strachan, Trutnevyte, Usher, Winning, Yeh and Zeyringer2017), computational general equilibrium models (Babatunde et al., Reference Babatunde, Begum and Said2017), system dynamics models (Moallemi et al., Reference Moallemi, Bertone, Eker, Gao, Szetey, Taylor and Bryan2021; Pedercini et al., Reference Pedercini, Arquitt, Collste and Herren2019), and bottom-up agent-based models (Hansen et al., Reference Hansen, Liu and Morrison2019). Modelling applications have spanned different aspects of the SDGs such as food and diet (Bijl et al., Reference Bijl, Bogaart, Dekker, Stehfest, de Vries and van Vuuren2017; Eker et al., Reference Eker, Reese and Obersteiner2019), climate adaptation (JGCRI, 2017; Mayer et al., Reference Mayer, Loa, Cwik, Tuana, Keller, Gonnerman, Parker and Lempert2017; Small & Xian, Reference Small and Xian2018), land-use (Doelman et al., Reference Doelman, Stehfest, Tabeau, van Meijl, Lassaletta, Gernaat and van Vuuren2018; Gao & Bryan, Reference Gao and Bryan2017), energy (Rogelj et al., Reference Rogelj, Popp, Calvin, Luderer, Emmerling, Gernaat, Fujimori, Strefler, Hasegawa, Marangoni, Krey, Kriegler, Riahi, van Vuuren, Doelman, Drouet, Edmonds, Fricko, Harmsen and Tavoni2018a; Walsh et al., Reference Walsh, Ciais, Janssens, Peñuelas, Riahi, Rydzak, van Vuuren and Obersteiner2017), transportation (Moallemi & Köhler, Reference Moallemi and Köhler2019), and biodiversity conservation (Mace et al., Reference Mace, Barrett, Burgess, Cornell, Freeman, Grooten and Purvis2018). Models have also assessed the nexus of (often limited) interacting SDGs (Randers et al., Reference Randers, Rockström, Stoknes, Goluke, Collste, Cornell and Donges2019) such as food–energy–water (Van Vuuren et al., Reference Van Vuuren, Bijl, Bogaart, Stehfest, Biemans, Dekker, Doelman, Gernaat and Harmsen2019), land–food (Gao & Bryan, Reference Gao and Bryan2017; Obersteiner et al., Reference Obersteiner, Walsh, Frank, Havlík, Cantele, Liu, Palazzo, Herrero, Lu, Mosnier, Valin, Riahi, Kraxner, Fritz and van Vuuren2016), and land–food–biodiversity (Leclère et al., Reference Leclère, Obersteiner, Barrett, Butchart, Chaudhary, De Palma, DeClerck, Di Marco, Doelman, Dürauer, Freeman, Harfoot, Hasegawa, Hellweg, Hilbers, Hill, Humpenöder, Jennings, Krisztin and Young2020), among others. Model-based analysis of sustainable development over long timescales is, however, challenged by the conjunction of deep uncertainty around future global socioeconomic and climatic conditions and the complexity of integrated human–Earth system response under these uncertain conditions.
To address these challenges, past studies have often used scenarios to explore the plausible trajectories of system behaviour according to different sets of assumptions about the future (Guivarch et al., Reference Guivarch, Lempert and Trutnevyte2017; Moss et al., Reference Moss, Edmonds, Hibbard, Manning, Rose, Van Vuuren, Carter, Emori, Kainuma and Kram2010; Trutnevyte et al., Reference Trutnevyte, Guivarch, Lempert and Strachan2016). Within the context of climate change and sustainability science, the shared socioeconomic pathways (SSPs) (O'Neill et al., Reference O'Neill, Kriegler, Ebi, Kemp-Benedict, Riahi, Rothman, van Ruijven, van Vuuren, Birkmann, Kok, Levy and Solecki2017; Riahi et al., Reference Riahi, van Vuuren, Kriegler, Edmonds, O’Neill, Fujimori, Bauer, Calvin, Dellink, Fricko, Lutz, Popp, Cuaresma, Kc, Leimbach, Jiang, Kram, Rao, Emmerling and Tavoni2017) and the representative concentration pathways (RCPs) (Meinshausen et al., Reference Meinshausen, Nicholls, Lewis, Gidden, Vogel, Freund, Beyerle, Gessner, Nauels, Bauer, Canadell, Daniel, John, Krummel, Luderer, Meinshausen, Montzka, Rayner, Reimann and Wang2020; van Vuuren et al., Reference van Vuuren, Edmonds, Kainuma, Riahi, Thomson, Hibbard, Hurtt, Kram, Krey, Lamarque, Masui, Meinshausen, Nakicenovic, Smith and Rose2011), have dominated scenario studies over the past decade (O'Neill et al., Reference O’Neill, Carter, Ebi, Harrison, Kemp-Benedict, Kok, Kriegler, Preston, Riahi, Sillmann, van Ruijven, van Vuuren, Carlisle, Conde, Fuglestvedt, Green, Hasegawa, Leininger, Monteith and Pichs-Madruga2020). They project futures based on different challenges to mitigation and adaptation through five possible socioeconomic pathways (SSPs 1–5) and five different greenhouse gas emission trajectories (RCPs 1.9, 2.6, 4.5, 6.0, 7.0, 8.5) (see Subsection 2.3). The future developments of energy, land-use, and emission sectors according to the SSPs and RCPs have been extensively characterised and expanded, using a set of five so-called marker integrated assessment models including IMAGE (Bouwman et al., Reference Bouwman, Kram and Klein Goldewijk2006; van Vuuren et al., Reference van Vuuren, Stehfest, Gernaat, Doelman, van den Berg, Harmsen, de Boer, Bouwman, Daioglou, Edelenbosch, Girod, Kram, Lassaletta, Lucas, van Meijl, Müller, van Ruijven, van der Sluis and Tabeau2017), MESSAGE-GLOBIOM (Fricko et al., Reference Fricko, Havlik, Rogelj, Klimont, Gusti, Johnson and Riahi2017), AIM (Fujimori et al., Reference Fujimori, Hasegawa, Masui, Takahashi, Herran, Dai, Hijioka and Kainuma2017), GCAM (Calvin et al., Reference Calvin, Bond-Lamberty, Clarke, Edmonds, Eom, Hartin, Kim, Kyle, Link, Moss, McJeon, Patel, Smith, Waldhoff and Wise2017), and REMIND-MAGPIE (Kriegler et al., Reference Kriegler, Bauer, Popp, Humpenöder, Leimbach, Strefler, Baumstark, Bodirsky, Hilaire, Klein, Mouratiadou, Weindl, Bertram, Dietrich, Luderer, Pehl, Pietzcker, Piontek, Lotze-Campen and Edenhofer2017). The research community has frequently used the global SSP and RCP scenarios with these marker models in climate impact assessments (Rogelj et al., Reference Rogelj, Popp, Calvin, Luderer, Emmerling, Gernaat, Fujimori, Strefler, Hasegawa, Marangoni, Krey, Kriegler, Riahi, van Vuuren, Doelman, Drouet, Edmonds, Fricko, Harmsen and Tavoni2018a) and for analysing other Earth system processes (e.g. biodiversity (Leclère et al., Reference Leclère, Obersteiner, Barrett, Butchart, Chaudhary, De Palma, DeClerck, Di Marco, Doelman, Dürauer, Freeman, Harfoot, Hasegawa, Hellweg, Hilbers, Hill, Humpenöder, Jennings, Krisztin and Young2020); see O'Neill et al. (Reference O’Neill, Carter, Ebi, Harrison, Kemp-Benedict, Kok, Kriegler, Preston, Riahi, Sillmann, van Ruijven, van Vuuren, Carlisle, Conde, Fuglestvedt, Green, Hasegawa, Leininger, Monteith and Pichs-Madruga2020) for a review).
Despite past successful efforts, there are still important limitations to address for increasing the impact and usefulness of global change scenario frameworks. One major gap is that the application of the SSPs and RCPs to areas beyond climate change, such as sustainable development, has been so far limited. There are only a few studies that have extended these scenario frameworks to the evaluation of the SDGs (van Soest et al., Reference van Soest, van Vuuren, Hilaire, Minx, Harmsen, Krey, Popp, Riahi and Luderer2019). Among these, The World in 2050 (TWI2050, 2018) and the assessment of sustainable development pathways (Soergel et al., Reference Soergel, Kriegler, Weindl, Rauner, Dirnaichner, Ruhe, Hofmann, Bauer, Bertram, Bodirsky, Leimbach, Leininger, Levesque, Luderer, Pehl, Wingens, Baumstark, Beier, Dietrich and Popp2021) are the prominent examples, both mostly replying on the marker IAMs as their simulation engine. The broader use of SSPs and RCPs for sustainable development is crucial for developing a more comprehensive account of possible integrated futures and more diverse response options across connected global challenges (O'Neill et al., Reference O’Neill, Carter, Ebi, Harrison, Kemp-Benedict, Kok, Kriegler, Preston, Riahi, Sillmann, van Ruijven, van Vuuren, Carlisle, Conde, Fuglestvedt, Green, Hasegawa, Leininger, Monteith and Pichs-Madruga2020).
Another notable gap is that most of the past SSP–RCP projections were based on the assumptions of five original marker models, and the use of new, non-marker IAMs with different sets of input and structural assumptions has been rare. Among the few applications of non-marker models is Allen et al. (Reference Allen, Metternicht, Wiedmann and Pedercini2019) who used four SSPs as benchmarks to guide the development of national-scale scenarios, based on inequality and resource-use intensity, to assess scenarios of progress towards the SDGs for Australia. The adoption of non-marker, emerging models, with different sectoral boundaries (e.g. water (Graham et al., Reference Graham, Davies, Hejazi, Calvin, Kim, Helinski, Miralles‐Wilhelm, Clarke, Kyle, Patel, Wise and Vernon2018), diet change (Eker et al., Reference Eker, Reese and Obersteiner2019)) and levels of structural complexity (e.g. system dynamics models (Walsh et al., Reference Walsh, Ciais, Janssens, Peñuelas, Riahi, Rydzak, van Vuuren and Obersteiner2017)), is important to expand the scenario space around SSPs and RCPs with a wider set of futures and also to project a larger diversity of sustainability indicators aligned with the SDGs (O'Neill et al., Reference O’Neill, Carter, Ebi, Harrison, Kemp-Benedict, Kok, Kriegler, Preston, Riahi, Sillmann, van Ruijven, van Vuuren, Carlisle, Conde, Fuglestvedt, Green, Hasegawa, Leininger, Monteith and Pichs-Madruga2020).
These current limitations signify the need for a more diverse quantification of global reference scenarios (e.g. SSPs, RCPs) with new IAMs (Jaxa-Rozen & Trutnevyte, Reference Jaxa-Rozen and Trutnevyte2021) and in new domains such as sustainable development. Addressing this need has become more important in recent years especially given the increasing demand for model-based SDG analysis (Allen et al., Reference Allen, Metternicht, Wiedmann and Pedercini2019; Pedercini et al., Reference Pedercini, Arquitt, Collste and Herren2019; Soergel et al., Reference Soergel, Kriegler, Weindl, Rauner, Dirnaichner, Ruhe, Hofmann, Bauer, Bertram, Bodirsky, Leimbach, Leininger, Levesque, Luderer, Pehl, Wingens, Baumstark, Beier, Dietrich and Popp2021) and the emergence of new, open-source IAMs (e.g. FeliX (Walsh et al., Reference Walsh, Ciais, Janssens, Peñuelas, Riahi, Rydzak, van Vuuren and Obersteiner2017), iSDGs (Pedercini et al., Reference Pedercini, Arquitt, Collste and Herren2019), Earth3 (Randers et al., Reference Randers, Rockström, Stoknes, Goluke, Collste, Cornell and Donges2019), see a review in Duan et al. (Reference Duan, Zhang, Wang and Fan2019)) that are simpler yet have a broader scope compared to the marker models (Riahi et al., Reference Riahi, van Vuuren, Kriegler, Edmonds, O’Neill, Fujimori, Bauer, Calvin, Dellink, Fricko, Lutz, Popp, Cuaresma, Kc, Leimbach, Jiang, Kram, Rao, Emmerling and Tavoni2017), sufficient to address several SDGs.
Here, we implement and explore global SSP and RCP scenario frameworks and their uncertainty with a feedback-rich system dynamics model for sustainable development, called the Functional Enviro-economic Linkages Integrated neXus (FeliX) (Eker et al., Reference Eker, Reese and Obersteiner2019; Walsh et al., Reference Walsh, Ciais, Janssens, Peñuelas, Riahi, Rydzak, van Vuuren and Obersteiner2017). This, first of all, provides modellers with well-defined steps for the adoption of established global change scenarios in their new modelling works with a clear demonstration of these steps' implementation in FeliX (Section 2). Second, it provides a new analysis of global trajectories of the five plausible combinations of SSPs and RCPs under 50,000 different realisations (Section 3). These results show how socioeconomic and climate drivers could unfold in the future through the multi-sectoral dynamics of demography, economy, energy, land, food, biodiversity, and climate systems (Subsection 3.1) and in what areas and to what extents they diverge from previous projections (Subsection 3.2). The results also show the impacts across 16 sustainability indicators representing eight SDGs related to agriculture and food security (SDG2), health and well-being (SDG3), quality education (SDG4), clean energy (SDG7), sustainable economic growth (SDG8), sustainable consumption and production (SDG12), climate action (SDG13), and biodiversity conservation (SDG15) (Subsection 3.3). Our results highlight the value added of exploring the implications of new models for global scenarios and provide insights into the global trajectories towards several SDGs under a larger scenario space (Section 4).
2. Methods
We used a non-marker IAM of sustainable development (step 1). We identified the model's influential parameters for the generation of global scenarios (step 2). We elaborated our scenario assumptions and set up the model under these assumptions (steps 3 and 4). We then explored the uncertainty space of implemented scenarios in the model using exploratory modelling (step 5). We let the model, with its new structural complexity, generate the diversity of output behaviours, explored various quantifications of global reference scenarios outside their standard projections, and analysed diversions from other models and implications for the SDG analysis (step 6). Each step is explained in detail as follows (Figure 1).

Figure 1. Overview of methodological steps for implementing global scenario frameworks in a new IAM for sustainable development.
2.1 Model multisectoral dynamics underlying SDGs
We modelled anthropogenic processes of the multisectoral dynamics that drive SDG progress through an IAM of human and Earth system interactions called FeliX (Figure 2). The human system sub-models capture socioeconomic dynamics and human decision-making (e.g. demography, education, economy, land-use change) and the Earth system sub-models capture biogeophysical processes (e.g. climate, carbon cycle, phosphorus and nitrogen cycles). FeliX simulates complex feedback interactions between these human and Earth system sub-models. The integration of feedbacks in FeliX enhances the understanding of reasons for non-linearities and radical change that emerge in sustainability pathways from the co-development of human activities and environmental change. FeliX's feedback-rich structure makes this model stand out among most global models that miss (or simplify) the important two-way feedback interactions between various sectors by primarily focusing on specific sectors (e.g. food (Willett et al., Reference Willett, Rockström, Loken, Springmann, Lang, Vermeulen, Garnett, Tilman, DeClerck, Wood, Jonell, Clark, Gordon, Fanzo, Hawkes, Zurayk, Rivera, De Vries, Majele Sibanda and Murray2019), land–food (Obersteiner et al., Reference Obersteiner, Walsh, Frank, Havlík, Cantele, Liu, Palazzo, Herrero, Lu, Mosnier, Valin, Riahi, Kraxner, Fritz and van Vuuren2016), food–energy–water (Van Vuuren et al., Reference Van Vuuren, Bijl, Bogaart, Stehfest, Biemans, Dekker, Doelman, Gernaat and Harmsen2019)) or only a one-way information exchange from socioeconomic factors to climatic, biophysical processes (van Vuuren et al., Reference van Vuuren, Batlle Bayer, Chuwah, Ganzeveld, Hazeleger, van den Hurk, van Noije, O’Neill and Strengers2012).

Figure 2. Overview of the FeliX model. Adapted from and updated based on Rydzak et al. (Reference Rydzak, Obersteiner, Kraxner, Fritz and McCallum2013). See Supplementary methods for the description of each sub-model.
FeliX is based on the system dynamics approach (Moallemi et al., Reference Moallemi, Bertone, Eker, Gao, Szetey, Taylor and Bryan2021; Sterman, Reference Sterman2000) with a resolution set at a global scale and with annual timescale over a long-term period (1900–2100). The model has been used as a policy assessment tool in exploring emission pathways (Walsh et al., Reference Walsh, Ciais, Janssens, Peñuelas, Riahi, Rydzak, van Vuuren and Obersteiner2017), evaluating sustainable food and diet shift (Eker et al., Reference Eker, Reese and Obersteiner2019), and analysing socio-environmental impacts on Earth observation systems (Rydzak et al., Reference Rydzak, Obersteiner and Kraxner2010). The model outputs have been also tested and validated against historical data from 1900 to 2015 across all sub-models, available in the extended model documentation in Rydzak et al. (Reference Rydzak, Obersteiner, Kraxner, Fritz and McCallum2013) as well as in Walsh et al. (Reference Walsh, Ciais, Janssens, Peñuelas, Riahi, Rydzak, van Vuuren and Obersteiner2017) and Eker et al. (Reference Eker, Reese and Obersteiner2019).
Using FeliX, we modelled 16 indicators across eight societal and environmental SDGs (Table 1). The selection of SDGs and their indicators was guided by the model scope with the aim of covering a wider diversity of sustainable development dimensions as in previous studies (Allen et al., Reference Allen, Metternicht, Wiedmann and Pedercini2019; Gao & Bryan, Reference Gao and Bryan2017; Obersteiner et al., Reference Obersteiner, Walsh, Frank, Havlík, Cantele, Liu, Palazzo, Herrero, Lu, Mosnier, Valin, Riahi, Kraxner, Fritz and van Vuuren2016; Pedercini et al., Reference Pedercini, Arquitt, Collste and Herren2019; Randers et al., Reference Randers, Rockström, Stoknes, Goluke, Collste, Cornell and Donges2019; van Vuuren et al., Reference van Vuuren, Kok, Lucas, Prins, Alkemade, van den Berg, Bouwman, van der Esch, Jeuken, Kram and Stehfest2015). The SDGs and their indicators were implemented across the 11 FeliX's sub-models of population, education, economy, energy, water, food and land, fertiliser use, diet change, carbon cycle, climate, and biodiversity (see each sub-model description in Supplementary methods). Each sub-model includes feedback interactions between several model components necessary to generate complex interactions underlying the SDGs.
Table 1. List of modelled SDG indicators
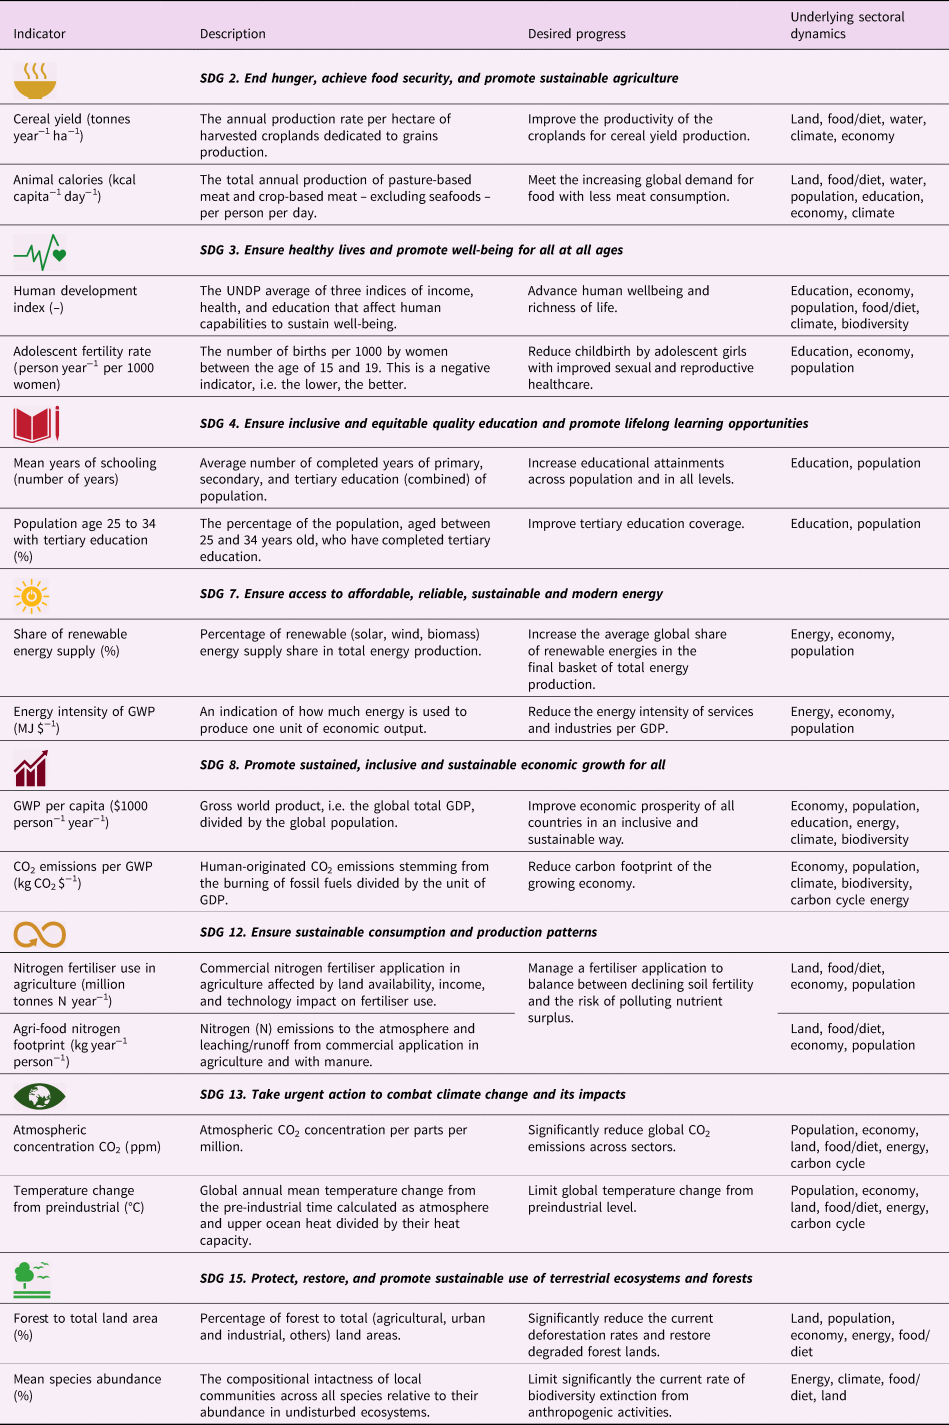
There are two modelled indicators under each SDG for consistency. Each indicator trajectory is simulated in the model based on the interaction of multiple sectors. This underlying sectoral dynamic for each indicator is specified in the last column.
This feedback-rich nature and flexibility of the FeliX model also enables exploring the impacts of tipping mechanisms on sustainability pathways. Climate tipping elements that can exacerbate warming (Lenton et al., Reference Lenton, Held, Kriegler, Hall, Lucht, Rahmstorf and Schellnhuber2008), such as permafrost melting and the loss of Amazon rainforest, can be explicitly included in the model to explore the safe pathways of human actions to avoid such tipping points. Similarly, social tipping dynamics (Otto et al., Reference Otto, Donges, Cremades, Bhowmik, Hewitt, Lucht, Rockström, Allerberger, McCaffrey, Doe, Lenferna, Morán, van Vuuren and Schellnhuber2020) that accelerate mitigation actions can be explored using the FeliX model and the SDG framework. Several feedback mechanisms underlying possible social tipping dynamics, such as the change of norms, impact of education and learning effects on the energy system are already included in the model scope, hence in our analysis below. Future work can extend the FeliX model and investigate the compound dynamics of climate and social tipping elements.
2.2 Identify influential model parameters for scenario modelling
IAMs often have many demographic, macro-economic, techno-economic, and environmental parameters. However, among these parameters, some are more influential than others and some may have only trivial impacts on model behaviour. We identified influential parameters for scenario modelling from an initial list of 114 model parameters (Supplementary Table S2) and ranked them based on their impact (with non-linear interactions) on 20 model outputs using Morris elementary effects (Campolongo et al., Reference Campolongo, Cariboni and Saltelli2007; Morris, Reference Morris1991). Morris elementary effect is a suitable global sensitivity analysis method for IAMs with a large number of input parameters and a complex structure of nonlinear feedbacks where computational costs are very high. The method has proved to generate reliable sensitivity indices with a better computational efficiency compared to other techniques (Campolongo et al., Reference Campolongo, Cariboni and Saltelli2007; Gao & Bryan, Reference Gao and Bryan2016) (see sensitivity analysis details in Supplementary methods).
Figure 3 shows the ranking and selection of influential model parameters to be used for scenario modelling of different sectors (e.g. population, GDP, energy demand, forest land cover) by 2030, 2050, and 2100. The identified model parameters were diverse enough to capture influential global change in relation to demographic (e.g. fertility rate and life expectancy), education (e.g. enrolment and graduation rates), economic (e.g. capital elasticity of the economy), and lifestyle (i.e. energy demand and diet change). A substantial variation was observed in the influence of various parameters. The top influential parameters were related to socioeconomic factors (demography, education, economy) and diet change, indicating them as key parameters underpinning scenario modelling. We also observed that the influential parameters did not change significantly over time (Figure 3). Therefore, we used the influential parameters based on their long-term sensitivity (by 2100) as our reference set of model parameters to work with for scenario modelling.

Figure 3. Ranking of influential model parameters. Sensitivity is the normalised values of Morris index μ* between 0 and 1. For each output variable (y axis), the most influential input parameters (x axis) are annotated with their rank. Information on the unit and definition of each parameter is available in Supplementary Table S2.
2.3 Specify scenario assumptions
We identified and described the main driving forces of global change, with different degrees of challenges to mitigation and adaptation, based on existing scenario frameworks. We explored future socioeconomic and climate-driving forces framed by two reference global change scenario frameworks (Moss et al., Reference Moss, Edmonds, Hibbard, Manning, Rose, Van Vuuren, Carter, Emori, Kainuma and Kram2010), that is, the SSPs (O'Neill et al., Reference O'Neill, Kriegler, Ebi, Kemp-Benedict, Riahi, Rothman, van Ruijven, van Vuuren, Birkmann, Kok, Levy and Solecki2017; Riahi et al., Reference Riahi, van Vuuren, Kriegler, Edmonds, O’Neill, Fujimori, Bauer, Calvin, Dellink, Fricko, Lutz, Popp, Cuaresma, Kc, Leimbach, Jiang, Kram, Rao, Emmerling and Tavoni2017) and the RCPs (van Vuuren et al., Reference van Vuuren, Edmonds, Kainuma, Riahi, Thomson, Hibbard, Hurtt, Kram, Krey, Lamarque, Masui, Meinshausen, Nakicenovic, Smith and Rose2011), respectively. The SSPs chart future underlying socioeconomic development, including five pathways to 2100: SSP1 (sustainability), SSP2 (business-as-usual), SSP3 (regional rivalry), SSP4 (inequality), and SSP5 (fossil-fuelled development) (O'Neill et al., Reference O'Neill, Kriegler, Ebi, Kemp-Benedict, Riahi, Rothman, van Ruijven, van Vuuren, Birkmann, Kok, Levy and Solecki2017). The RCPs represent the climate forcing levels of different possible futures with long-term pathways to certain concentration levels of carbon dioxide (CO2) by 2100 and beyond (Meinshausen et al., Reference Meinshausen, Nicholls, Lewis, Gidden, Vogel, Freund, Beyerle, Gessner, Nauels, Bauer, Canadell, Daniel, John, Krummel, Luderer, Meinshausen, Montzka, Rayner, Reimann and Wang2020; van Vuuren et al., Reference van Vuuren, Edmonds, Kainuma, Riahi, Thomson, Hibbard, Hurtt, Kram, Krey, Lamarque, Masui, Meinshausen, Nakicenovic, Smith and Rose2011), including (originally) four emission trajectories to 2100 (and beyond) with different levels of global radiative forcing from 2.6, to 4.5, to 6.0, to 8.5 W m−2 (van Vuuren et al., Reference van Vuuren, Edmonds, Kainuma, Riahi, Thomson, Hibbard, Hurtt, Kram, Krey, Lamarque, Masui, Meinshausen, Nakicenovic, Smith and Rose2011). The emission trajectory of 1.9 W m−2 was added later as a pathway to 1.5°C to the end of the century (Rogelj et al., Reference Rogelj, Shindell, Jiang, Fifita, Forster, Ginzburg, Handa, Kheshgi, Kobayashi, Kriegler, Mundaca, Séférian and Vilariño2019).
Although different forcing levels could be achieved under different socioeconomic scenarios, a specific RCP is often associated with each SSP (as also used in the sixth Climate Model Intercomparison Project (CMIP6)) considering consistency between their narratives and their plausibility (O'Neill et al., Reference O'Neill, Tebaldi, van Vuuren, Eyring, Friedlingstein, Hurtt, Knutti, Kriegler, Lamarque, Lowe, Meehl, Moss, Riahi and Sanderson2016). We selected our benchmark SSP–RCP scenarios for implementation in the same way. We considered the plausibility of selected combinations as well as their application frequency across 715 studies (published between 2014 and 2019) that used integrated scenarios, based on a recent review by O'Neill et al. (Reference O’Neill, Carter, Ebi, Harrison, Kemp-Benedict, Kok, Kriegler, Preston, Riahi, Sillmann, van Ruijven, van Vuuren, Carlisle, Conde, Fuglestvedt, Green, Hasegawa, Leininger, Monteith and Pichs-Madruga2020). For example, we assumed that a high and a low-radiative forcing of 8.5 and 2.6 W m−2 can most likely occur under the societal development of SSP5 and SSP1 which focus on highly polluting and sustainable futures (respectively). The radiative forcings of 8.5 and 2.6 W m−2 are also the most frequent levels applied in previous studies to these two SSPs. In the same way, we associated the radiative forcing levels of 4.5, 7.0, and 6.0 W m−2 to SSPs 2, 3, and 4 (respectively).
We excluded RCP 1.9 W m−2 from our analysis given the highly ambitious carbon dioxide removal (CDR) deployment assumptions in this scenario (Rogelj et al., Reference Rogelj, Shindell, Jiang, Fifita, Forster, Ginzburg, Handa, Kheshgi, Kobayashi, Kriegler, Mundaca, Séférian and Vilariño2019) that is not explicitly represented in all IAMs. Such high CDR deployment for achieving 1.9 W m−2 emission trajectory also has an increased complexity of side effects on other sectors that are beyond the scope of this paper (see discussion in Section 4). In relation to each scenario combination, we also assumed climate mitigation policy assumptions, such as adoption of carbon capture and storage and carbon price, as indication of the efforts to reach the specified forcing levels (see description in Supplementary Table S1).
We elaborated how the future could unfold under each selected SSP–RCP combination in a set of coherent and internally consistent qualitative assumptions over the 21st century. The scenario assumptions represented the determinants of potential futures, both in socioeconomic (i.e. population, education, economy) and other sectoral domains (i.e. energy, climate, land, food and diet change). We adopted those scenario assumptions (related to socioeconomic conditions, energy, climate, land, and food and diet change) from the original SSPs (O'Neill et al., Reference O'Neill, Kriegler, Ebi, Kemp-Benedict, Riahi, Rothman, van Ruijven, van Vuuren, Birkmann, Kok, Levy and Solecki2017). We only selected those original assumptions that could be characterised in the FeliX model. For example, we did not include the SSPs' original assumption about ‘technology transfer’ given that technology collaborations between countries were not taken into account in our model. In another example, we used assumptions about ‘improvement in investment in technology advancement’ and the ‘enhancement of energy technology efficiency’ as two proxies consistent with our model's scope and structure to represent the SSPs' original assumption on ‘energy technology change’.
We described the evolution of scenario assumptions qualitatively by 2100 under five SSP–RCP combinations (Supplementary Table S1). The qualitative descriptions were informed by the SSP storylines (O'Neill et al., Reference O'Neill, Kriegler, Ebi, Kemp-Benedict, Riahi, Rothman, van Ruijven, van Vuuren, Birkmann, Kok, Levy and Solecki2017) (which provided a descriptive account of different scenarios) and their sectoral extensions (which interpreted the storylines and provided a detailed account of energy (Bauer et al., Reference Bauer, Calvin, Emmerling, Fricko, Fujimori, Hilaire, Eom, Krey, Kriegler, Mouratiadou, de Boer, van den Berg, Carrara, Daioglou, Drouet, Edmonds, Gernaat, Havlik, Johnson and van Vuuren2017), emissions (Meinshausen et al., Reference Meinshausen, Nicholls, Lewis, Gidden, Vogel, Freund, Beyerle, Gessner, Nauels, Bauer, Canadell, Daniel, John, Krummel, Luderer, Meinshausen, Montzka, Rayner, Reimann and Wang2020), and land sectors (Popp et al., Reference Popp, Calvin, Fujimori, Havlik, Humpenöder, Stehfest, Bodirsky, Dietrich, Doelmann, Gusti, Hasegawa, Kyle, Obersteiner, Tabeau, Takahashi, Valin, Waldhoff, Weindl, Wise and Vuuren2017)). The internal consistency of our input assumptions across sectors (e.g. low population, high economic growth, high sustainability in SSP1) was similar to the SSP narratives. This internal consistency was important to relate the resulted scenario realisations to the exploration of a new model structure and its parametrisation rather than to having a totally different set of global change scenarios.
The qualitative scenario assumptions informed the implementation of scenarios in the next step by guiding in what range the model inputs should be and by providing a context to better understand and interpret model projections. Similar to the original idea of the SSPs, our scenario assumptions represented different degrees of challenges to mitigation (of the emissions from energy and land-use) and adaptation and their impacts on the society (O'Neill et al., Reference O'Neill, Kriegler, Riahi, Ebi, Hallegatte, Carter, Mathur and van Vuuren2014; van Vuuren et al., Reference van Vuuren, Kriegler, O'Neill, Ebi, Riahi, Carter, Edmonds, Hallegatte, Kram, Mathur and Winkler2014). Four of the scenarios (i.e. SSP1-2.6, SSP3-7.0, SSP4-6.0, SSP5-8.5) indicated a combination of high and low challenges to adaptation and mitigation while the fifth scenario (SSP2-4.5) was representative of moderate mitigation and adaptation challenges.
2.4 Implement scenario assumptions in the model
We translated our scenario assumptions (Subsection 2.3) into influential model parameters (Subsection 2.2) for FeliX (i.e. calibration). Different model structures and simulation period do not allow for a harmonisation of scenario assumptions across various models, and several equally valid quantifications of the scenario assumptions can be implemented in models (as was the case for the five marker models of the SSPs (Riahi et al., Reference Riahi, van Vuuren, Kriegler, Edmonds, O’Neill, Fujimori, Bauer, Calvin, Dellink, Fricko, Lutz, Popp, Cuaresma, Kc, Leimbach, Jiang, Kram, Rao, Emmerling and Tavoni2017)). The previously projected SSP scenarios (Riahi et al., Reference Riahi, van Vuuren, Kriegler, Edmonds, O’Neill, Fujimori, Bauer, Calvin, Dellink, Fricko, Lutz, Popp, Cuaresma, Kc, Leimbach, Jiang, Kram, Rao, Emmerling and Tavoni2017) are also argued to be not exhaustive, and many plausible and important scenarios may be outside those standard ranges (Guivarch et al., Reference Guivarch, Rozenberg and Schweizer2016; Rozenberg et al., Reference Rozenberg, Guivarch, Lempert and Hallegatte2014), indicating the need for a more diverse translation of scenario assumptions. Accordingly, we implemented an internally consistent (across sectors) version of scenarios in the FeliX model, but with different values for model input parameters and uncertainty ranges that suited our model to enable the exploration of the implications of varying assumptions and hypotheses (see calibration details in Supplementary methods).
2.5 Project scenario realisations with the model
We explored the uncertainty space of implemented scenario assumptions in the FeliX model and built a large number of model runs. Given the uncertainty in projection of model behaviour, we sampled deeply uncertain scenario assumptions that strongly influence the future (see the design of experimental details in Supplementary methods). We simulated and evaluated scenarios against a diverse suite of socioeconomic and environmental outputs over time under a large ensemble of samples from the uncertainty space to understand the full scale of variation in scenario performance. Each sample from the uncertainty space is an internally consistent set of assumptions representing a possible scenario realisation, called a state of the world (SOW).
In projecting scenarios, we assumed that there is an uncertainty inherent in the calibration of influential model parameters. We also assumed that there could be an uncertainty in the timing of change in the value of model parameters, that is, from their business-as-usual (BAU) to calibrated values, to account for the delay in the emergence of scenario assumptions (e.g. diet change may not happen until 2025, and it may only gradually emerge from then). This delayed, gradual emergence of scenario assumptions through the model parameters was consistent with the implementations of the SSPs in marker models (van Vuuren et al., Reference van Vuuren, Stehfest, Gernaat, Doelman, van den Berg, Harmsen, de Boer, Bouwman, Daioglou, Edelenbosch, Girod, Kram, Lassaletta, Lucas, van Meijl, Müller, van Ruijven, van der Sluis and Tabeau2017). Using the parameter setting of each scenario (Subsection 2.4) and their uncertainty space, we simulated the global trajectories of socioeconomic, energy, climate, and land and food sectors from 2020 to 2100 with the FeliX model. We assessed whether our projections provide an internally consistent story across different sectors within each scenario, aligned with original SSP narratives (O'Neill et al., Reference O'Neill, Kriegler, Ebi, Kemp-Benedict, Riahi, Rothman, van Ruijven, van Vuuren, Birkmann, Kok, Levy and Solecki2017).
2.6 Compare the new projections with those of other models
In the last step, we analysed the resulting database of model runs (Subsection 2.5) and compared our projections across socioeconomic, energy, climate, and land and food sectors with the projections of marker IAMs, including IMAGE (Bouwman et al., Reference Bouwman, Kram and Klein Goldewijk2006; van Vuuren et al., Reference van Vuuren, Stehfest, Gernaat, Doelman, van den Berg, Harmsen, de Boer, Bouwman, Daioglou, Edelenbosch, Girod, Kram, Lassaletta, Lucas, van Meijl, Müller, van Ruijven, van der Sluis and Tabeau2017), MESSAGE-GLOBIOM (Fricko et al., Reference Fricko, Havlik, Rogelj, Klimont, Gusti, Johnson and Riahi2017; Riahi et al., Reference Riahi, Grübler and Nakicenovic2007), AIM (Fujimori et al., Reference Fujimori, Hasegawa, Masui, Takahashi, Herran, Dai, Hijioka and Kainuma2017), GCAM (Calvin et al., Reference Calvin, Bond-Lamberty, Clarke, Edmonds, Eom, Hartin, Kim, Kyle, Link, Moss, McJeon, Patel, Smith, Waldhoff and Wise2017), and REMIND-MAGPIE (Kriegler et al., Reference Kriegler, Bauer, Popp, Humpenöder, Leimbach, Strefler, Baumstark, Bodirsky, Hilaire, Klein, Mouratiadou, Weindl, Bertram, Dietrich, Luderer, Pehl, Pietzcker, Piontek, Lotze-Campen and Edenhofer2017), for the same SSP–RCP combinations. This comparison did not aim for agreement with other models, and was rather focused on differences and the new insights we arrived at that would not have been possible without modelling of scenarios with a non-marker model of different structural complexity.
3. Results and discussion
3.1 Scenario realisations
The quantification of scenarios across sectors with the FeliX model provided internally consistent outcomes across sectors (Figure 4). First, FeliX's projected SOWs under SSP1-2.6 represented an inclusive and environment-friendly future for sustainable development. The results showed a consistently high socioeconomic prosperity across education, population, and economy. Access to all levels of education (as a proportion of population size), especially higher education, increased (Figure 4d) with improvement in gender inequality. Global population peaked around mid-century and came under control (i.e. declined) significantly by 2100 due to a declining fertility rate (Figure 4a). Economic growth boomed due to fast technological progress (Figure 4e). The socioeconomic prosperity paved the way for sustainability transitions across different sectors. This involved major transformations in the energy sector.

Figure 4. Scenario projections with the FeliX model (envelopes) and their comparison with other projections. This included the comparison with the projections of major demographic and economic models (Dellink et al., Reference Dellink, Chateau, Lanzi and Magné2017; Samir & Lutz, Reference Samir and Lutz2017) and IAMs (Bauer et al., Reference Bauer, Calvin, Emmerling, Fricko, Fujimori, Hilaire, Eom, Krey, Kriegler, Mouratiadou, de Boer, van den Berg, Carrara, Daioglou, Drouet, Edmonds, Gernaat, Havlik, Johnson and van Vuuren2017; Calvin et al., Reference Calvin, Bond-Lamberty, Clarke, Edmonds, Eom, Hartin, Kim, Kyle, Link, Moss, McJeon, Patel, Smith, Waldhoff and Wise2017; Fujimori et al., Reference Fujimori, Hasegawa, Masui, Takahashi, Herran, Dai, Hijioka and Kainuma2017; Kriegler et al., Reference Kriegler, Bauer, Popp, Humpenöder, Leimbach, Strefler, Baumstark, Bodirsky, Hilaire, Klein, Mouratiadou, Weindl, Bertram, Dietrich, Luderer, Pehl, Pietzcker, Piontek, Lotze-Campen and Edenhofer2017; Popp et al., Reference Popp, Calvin, Fujimori, Havlik, Humpenöder, Stehfest, Bodirsky, Dietrich, Doelmann, Gusti, Hasegawa, Kyle, Obersteiner, Tabeau, Takahashi, Valin, Waldhoff, Weindl, Wise and Vuuren2017; Riahi et al., Reference Riahi, van Vuuren, Kriegler, Edmonds, O’Neill, Fujimori, Bauer, Calvin, Dellink, Fricko, Lutz, Popp, Cuaresma, Kc, Leimbach, Jiang, Kram, Rao, Emmerling and Tavoni2017; van Vuuren et al., Reference van Vuuren, Stehfest, Gernaat, Doelman, van den Berg, Harmsen, de Boer, Bouwman, Daioglou, Edelenbosch, Girod, Kram, Lassaletta, Lucas, van Meijl, Müller, van Ruijven, van der Sluis and Tabeau2017) (thin lines). Projections cover the period 2020–2100 with an annual time step. See Supplementary Figure S2 for the detailed specification of projections with other IAMs.
While rapid economic growth would normally increase overall energy use, the input assumption of widespread energy-efficient technologies and a transition to low-energy intensity services in SSP1-2.6 (Supplementary Table S1) attenuated the increase in energy demand (Figure 4h). The input assumptions of high investment and technological progress, high environmental consciousness, increasing production costs (e.g. carbon price costs) of using fossil energy, and the steep cost reduction of renewable technologies also made the model meet most of the energy demand through adoption of renewable (especially solar) energy (Figures 4l to 4n).
Similar sustainability transitions were observed in the food and land sector under SSP1-2.6. Environmental consciousness from high educational attainment (especially at tertiary levels) along with low population growth promoted healthy diets with low animal-calorie shares (Figure 4q). This also coincided with land productivity growth and high crop and livestock yield (because of input assumptions on improvement in land managerial practices) resulting in less need for the expansion of cropland and pasture (Figures 4r, 4s, and 4u) and a sharp decline in deforestation (Figure 4t). Transition to renewable energies, sustainable land-use change, and lower meat consumption, together with a strong climate policy regime (e.g. carbon price, carbon capture and storage for fossil fuels; see Supplementary Table S1) created a high potential for mitigation with low-range emissions (Figure 4w) and low-radiative forcing levels (Figure 4v) by 2100.
The SSP2-4.5 projections followed the continuation of past and current (business-as-usual) trajectories across all sectors. The results showed a moderate growth in all socioeconomic sectors (population, education, economy) (Figures 4a to 4e), a higher-energy demand, and a slower transition to renewable energy compared to SSP1-2.6 (Figures 4f to 4n). There was also a moderate rate of agricultural land expansion and deforestation and a relatively higher animal caloric supply (Figures 4o to 4u) due to input assumptions on the continuation of current (high meat) diet regimes. Together, these trajectories resulted in a higher level of emissions and radiative forcing compared to SSP1-2.6, but still lower than other scenarios due to moderate climate change mitigation policies (Figures 4v and 4w).
The SSP3-7.0 projections represented a high population, consumption, and environmental footprints scenario. The results showed the low-achieving socioeconomic projections among all scenarios (Figures 4a to 4e). A very slow economic growth led to an underdeveloped education system, especially at the tertiary level, which limited the training of a skilled labour force and created further challenges for economic development. Slow economic progress along with limited educational opportunities induced rapid population growth and declining wellbeing and life expectancy across the population. A relatively weak economy normally has a reduced demand for energy. However, input assumptions around low-environmental standards and poorly performing public infrastructure in this scenario (Supplementary Table S1) increased energy demand compared to the business-as-usual trajectories (Figure 4h).
Transition to renewable (i.e. wind and solar) energy was slower in SSP3-7.0 compared to the business-as-usual (Figures 4l to 4n) due to input assumptions around low-energy technology improvement (i.e. efficiency), limited investment in expanding installed renewable energy capacity, and lower production cost of fossil energy (i.e. no limit on emissions and carbon price for fossil fuels). In the land and food sector, low crop and livestock yield (due to poor land management practices) and increasing demand for animal calories from the increasing population necessitated the rapid expansion of cropland and pasture to address food insecurity (Figures 4o to 4u). A combination of booming population with declining trends of other socioeconomic systems, high fossil energy dependency, high meat consumption with rapid agricultural land expansion, and a lack of strong global climate change mitigation policies for the energy and land sectors resulted in high emissions and high-radiative forcing levels (Figures 4v and 4w), posing significant challenges to mitigation in SSP3-7.0.
The SSP4-6.0 projections showed moderate trajectories in socioeconomic systems (i.e. population, education, economy) with trends better than business-as-usual and SSP3-7.0, but not at the same level of prosperity as in SSP1-2.6 and SSP5-8.5 (Figures 4a to 4e). Transition in the energy sector (from fossil to renewable sources) (Figures 4f to 4n) and food production and the expansion of agricultural lands (Figures 4o to 4u) also had relatively similar low and high trends (respectively) compared to business-as-usual. These socioeconomic, energy, and food and land trajectories together resulted in a moderate (compared to business-as-usual) emissions and radiative forcing (Figures 4v and 4w), leading to relatively low challenges to mitigation.
The SSP5-8.5 was a promising socioeconomic future at the cost of an unsustainable environmental outlook driven by a highly polluting and high-consumption lifestyle. The projections showed a similar level of socioeconomic prosperity to SSP1-2.6, with equally low population and high educational attainment, and even higher economic growth (Figures 4a to 4e). However, socioeconomic development in this scenario resulted in high, resource-intensive consumption, with severe impacts for energy and climate. Rapid economic growth promoted a lifestyle with the highest energy demand among all scenarios (Figure 4h). However, contrary to SSP1-2.6, this high-energy demand was not offset by a transition to low-energy intensity, efficient renewable energy technologies, nor an environmental consciousness around consumption impacts (Supplementary Table S1).
Despite rapid economic development and technological advances, the reliance on fossil fuels as a cheap source of energy remained much higher in SSP5-8.5 (compared to other scenarios) to meet the increasing energy demand (Figures 4i to 4k). In the food and land sector (Figures 4o to 4u), a lower population growth along with the effect of a relatively high crops and livestock yield (because of technological advances under SSP5) resulted in crop and livestock production and agricultural land area lower than the business-as-usual (but still higher than SSP1-2.6). This lower agricultural land area also resulted in a slightly improving trajectory for forest land indicator (Figure 4t). In FeliX's model structure, decrease in one land-use type is directly linked and contributes to increase in another land-use type (see model description in Supplementary methods). The effects of all sectors together, mostly driven by a fossil-fuel-dependent energy system in the absence of universal climate polices, resulted in the highest emissions and radiative forcing in SSP5-8.5 among all scenarios, creating significant challenges to mitigation (Figures 4v and 4w).
3.2 Divergence from other projections
The modelling of our scenario assumptions resulted in internally consistent storylines similar to the SSPs (O'Neill et al., Reference O'Neill, Kriegler, Ebi, Kemp-Benedict, Riahi, Rothman, van Ruijven, van Vuuren, Birkmann, Kok, Levy and Solecki2017), but not necessarily with the same quantitative projections to those of other IAMs (Riahi et al., Reference Riahi, van Vuuren, Kriegler, Edmonds, O’Neill, Fujimori, Bauer, Calvin, Dellink, Fricko, Lutz, Popp, Cuaresma, Kc, Leimbach, Jiang, Kram, Rao, Emmerling and Tavoni2017), due to the new model structural complexity (Subsection 2.1) and different parametrisation (Subsection 2.4). While the scenario projection of marker IAMs (Figure 4) can be interpreted as being representative of a specific SSP–RCP development, they are not to be considered as central, median, or most-likely future developments. This means that for each SSP–RCP combination, numerous alternative projections are possible, and they are equally valid – as long as they are internally harmonious. The projection of scenarios with the FeliX model presented some of these equally valid, yet divergent futures to other model projections. Among the FeliX's divergences from the projections of other IAMs, three are more prominent.
First, the FeliX's projections of coal production in SSP5-8.5 were lower than projections from other marker IAMs from 2070 onwards (Figure 4i), showing more promising futures for renewable energies and a faster decline in fossil energies, even in the fossil-fuelled development pathway. This can be explained by the energy market share structure in FeliX where reduction in energy production from one source is compensated by energy from other (more price-competitive) sources. This model structure, along with assumptions about the declining cost of production from other energy sources over time, made coal less cost competitive compared to other fossil (i.e. gas, oil) as well as renewable (i.e. solar, wind) sources. This propagated a more rapid decline in coal production consistently across all scenarios (more noticeably in SSP5-8.5) in the FeliX model. The issue of conservative assumptions on renewable costs in the global climate (IPCC) scenarios (and hence less competition that can reduce fossil energy production) has been discussed in the literature (Eker, Reference Eker2021; Jaxa-Rozen & Trutnevyte, Reference Jaxa-Rozen and Trutnevyte2021). A lower coal projection in FeliX is also more consistent with the recent governments' pledges for coal phase-out in the 2021 United Nations Climate Change Conference. Similar variations, resulting from differing model structural complexity and parameterisation, were observed among other IAMs where some attributed greater priority to some energy technologies over others. For example, REMIND-MAGPIE and MESSAGE-GOLOBIOM had the highest solar and MESSAGE-GOLOBIOM had the lowest share of oil across all scenarios compared to other models. Despite this lower coal production compared to other models, coal production in SSP5-8.5 projected by FeliX still remained much higher than renewable energy production in the same scenario and was also higher than coal production in other FeliX's SSP–RCP projections. This maintained an internal consistency with the ‘fossil-fuelled development’ narrative (O'Neill et al., Reference O'Neill, Kriegler, Ebi, Kemp-Benedict, Riahi, Rothman, van Ruijven, van Vuuren, Birkmann, Kok, Levy and Solecki2017).
Second, FeliX's projections varied from those of the other IAMs in food and land sector (most notably in SSP1-2.6 and SSP3-7.0), bringing new insights about the impacts of sustainable diet shift (from meat to vegetable) on food demand, food production, and land-use change. The observed variations in food and land are primarily linked to FeliX's diet change structure, an additional sub-model compared to other marker models. In FeliX, demand for agricultural land is driven by the size of food production, which itself is designed to meet food demand. This means that an increase or decrease in food consumption can directly impact food production and agricultural land expansion. The food demand and consumption of vegetables and meat in FeliX were modelled mainly through the diet change sub-model which formalised sustainable diet shift (i.e. reduction in meat consumption) in food systems based on behavioural factors (e.g. social norms and value driven actions) and educational attainments of the population per gender (Eker et al., Reference Eker, Reese and Obersteiner2019). This linked to the food demand from various food categories (animal-based and plant-based foods), and subsequently to food (livestock) production, to demand for arable land (pasture and cropland), and to land-use change (i.e. deforestation). Diet (as a lifestyle driver) was mentioned in the original storylines of SSPs (O'Neill et al., Reference O'Neill, Kriegler, Ebi, Kemp-Benedict, Riahi, Rothman, van Ruijven, van Vuuren, Birkmann, Kok, Levy and Solecki2017), but it was not explicitly modelled with its feedback interactions in most of the major IAMs. However, modelling of diet change, as shifting social norms and changing patterns of human behaviour in food consumption, has become increasingly important (Willett et al., Reference Willett, Rockström, Loken, Springmann, Lang, Vermeulen, Garnett, Tilman, DeClerck, Wood, Jonell, Clark, Gordon, Fanzo, Hawkes, Zurayk, Rivera, De Vries, Majele Sibanda and Murray2019), with impacts on multiple SDGs (food, health, responsible consumption, biodiversity conservation) (Herrero et al., Reference Herrero, Thornton, Mason-D'Croz, Palmer, Bodirsky, Pradhan, Barrett, Benton, Hall, Pikaar, Bogard, Bonnett, Bryan, Campbell, Christensen, Clark, Fanzo, Godde, Jarvis and Rockström2021). Given assumptions on low-caloric food consumption per person per year and low animal calories diet share in SSP1-2.6 (and the opposite in SSP3-7.0), the FeliX projections resulted in low livestock production (Figure 4q), low pastures and croplands (Figures 4s and 4u), and more forest land (Figure 4t) in SSP1-2.6 (and vice versa in SSP3-7.0).
Third, the combination of a sharper decline in coal production as well as varied food consumption patterns in FeliX (as explained above) resulted in lower projections of CO2 emissions, most notably in SSP5-8.5, compared to the other models. This brings a new insight that the consideration of diet change impacts and more aggressive assumptions on fossil fuel reduction can make CO2 emissions less likely follow the projection of current high-emission scenarios (i.e. SSP5-8.5). Such lower emission projections are aligned with the tracked emission developments over the past three decades which followed the middle of projected emission scenarios (Pedersen et al., Reference Pedersen, van Vuuren, Aparício, Swart, Gupta and Santos2020). It also echoes the recent critiques about the relevance of high-emission RCPs (Hausfather & Peters, Reference Hausfather and Peters2020), signifying the importance of considering a broader range of emission projections in sustainability analysis.
3.3 Scenario implications for sustainable development
The complex and deeply uncertain multisector dynamics that underlie the SDGs resulted in substantially varied outcomes for sustainable development across different scenarios and indicators (Figure 5). Among the generated SOWs, the accumulation of changes in SSP1-2.6 between 2050 and 2100 created a promising long-term trajectory for sustainable development. However, this was not the case in generated SOWs under other scenarios, driven by counteracting interactions between future socioeconomic and environmental drivers. The trends in some of the major indicators are described here for illustration while the detailed projections of all indicators are available in Figure 5 and the online dataset.

Figure 5. Implications of modelled scenarios for sustainable development across 50,000 SOWs and in 16 indicators. In each subplot, the envelope plots show each indicator's trajectory across five scenarios with descriptive statistics (mean and standard deviation) to represent the average projected value and the uncertainty range of each indicator's projection. The box plots show the comparative of performance of each scenario compared to the business-as-usual's trajectories (i.e. baseline SSP2-4.5). This shows what would happen (i.e. the scale of improvement or deterioration in each indicator) if we deviate (positively or negatively) from current trajectories (i.e. business-as-usual).
Among the socioeconomic indicators for sustainable development, gross world product (GWP) per capita (Figure 5e-i), adolescent fertility rate (Figure 5b-ii), and mean years of schooling (Figure 5c-i) were the three with the fastest improvement over the century in SSP5-8.5 and SSP1-2.6 (across SOWs) by 2030 and beyond. This was due to input assumptions on investment in high-quality and well-functioning education (Figure 4d) and declining population growth (Figure 4a) under these two scenarios. Despite similar performance in socioeconomic indicators, the human prosperity and economic growth created two different pathways for environmental impacts and for achieving sustainable development under SSP1-2.6 and SSP5-8.5.
In SSP1-2.6, the high level of socioeconomic prosperity led to improving trajectories in major energy and climate indicators by 2030. In a longer timeframe and by 2100, the increasing scale of positive socioeconomic change in this scenario achieved more than 85% (global average) share of renewable energy supply (Figure 5d-i), close to 430 ppm CO2 concentration (Figure 5g-i), and <2°C global temperature change (Figure 5g-ii). The SSP1-2.6 scenario also resulted in a significant drop in total agricultural activities (Figure 4r), positively impacting several SDG indicators related to food and land-use change. Among these positive impacts was SSP1-2.6's declining trend in (land-based) animal calorie supply (Figure 5a-ii) due to a decreasing population after 2050 (Figure 4a) and lower meat consumption. Reducing demand for food through responsible consumption and collective global action on food choices under this scenario could alleviate the pressure from the COVID-19 pandemic on the food system, helping those worst-affected by the distributional impacts on food supply chains. The SSP1-2.6 scenario also outperformed other scenarios in some of the major responsible production and biodiversity conservation indicators, such as yield improvement (Figure 5a-i), reduced pressure from agricultural land expansion and fertiliser use (Figures 5f-i, 5f-ii), and less deforestation and biodiversity loss (Figures 5h-i, 5h-ii).
By contrast, socioeconomic prosperity in SSP5-8.5 resulted in the fastest growth in the share of fossil fuels in energy supply (Figure 5d-i) driven by increasing demand from high-energy intensity of industry and services (Figure 4h). Reliance on fossil fuels in this scenario translated into severe climate impacts from (energy-related) high CO2 concentration (Figure 5g-i) with global temperature continuing to rise to almost 4.5°C by 2100 in all simulated SOWs (Figure 5g-ii). This imposed a severe risk for achieving the IPCC climate targets (Rogelj et al., Reference Rogelj, Shindell, Jiang, Fifita, Forster, Ginzburg, Handa, Kheshgi, Kobayashi, Kriegler, Mundaca, Séférian and Vilariño2019). The SSP5-8.5 scenario also resulted in a high land-based animal calorie supply up to 50% (across all SOWs) higher than the business-as-usual trajectories driven by the economic welfare combined with high meat-based diets (Figure 5a-ii). This led to the higher production of crops in this scenario as livestock feed (Figure 4q). However, high crop and livestock yields and effective land management practices fuelled by high GWP and rapid technology advances, as described in this scenario's assumptions (Supplementary Table S1), enabled the achievement of high food demand and production with less agricultural land (Figure 4r). This resulted in improving trajectories in indicators related to forest land (Figure 5h-i) throughout the 21st century.
Far less improvement occurred in SSP3-7.0 and SSP4-6.0 across all indicators and SOWs. The global trajectories under these two scenarios deteriorated in most of socioeconomic, energy, climate, and biodiversity indicators. This resulted from the combined effects of the medium to high population (Figure 4a), slow economic growth (Figure 4e), low investment in higher education (Figure 4d), high-energy demand from inefficient and high-energy intensity infrastructure (Figure 4h), low diffusion of renewable energy (Figure 4f), and extreme pressure on lands from agricultural activities and high animal calorie consumption (Figures 4r and 4q), as discussed in Subsections 3.1 and 3.2. For instance, trends over the century reached around 3–4°C warming (compared to the pre-industrial level), significantly exceeding the 1.5–2°C target from the Paris Agreement (Figure 5g-ii). Similar negative drivers across these two scenarios also resulted in extreme-range trajectories in indicators related to food production (Figure 5a-ii), fertiliser use (Figures 5f-i, 5f-ii), and biodiversity across all SOWs by 2030 and beyond (Figures 5h-i, 5h-ii). For example, high rates of fertiliser application in agriculture (up to 40% higher than business-as-usual; Figure 5f-i) and the steep decline in forest land and species abundance (up to 30% and 50% decline compared to business-as-usual respectively; Figures 5h-I, 5h-ii) under SSP3-7.0 were attributed in the model to the complex underlying dynamics of high population growth along with unhealthy diets with a high animal calorie diet that increases the demand for feed crops. As a result of this high feed demand, the pressure on natural and agricultural lands increased strongly (Figure 4r), resulting in further demand for fertiliser application and greater deforestation and biodiversity loss.
4. Conclusions and future work
Interacting systems, with multisectoral dynamics that occur at an unprecedented pace, can create complexity and uncertainty in understanding the impacts of future socioeconomic and environmental change on sustainable development. Despite the popularity of standard (marker) IAMs as widely used tools to understand environmental and societal risks of climate change, the knowledge that is put into these models (e.g. conceptual framing, boundary conditions, model structure, parametrisation) is imperfect, limited, and uncertain (Walker et al., Reference Walker, Lempert, Kwakkel, Gass and Fu2013). This uncertainty challenges the ideal of the marker models as the projection tools, which turn best available knowledge into best estimates. One way of dealing with this combination of uncertainty and complexity is through scenario exploration with a greater diversity of models that have new modelling paradigms (e.g. system dynamics), different structural complexity (e.g. feedback-rich), and alternative assumptions, and can better simulate the underlying multisectoral dynamics for the assessment of sustainable development (Moallemi et al., Reference Moallemi, Kwakkel, de Haan and Bryan2020a).
We implemented global scenarios in a non-marker, SDG-focused IAM to investigate the new uncertainty of future projections for sustainable development. First, it contributed to sustainability science by exploring broader implications of global scenarios beyond the original foci of climate change and in sustainable development across multiple SDGs. Second, the methodology used for the adoption of global scenarios was a generalisable contribution too. The methodology can be adopted beyond the SDGs and in the projections and quantifications of other sustainability frameworks (e.g. social and planetary boundaries (Leach et al., Reference Leach, Raworth and Rockström2013; Steffen et al., Reference Steffen, Richardson, Rockström, Cornell, Fetzer, Bennett, Biggs, Carpenter, de Vries, de Wit, Folke, Gerten, Heinke, Mace, Persson, Ramanathan, Reyers and Sörlin2015), safe and just operating space (Raworth, Reference Raworth2012), doughnut economics (Raworth, Reference Raworth2017)) to bring new insights about social and biophysical indicators that are not directly measured in the SDGs. The use of this methodology also allows a greater diversity of similar non-marker models to be adopted for global change and sustainability assessments; something important for expanding the current limits of benchmark scenarios and exploring a larger uncertainty space driven by new model structures (e.g. diet change impacts).
While we evaluated the trajectories of a subset of SDG indicators to demonstrate the implications of global scenarios, measuring the actual progress in all SDGs or discovering the individual contribution of socioeconomic (SSP) versus climatic (RCP) drivers in making the progress was not our focus. An important next step is to focus on SDG progress analysis specifically and model a larger diversity of indicators under all SDGs (Allen et al., Reference Allen, Metternicht, Wiedmann and Pedercini2019; Soergel et al., Reference Soergel, Kriegler, Weindl, Rauner, Dirnaichner, Ruhe, Hofmann, Bauer, Bertram, Bodirsky, Leimbach, Leininger, Levesque, Luderer, Pehl, Wingens, Baumstark, Beier, Dietrich and Popp2021). One can also adopt post-processing techniques (e.g. scenario discovery cluster analysis (Guivarch et al., Reference Guivarch, Rozenberg and Schweizer2016; Rozenberg et al., Reference Rozenberg, Guivarch, Lempert and Hallegatte2014)) to identify the main socioeconomic and climate-driving forces of each SDG indicator and to quantify the extent of their (positive or negative) contributions to the SDG progress.
While we explored the prevalent uncertainty of several indicated model parameters, we acknowledge that we did not include all forms of uncertainties, and not specifically those severe forms of uncertainty (i.e. unknown circumstances or state of total ignorance), which cannot be fully represented in models (Stirling, Reference Stirling2010). Future work is needed to incorporate other techniques and approaches (e.g. scenario discovery, robustness analysis, adaptive policy-making) to identify tipping points as warning signs, employ monitoring processes, and execute multiple pathways to be prepared for future contingencies. These can enable proactive and anticipatory responses to external shocks and help decision-makers in keeping human and environmental systems on-track towards sustainability targets in the face of severe uncertainties. A longer-term analysis of climatic and biophysical uncertainties (e.g. the carbon cycle change, atmospheric composition, nitrogen cycle) in a time horizon beyond 2100 (Meinshausen et al., Reference Meinshausen, Nicholls, Lewis, Gidden, Vogel, Freund, Beyerle, Gessner, Nauels, Bauer, Canadell, Daniel, John, Krummel, Luderer, Meinshausen, Montzka, Rayner, Reimann and Wang2020) may also reveal new insights about (de)stabilisation and multi-century dynamics of sustainability indicators, which cannot be properly understood in a century-long timeframe.
Further enhancing the robustness of insights obtained about the SDGs requires the expansion of scenario space and its uncertainty exploration to include similar sustainability analyses over many other possible combinations of SSPs and RCPs (O'Neill et al., Reference O’Neill, Carter, Ebi, Harrison, Kemp-Benedict, Kok, Kriegler, Preston, Riahi, Sillmann, van Ruijven, van Vuuren, Carlisle, Conde, Fuglestvedt, Green, Hasegawa, Leininger, Monteith and Pichs-Madruga2020). However, this comes at the expense of increasing the computational costs of simulations. Our model-based assessment of the SDGs was no exception. Our results and their interpretations in this article were based on the assumptions of only five specific SSP–RCP combinations, and there were other potential combinations that we did not investigate. For example, our most sustainable scenario was developed based on SSP1-2.6. While SSP1-2.6 can substantially control environmental damages from energy and climate impacts relative to our other scenarios, the SSP1-2.6 scenario is not still aligned with IPCC mitigation pathways which limit global warming to 1.5°C (Rogelj et al., Reference Rogelj, Shindell, Jiang, Fifita, Forster, Ginzburg, Handa, Kheshgi, Kobayashi and Kriegler2018b). Future research can construct SSP1 in the FeliX model in line with the pathways of more aggressive actions (i.e. more ambitious Nationally Determined Contributions under the Paris Agreement) and more extreme mitigation pathways (e.g. aligned with 1.9 W m−2 radiative forcing level or with pathways proposed by the IPCC 1.5 (IPCC, 2018)). This could potentially improve the performance of the SSP1 scenario across energy and climate indicators (e.g. faster emissions reduction) compared to our results, driven by for example a greater reliance on atmospheric CDR technologies and practices (Smith et al., Reference Smith, Davis, Creutzig, Fuss, Minx, Gabrielle, Kato, Jackson, Cowie, Kriegler, van Vuuren, Rogelj, Ciais, Milne, Canadell, McCollum, Peters, Andrew, Krey and Yongsung2016). However, it should be noted that more aggressive assumptions such as a very high level of CDR have not been demonstrated in practice and may cause other sustainability issues such as competition with food and agricultural sectors for land and water (Rogelj et al., Reference Rogelj, Shindell, Jiang, Fifita, Forster, Ginzburg, Handa, Kheshgi, Kobayashi and Kriegler2018b). Hence, policy cost and feasibility assessment become an important research direction in future studies with scenarios of more aggressive emission reduction and with potential spillover effects on other sectors (Brutschin et al., Reference Brutschin, Pianta, Tavoni, Riahi, Bosetti, Marangoni and van Ruijven2021).
The further enhancement of the robustness of results also requires the expansion of feedback interactions included in models. Sustainable development is driven by dynamic interactions between human and natural systems (van Vuuren et al., Reference van Vuuren, Batlle Bayer, Chuwah, Ganzeveld, Hazeleger, van den Hurk, van Noije, O’Neill and Strengers2012). For example, climate change (in the natural system) can increase heating and cooling energy demand (in the human system), and at the same time the resulted impacts on energy demand can interact with and deteriorate climate and air pollution. While FeliX integrated some of these destabilising (reinforcing) and stabilising (balancing) feedback interactions as an indivisible whole in a system dynamics model, it still did not model several of these interactions underlying different SDGs (e.g. the tipping point effects of climate change on wildfires, deforestation). Research is needed to further integrate the representation of socioeconomic factors in climate and carbon cycle dynamics and the inclusion of biogeophysical processes in energy production, land-use change, and emissions. Examples can include interactions between climate change and crop growth (e.g. carbon concentration reduces natural vegetation), land-use (e.g. prolonged precipitation influences land management decisions), energy use (e.g. rising temperature increases energy demand), and human behaviour (perceived climate extreme event risks alter human emissions) (see Calvin and Bond-Lamberty (Reference Calvin and Bond-Lamberty2018) for a recent review). A further modelling of feedback interactions can enable a better identification of effective interventions to maximise synergies and minimise trade-offs across sectors.
The discussion of scale and interactions between global, national, and local efforts in modelling the SDGs under uncertainty can also play a crucial role in future scenario modelling for the SDGs (Verburg et al., Reference Verburg, Dearing, Dyke, Leeuw, Seitzinger, Steffen and Syvitski2016). In this article, we characterised the future development of socioeconomic, food and land, energy, and climate systems at a global scale. Other studies have also mostly analysed these scenarios either at global (Randers et al., Reference Randers, Rockström, Stoknes, Goluke, Collste, Cornell and Donges2019), regional (Soergel et al., Reference Soergel, Kriegler, Weindl, Rauner, Dirnaichner, Ruhe, Hofmann, Bauer, Bertram, Bodirsky, Leimbach, Leininger, Levesque, Luderer, Pehl, Wingens, Baumstark, Beier, Dietrich and Popp2021), or national (Gao & Bryan, Reference Gao and Bryan2017) scales. However, large-scale and global scenarios in reality translate into local changes in human interactions with the environment (Moallemi et al., Reference Moallemi, Malekpour, Hadjikakou, Raven, Szetey, Ningrum, Dhiaulhaq and Bryan2020b). Grassroots solutions led by local communities, cities, and businesses can also make synergies with the aspirations of the higher scales and significantly impact the unfolding of higher-level sustainability scenarios (Bandari et al., Reference Bandari, Moallemi, Lester, Downie and Bryan2021; Bennett et al., Reference Bennett, Biggs, Peterson and Gordon2021; Szetey et al., Reference Szetey, Moallemi, Ashton, Butcher, Sprunt and Bryan2021a, Reference Szetey, Moallemi, Ashton, Butcher, Sprunt and Bryan2021b). This brings new challenges for modelling the cross-scale dynamics of scenarios that can account for both higher spatial and temporal resolutions where policy-making (e.g. carbon pricing) and biophysical processes (e.g. greenhouse gas emissions) operate, as well as for locally-specific and place-based dynamics, such as the representation of heterogeneous actors (Ilkka et al., Reference Ilkka, Isabela, Nicolas, Matteo, Oreane, Johannes, Panagiotis, Celine, Mathijs, Julien, Thomas Le, Marian, Will, Jean-Francois, Roberto, Evelina and Fabian2021) and their inequalities (Emmerling & Tavoni, Reference Emmerling and Tavoni2021). Future work on integrated assessment modelling, therefore, requires capturing and better incorporating the societal dynamics of lower scales (beyond the currently global, regional, or national assumptions) in scenario exploration and projections for sustainability (Liu et al., Reference Liu, Hull, Batistella, DeFries, Dietz, Fu, Hertel, Izaurralde, Lambin, Li, Martinelli, McConnell, Moran, Naylor, Ouyang, Polenske, Reenberg, de Miranda Rocha, Simmons and Zhu2013). This can lead to more reliable insights for sustainable development that can account for the diversity of local preferences and priorities and the heterogeneities in the availability of resources across regions. Such insights enable a more just and inclusive sustainable development by tailoring the plans to the unique socio-ecological characteristics of each context (Moallemi et al., Reference Moallemi, Malekpour, Hadjikakou, Raven, Szetey, Moghadam, Bandari, Lester and Bryan2019).
Supplementary material
The supplementary material for this article can be found at https://doi.org/10.1017/sus.2022.7.
Acknowledgements
The authors would like to thank the anonymous reviewers for their constructive comments and suggestions for improvement.
Author contributions
Conceptualisation: E. A. Moallemi; data curation: E. A. Moallemi, S. Eker, L. Gao; formal analysis: E. A. Moallemi, S. Eker, L. Gao, B. A. Bryan; funding acquisition: B. A. Bryan; investigation: E. A. Moallemi, S. Eker, L. Gao, B. A. Bryan; methodology: E. A. Moallemi, S. Eker, L. Gao; visualisation: E. A. Moallemi; writing – original draft: E. A. Moallemi; writing – review and editing: E. A. Moallemi, S. Eker, L. Gao, B. A. Bryan.
Financial support
This work is funded by The Ian Potter Foundation and Deakin University (Grant number: 20190016).
Conflict of interest
The authors declare no conflict of interest.
Code and data availability
The datasets/code generated during this study are available at https://zenodo.org/record/5339013. Further information and requests for resources and reagents should be directed to and will be fulfilled by Enayat A. Moallemi (email: e.moallemi@deakin.edu.au).


 Open access