


Evidence is growing for a sixth mass extinction in the Anthropocene (Ceballos et al., Reference Ceballos, Ehrlich, Barnosky, García, Pringle and Palmer2015) but for plants relatively few species have been officially declared extinct, with < 150 on the IUCN Red List of Threatened Species (IUCN, 2017). More than 50,000 plants are estimated to be under threat (Kew, 2017) but it can take many years for a plant species to become extinct even when populations are functionally extinct (Cronk, Reference Cronk2016), suggesting a massive extinction debt (Hanski, Reference Hanski2000; Kuussaari et al., Reference Kuussaari, Bommarco, Heikkinen, Helm, Krauss and Lindborg2009; Gilbert & Levine, Reference Gilbert and Levine2013). The Red List (IUCN, 2017) is perhaps the most reliable indicator of extinction and extinction threat because it uses rigorously applied and standardized criteria. IUCN defines the category Extinct as when ‘there is no reasonable doubt that the last individual has died’ (IUCN, 2001). There is uncertainty surrounding documented plant extinctions (Vellend et al., Reference Vellend, Baeten, Becker-Scarpitta, Boucher-Lalonde, Mccune and Messier2017) and there can be costs associated with misclassifying extinct species (Akçakaya et al., Reference Akçakaya, Keith, Burgman, Butchart, Hoffmann and Regan2017). Akçakaya et al. (Reference Akçakaya, Keith, Burgman, Butchart, Hoffmann and Regan2017) and Keith et al. (Reference Keith, Butchart, Regan, Harrison, Akçakaya, Solow and Burgman2017) suggest setting thresholds for the probability of extinction and to classify species as extinct, possibly extinct, and extant. The Red List data are therefore neither perfect nor comprehensive (many taxa have not been assessed) but the List is nevertheless widely regarded as the best indicator of the degree of extinction of individual species. Here, data collated from the publicly available Red List, of Extinct plant species and of Critically Endangered plant species with populations in decline, are examined to address three questions: (1) How do background, continental, and island plant extinction rates compare? (2) Are biological and physical island parameters associated with plant extinction? (3) Are any plant traits associated with extinction and if so do these differ between islands and continents?
Data for extinct species were retrieved from the Red List (IUCN, 2017). A Critically Endangered subset of species was also selected, including only those with a population trend categorized as declining. These latter data were used as indicators of species that potentially could become extinct in the near future and are therefore likely to be indicative of ongoing extinction processes. Extinction date can be difficult to determine. We therefore used the date last seen, retrieved from the Red List and spanning 1750–2017, for our analysis. If a date was absent from the Red List, floras, herbaria databases, specimens and other sources were checked. These sources were also used to compile plant traits. The number of extinctions were summed per year, plotted as the cumulative proportion of all species assessed against time (cf. Ceballos et al., Reference Ceballos, Ehrlich, Barnosky, García, Pringle and Palmer2015), and compared with an estimated background rate for plant extinction of 0.05–0.13 E/MSY (i.e. 0.15 extinctions per million species-years; Levin & Wilson, Reference Levin and Wilson1976; Stanley, Reference Stanley1985; De Vos et al., Reference De Vos, Joppa, Gittleman, Stephens and Pimm2015; Vellend et al., Reference Vellend, Baeten, Becker-Scarpitta, Boucher-Lalonde, Mccune and Messier2017) and a high background rate of 0.15 E/MSY (Pimm et al., Reference Pimm, Jenkins, Abell, Brooks, Gittleman and Joppa2014).
Islands are often considered discrete crucibles of evolution, and can form useful case studies because of their distinct boundaries. To determine whether abiotic and/or biotic parameters are associated with extinction a number of islands datasets were combined and analysed (UNEP, 2004; Weigelt & Kreft, Reference Weigelt and Kreft2013; Gray & Cavers, Reference Gray and Cavers2014; Weigelt et al., Reference Weigelt, Daniel Kissling, Kisel, Fritz, Karger and Kessler2015). These data were collated to test for differences between islands where extinction has occurred and those where it has not been recorded (Table 1). As the data did not satisfy the assumptions of parametric statistical methods a non-parametric approach was adopted for examining differences in these parameters between islands where extinction or Critically Endangered species occur and islands where extinctions or Critically Endangered species are absent, using asymptotic Kruskal-Wallis tests in R v. 3.3.1 (R Development Core Team, 2017) using the package coin (Hothorn et al., Reference Hothorn, Hornik, Wiel and Zeileis2008).
Table 1 Parameters potentially associated with extinction of plant species on islands (data from the IUCN Red List, 2017), with median values for islands where species extinction has occurred and for islands where no extinction has been recorded, and separately for the subset of plant species that are categorized as Critically Endangered and have declining populations, with results of the asymptotic Kruskal-Wallis test for islands with and without extinctions and for islands on which Critically Endangered species are present or absent.

1 Numerical indicator based on the number and threat of invasive species (UNEP, 2004); 0, few or no introductions; 1, some introductions (e.g. rats, common weeds); 2, common domestic introductions (e.g. dogs, cats, pigs); 3, some problems with invasive species; 4, major problems with invasive species; 5, devastated by invasive species.
2 Human Impact Indicator calculated according to island population density, growth rate and level of tourism.
3 Annual population growth rate: <0, decreasing; 0–1%, stable; 1–2%, increasing slowly; 2–3%, increasing; >3%, increasing rapidly.
4 Percent of the population occupied in agriculture.
5 Gross Domestic Product per capita (USD).
6 An index of temperature change derived from spatial temperature gradients and multimodel forecasts of temperature increase rates for the 21st century, representing the instantaneous local velocity along Earth's surface needed to maintain constant temperatures (Loarie et al., Reference Loarie, Duffy, Hamilton, Asner, Field and Ackerly2009).
7 Shortest distance from an island to the nearest mainland.
8 The proportion of landmass surrounding each island in distance classes up to 5,000 km radius, multiplied by –1.
a UNEP (2004).
b Weigelt et al. (Reference Weigelt, Daniel Kissling, Kisel, Fritz, Karger and Kessler2015), Weigelt & Kreft (Reference Weigelt and Kreft2013).
Extinction rates for plants are above both a background rate of 0.05–0.13 E/MSY and above a higher background rate of 0.15 E/MSY (Fig. 1). This pattern is evident using either the full list of extinct plant species (including species assessed using versions of the IUCN Red List prior to the adoption of the current v. 3.1 Red List categories; IUCN, 2001) and only those species assessed using the v. 3.1 criteria. The data also indicate that plant extinctions are dominated by species loss from islands (Fig. 1). Although speciation could potentially increase during the Anthropocene (Vellend et al., Reference Vellend, Baeten, Becker-Scarpitta, Boucher-Lalonde, Mccune and Messier2017), these findings are of concern because estimated single island endemic speciation rates (Gray & Cavers, Reference Gray and Cavers2014) are only slightly above a background extinction rate of 0.15 E/MSY. The data for extinct species and island physical and biological datasets suggest that lower competitive ability and climate change velocities, and anthropogenic factors, may be associated with extinction events (Table 1). Islands with known plant extinctions have higher human population densities, greater anthropogenic impacts and a higher invasive species index (Table 1). Where plant extinctions have occurred, islands appear to have higher mean temperatures but less temperature variability, higher precipitation but less variability, higher elevation, are more isolated, and are larger in area, but have a lower surrounding landmass proportion and lower climate change velocities (Table 1). Although these data need to be interpreted cautiously as the overlap between the UNEP (2004) island database and those islands on the Red List is low (e.g. only 9 islands of the 234 listed on the UNEP list have extinction events for human impact), the results are as expected.
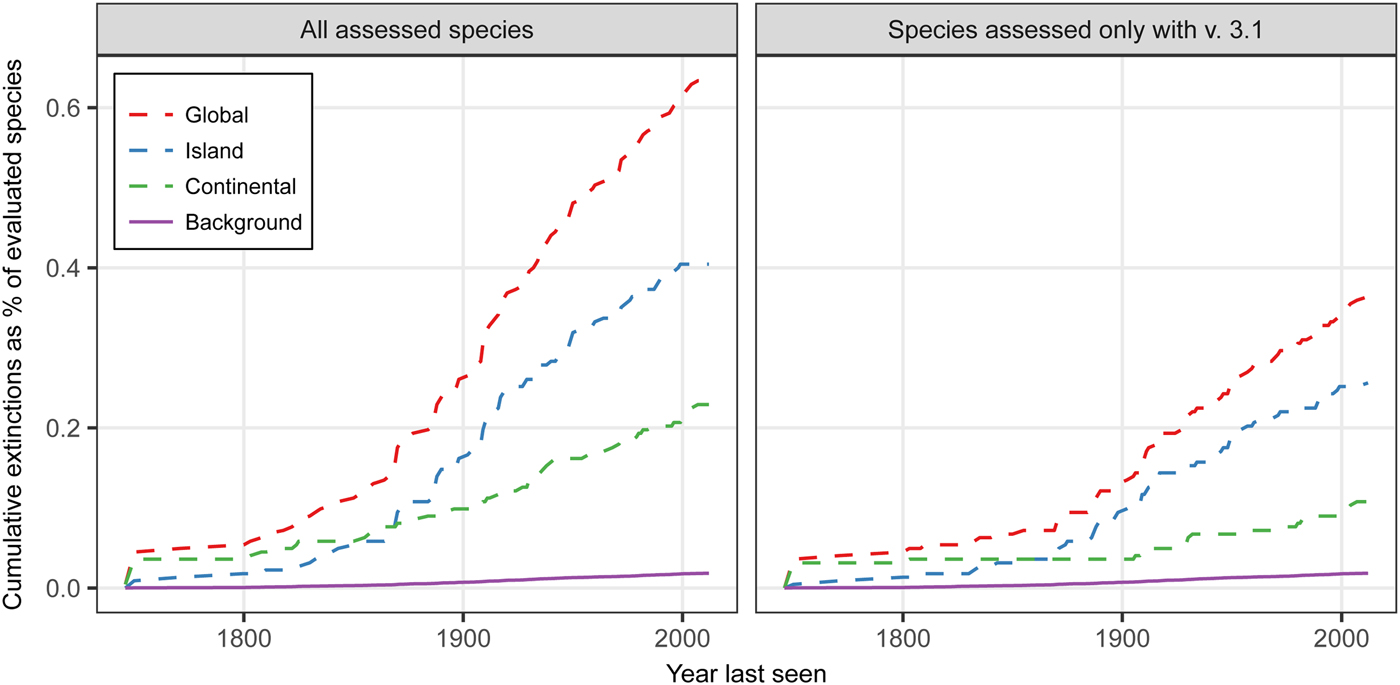
Fig. 1 Plant extinction rates for global, island and continental areas during 1750–2017 compared to a high background rate of 0.15 extinctions per 10,000 species per 100 years (0.15 E/MSY) for: (a) all species in the Red List (IUCN, 2017), including those categorized prior to v. 3.1 of the Red List criteria (IUCN, 2001), and (b) only those species categorized using v. 3.1 of the Red List criteria.
Repeating these analyses for Critically Endangered species whose populations are in decline largely mirrors this pattern, suggesting that drivers of plant extinctions may have an inertia that could last well into the future (Table 1). Islands where Critically Endangered species with declining populations occur also seem to be associated with lower climate change velocities (Table 1). This may be an intrinsic vulnerability of species that have evolved in ecosystems buffered from climate variability, and when climate does change (even at low velocity), these species could be particularly maladapted. In addition, low velocity anthropogenic climate change may still be high velocity with respect to natural climate change because anthropogenic climate change is additional to natural change. Where extinction has occurred on islands, overall species richness also appears to be lower, suggesting that insular species may have evolved in less competitive environments, perhaps leading to a predisposition to be vulnerable to invasive species. That climate variables can be associated with island extinctions is potentially of concern.
A number of characteristics or traits, such as an epiphytic lifestyle, floral symmetry, biotic pollination, breeding system type, flowering period, seed production and ploidy level, have been linked to an elevated risk of plant extinction (Kew, 2017). However, it is unclear whether these patterns are universal, as data for most species traits have yet to be combined on a global scale. The trait data for the Red List are of a broadly similar pattern for islands and continents, and indicate that most plant extinctions have been of woody perennials that relied on biotic pollination and dispersal, produced fruit with few seeds, and possessed symmetrical flowers (Supplementary Table 1). Perhaps the clearest finding is that the majority of extinct plants are associated with forest habitats. Given deforestation rates throughout the modern era (considered here as post 1745) this may not be surprising. However, the Red List is not exhaustive and may be taxonomically and/or geographically biased, and the plant list is dominated by trees, and thus the traits for extinction are also biased towards trees. That the majority (82%) of Critically Endangered plants that have declining populations largely mirror these patterns and that most are from forests should still be a concern despite this bias (Supplementary Table 1). However, the domination of the list by forest species also suggests a significant gap in our understanding of plant extinction. Lastly, irregular floral symmetry appears to be more associated with Critically Endangered plants that have declining populations, in contrast to extinct species.
If we assume that Fig. 1 is indicative of the extinction processes happening to all plants globally, this increases the evidence for a sixth mass extinction. Additionally, we know these are underestimates and there may be extinction debt and lag periods to extinction (Hanski, Reference Hanski2000; Kuussaari et al., Reference Kuussaari, Bommarco, Heikkinen, Helm, Krauss and Lindborg2009; Gilbert & Levine, Reference Gilbert and Levine2013; Cronk, Reference Cronk2016). Our actions are resulting in non-random extinction patterns at an increasing rate, are affecting islands disproportionately, and are likely to be exacerbated by climate change.
The main drivers of plant extinction are known (habitat loss, invasive species and climate change) but nevertheless extinctions continue. There are many initiatives to conserve plant biodiversity, including the Global Strategy for Plant Conservation (CBD, 2017), and, although deforestation rates are high, they are decreasing (MacDicken et al., Reference Macdicken, Jonsson, Piña, Marklund, Maulo and Contessa2016). If the data presented here are indicative, environments that are species poor and have low climate change velocity may indicate increased likelihood of extinction. On islands and where populations are small and comprise species with small and decreasing gene pools, techniques such as genetic rescue are likely to be required to address problems such as inbreeding depression (Cronk, Reference Cronk2016; Gray et al., Reference Gray, Perry, Cavers, Eastwood, Biermann and Darlow2017). Accordingly, it is going to be increasingly important to find effective ways of identifying and conserving plant genetic diversity. The genomes of rare plants could be sequenced to understand and address the genetic problems they face (Cronk, Reference Cronk2016), and this information could be integrated with assessments of morphological diversity obtained by germinating plants under uniform conditions from species held in seed banks. The recent adoption of tree genetic units (IUCN, 2016) may be a useful model in this respect.
Increasing attention to novel mechanisms for addressing extinction (such as payments for ecosystem services, and natural capital) overemphasizes economic motivation, ignoring factors such as community buy-in and land tenure (Fisher, Reference Fisher2012; Davis & Goldman, Reference Davis and Goldman2017). Many rare species have minimal monetary value or provide few ecosystem services, and therefore payments for ecosystem services or related mechanisms may not be an effective way to lower extinction rates, particularly as such mechanisms may be unsustainable in the long term (Fisher, Reference Fisher2012). Given the higher risk of plant extinction on islands, assessment of genetic and morphological diversity could be prioritized for island plant species. In Supplementary Material 1 I provide an example proposed motion to the World Conservation Congress, on integrating native and endemic island genetic diversity into conservation objectives, and in Supplementary Table 2 I propose the minimum requirements for genetic conservation units of such species under the example proposed motion.
Acknowledgements
I thank the IUCN staff and volunteers and all those who contribute to the Red List, and Martin Fisher, Quentin Cronk and an anonymous reviewer for their critiques. This work was funded by the Natural Environment Research Council.
Conflicts of interests
None
Biographical sketch
Alan Gray is a botanist with a long-term interest in conservation and island ecology. His research interests include plant physiology, population genetics, island plants and invertebrates, peatland ecology, and the interactions between vegetation, land use, biogeochemistry and climate change.


