


Literature conceptualizes the community food environment as the physical presence of food retail in the territory, determined by the distribution of food stores, food service and any physical entity by which food may be obtained, or a connected system that allows the access to food( 1 ). The availability of healthy or unhealthy foods in the community food environment affects food consumption and, consequently, body weight and other health outcomes( Reference Dunn 2 – Reference Zeng, Thomsen and Nayga 5 ).
On a micro level, there is the consumer food environment, defined by the food options within a store where individuals purchase food( Reference Gustafson, Hankins and Jilcott 6 ). Consumers are constantly induced to purchase ultra-processed foods, which are industrial formulations mostly or entirely made from industrial ingredients and typically contain little or no whole foods( Reference Monteiro, Levy and Claro 7 ), specifically in supermarkets and similar establishments, through display on shelves, promotions or attractive packaging, or by visual advertisements present in these spaces( Reference Stanton 8 , Reference Taillie, Ng and Popkin 9 ). Ultra-processed foods occupy most shelves of supermarkets; however, fresh foods such as vegetables, fruits, breads, milk and cheeses can also be found in these stores( Reference Stanton 8 ). In high-income countries such as Canada and the USA, proximity to supermarkets that sell fresh foods is associated with lower prevalence of obesity, compared with living in areas with only local stores, where a lower variety of products is available( Reference Lopez 10 , Reference Larsen, Cook and Stone 11 ).
Among many factors that determine food acquisition and consumption, such as availability, quality and variety, the importance of prices is highlighted( Reference Drewnowski 12 ). Big supermarket chains can acquire and offer various products at affordable prices, influencing consumer purchase decisions( Reference Reardon and Timmer 13 ). Small local markets do not have the same chance to acquire products with competitive prices. Hence, their products tend to be more expensive( Reference Reardon, Barrett and Berdegué 14 ). Studies conducted in high-income countries have associated low cost of foods with high degree of processing( Reference Grow, Cook and Arterburn 15 , Reference Pan, May and Wethington 16 ). On the contrary, in Brazil, ultra-processed foods are still relatively more expensive than unprocessed or minimally processed foods( Reference Moubarac, Claro and Baraldi 17 ). This relationship, however, can change depending on factors such as place of purchase( Reference Evans, Banks and Jennings 18 ) and seasons of fruits and vegetables( Reference Mishra and Kumar 19 ).
To assess characteristics of communities’ and consumers’ food environment, researchers developed a specific observational tool for the Obesogenic Environment Study in São Paulo, Brazil (ESAO-SP). The results showed that supermarkets, large chain grocery stores, open-air food markets and specialty fruit and vegetable stores had significantly higher availability and variety of fresh produce and lower availability of ultra-processed foods (e.g. soda and corn chips), compared with locally owned grocery stores and corner stores( Reference Duran, Lock and Latorre 20 ).
It should also be noted that Brazilians have increasingly chosen supermarkets as a place to purchase food. Data show that a higher proportion of purchases made in these establishments consists of ultra-processed foods, which could favour unhealthy consumption patterns considering the nutritional quality of these foods( Reference Machado, Claro and Canella 21 ). Regarding social determinants, poor or socially vulnerable neighbourhoods tend to have less variety and few establishments that sell healthy foods at affordable prices in relation to more favoured socio-economic neighbourhoods( Reference Maguire, Burgoine and Monsivais 22 ).
In this light, knowing the availability and characteristics of foods in supermarkets and similar establishments, in the context of a Brazilian town in the countryside, can help to identify areas with greater need for implementation and reinforcement of public policies aimed to increase the availability of healthy foods and raise barriers to the acquisition of ultra-processed foods, contributing to healthier food environments. There are few studies in low- and middle-income countries with a similar approach( Reference Duran, Lock and Latorre 20 , Reference Duran, Diez Roux and Latorre Mdo 23 ).
Therefore, the aim of the present study was to verify differences in the availability, variety, quality and price of unprocessed and ultra-processed foods in supermarkets, hypermarkets and similar establishments in neighbourhoods of different social deprivation levels.
Methods
Design and sampling
The present study was a cross-sectional study conducted in July 2016 in the city of Juiz de Fora, Minas Gerais, Brazil, involving supermarkets and other establishments in the food retail sector. We used primary and secondary data.
Juiz de Fora is classified as a large-sized city due to its economic and administrative function as well as its population size( 24 , Reference Stamm, Staduto and Lima 25 ). The urban area of the municipality is composed by 446 551 km2. In 2010, its gross domestic product per capita, monthly per capita income and Municipal Human Development Index were $US 10 992·91, $US 361·82 and 0·778, respectively. In the same year, a total population of 516 247 inhabitants was registered( 24 ).
A secondary database containing the full addresses of all supermarkets and other establishments in the food retail sector in Juiz de Fora for the year 2016 was obtained from the Minas Gerais State Secretariat of Finance. The Secretariat is a governmental body that has information on the location of commercial establishments described according to the National Classification of Economic Activities. The National Classification of Economic Activities is comparable to a label that describes and categorizes the different types of commercial establishments according to their main economic activity( 26 ).
Sample size calculation was performed in the statistical software package Stata version 14.0 by selecting the sample size estimation option for comparing independent means. For calculating, we considered the mean Healthy Food Store Index (HFSI) score of supermarkets assessed in low-income (8·50 (sd 3·54)) and high-income (13·00 (sd 1·00)) areas of São Paulo city, Brazil, where the first study using the same instrument was performed( Reference Duran, Lock and Latorre 20 ), 80 % power and 5 % significance level. Thus, the minimum sample size estimated was twenty-four establishments.
There were sixty-eight supermarkets and hypermarkets in the database. All supermarkets and hypermarkets present in the municipality were considered, except those belonging to a supermarket chain first included also located in a region with the same socio-economic level as the included one (n 26, 38·24 %). This procedure is justified due to the similarity in variety, quality and price of products sold in supermarkets of the same chain and in neighbourhoods with homogeneous socio-economic characteristics. After this procedure, forty-two establishments (61·76 % of the total) were selected to compose the sample.
From the forty-two selected and visited establishments, nine were excluded from the study when the field researchers noticed they were engaged in other commercial activities or had duplicate addresses. Finally, the analyses were conducted in thirty-three establishments.
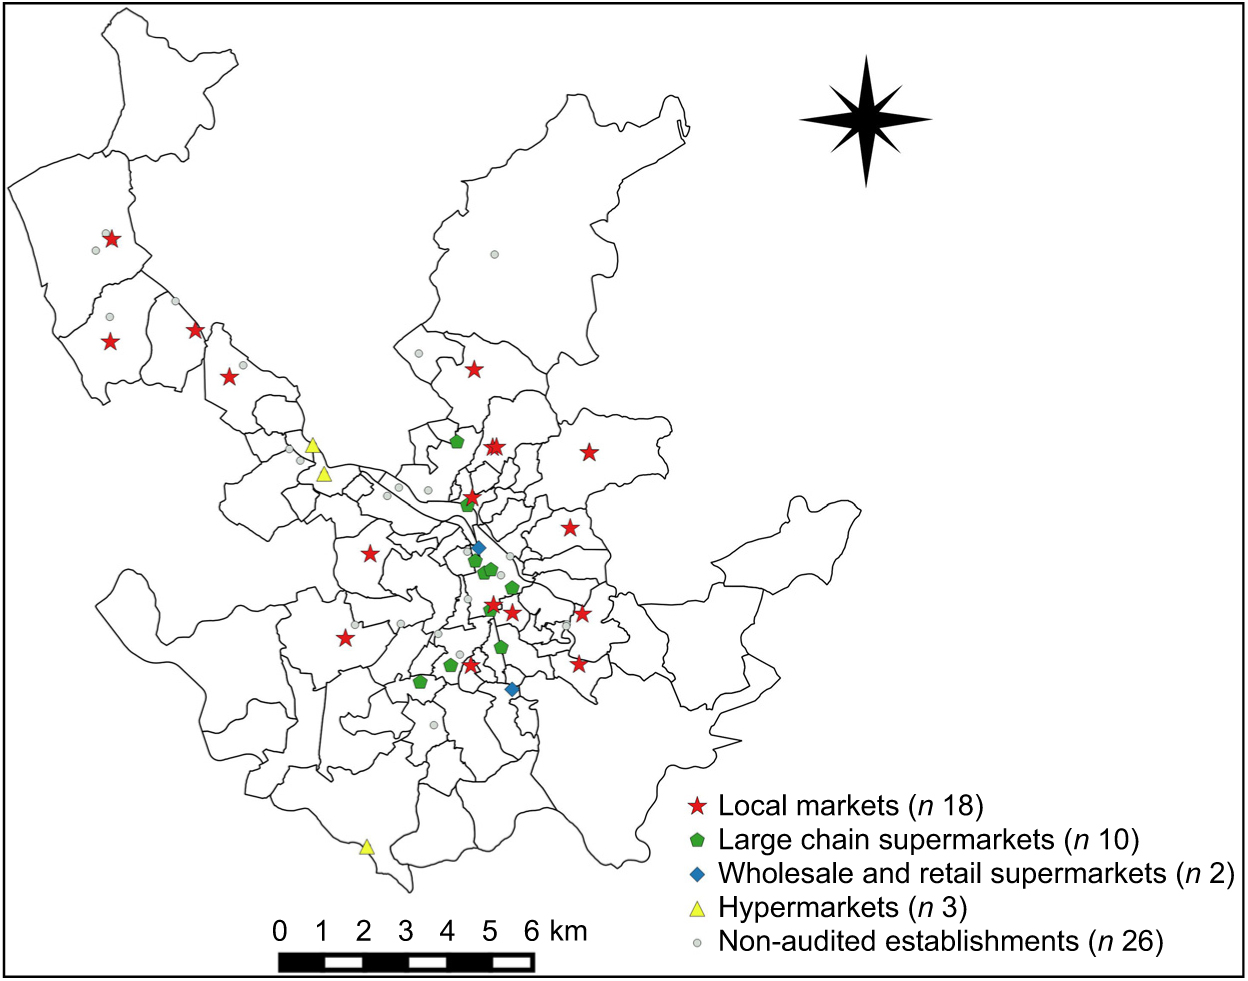
Fig. 1 The distribution of the complete set of supermarkets and similar food retail establishments (included and not included in the sample) according to neighbourhood, Juiz de Fora, Minas Gerais, Brazil, 2016
Data collection
The main data of interest were collected directly in the selected establishments by a team of properly trained research assistants (three individuals). For the evaluation of the supermarkets, the ESAO-SP Food Store Observation Tool (ESAO-S) was adopted, whose objective is to analyse commercial establishments that sell food for home consumption. Based on such an instrument, it is possible to assess the availability, variety, quality, price, advertisement and promotion of foods in commercial establishments( Reference Duran, Lock and Latorre 20 ).
Availability was measured by the presence or absence of at least one variety of each of the evaluated foods. The variety of fruits and vegetables was evaluated through scores ranging from 0 (absence), 1 (presence of one to fourteen varieties available) to 2 (presence of fifteen or more varieties available). Fruits and vegetables were considered to be of good quality when more than half of the items evaluated presented adequate external appearance and colour as well as fresh, firm and clean appearance. The foods considered in the questionnaire are among those mostly purchased and consumed by Brazilians( 27 ). The fruits and vegetables listed in the ESAO-S for evaluation are: orange, banana, papaya, apple, watermelon, tangerine or mandarin, mango, pineapple, lemon, grape, lettuce, tomato, onion, carrot, zucchini, cabbage, cucumber, eggplant and chayote. The three ultra-processed products listed are: sugar-sweetened or low-calorie beverages, chocolate-filled biscuits and corn chips. According to the instrument, the price and quality of unprocessed foods were recorded in relation to the cheapest variety of each of four fruits (orange, banana, papaya and apple) and each of four vegetables (tomato, onion, carrot and lettuce). The price of ultra-processed products was measured according to the cheapest brand of the three products analysed, at specific package sizes. Promotions and advertisements related to all the foods listed in the instrument were observed inside the establishments and was measured by counting different signs or advertisements that promote unprocessed or ultra-processed products, such as signs with nutritional information, signs/other displays that encouraged purchase/eating and price discounts( Reference Duran, Lock and Latorre 20 ).
During the primary data collection, the visited establishments were classified according to the four following categories indicated in the ESAO-S instrument: (i) small local markets, (ii) large chain supermarkets, (iii) wholesale and retail supermarkets or (iv) hypermarkets. The criteria adopted in the classification were total area of the enterprise, number of cash registers and affiliation to a retail chain( Reference Duran, Lock and Latorre 20 , Reference Parente 28 ).
Secondary data on Health Vulnerability Index (HVI) were constructed with information from the 2010 census( 24 ) according to the HVI 2012 methodology( 29 ). The data were used as a social deprivation proxy in the present study, complementing the analyses. The HVI is a synthetic indicator that associates different socio-economic variables (residents per household, illiteracy, per capita income, race/colour) and sanitation conditions (water supply, sanitary sewage and inappropriate waste disposal). This index varies from 0 to 1: the higher the value, the greater the health vulnerability( 29 ). In general, HVI is used to classify regions into four categories: low, medium, high and very high risk. In the present study, the categories of high and very high were analysed together because few neighbourhoods in the city (6·17 %) presented very high risk; thus only three categories were considered.
Data organization and analysis
Geographical coordinates (latitude and longitude) were assigned to the complete addresses of the establishments. Subsequently, geo-referencing was done using the QGIS 2.8.6 program. Three maps were composed in order to indicate: (i) the distribution of the complete set of establishments (included and not included in the sample) according to neighbourhood; (ii) the distribution of establishments (included and not included in the sample) according to the HVI classification of the neighbourhood; and (iii) the density of establishments per thousand inhabitants by neighbourhood.
To determine the availability of healthy foods, we calculated the HFSI( Reference Duran, Lock and Latorre 20 ) from the ESAO-S. HFSI score ranges from 0 to 16 and measures the availability, variety, and advertisement or promotion of unprocessed foods (fruits and vegetables) and ultra-processed products (sugar-sweetened or low-calorie beverages, chocolate-filled biscuits and corn chips) considered healthy and unhealthy markers, respectively. The index allocates points according to the following criteria, related to fruits and vegetables: availability, display at the entrance of the establishment, high variety, and presence of advertisement or promotion. And in relation to ultra-processed foods: unavailability and lack of promotion or advertisement. The HFSI does not consider price and quality( Reference Duran, Lock and Latorre 20 ).
The one-way ANOVA test was performed to compare mean HFSI score and mean values of the individual variables price, quality and food variety between the establishments according to neighbourhood vulnerability (HVI). For statistical differences found in these analyses we performed, in sequence, the Gabriel’s post hoc test (for slightly different n values between groups and homogeneous variances) or the Games–Howell test (for heterogeneous variances)( Reference Field 30 ).
To compare the proportions of food availability and quality according to HVI of the neighbourhood in which the establishment is located, we performed the χ 2/Fischer exact test. It should be noted that, to identify the possible differences found, we made a 2 × 2 proportion analysis. In this analysis, the Bonferroni correction, which alters the level of significance (P), was used in order to avoid type I errors derived from multiple comparisons( Reference Field 30 ). The corrected significance level after this procedure was P < 0·016. To identify the direction and statistical significance of the associations of food availability and quality according to HVI, we performed the χ 2 test for linear trend. For the quantitative variables of the study (price and variety), we made simple linear regression analyses, with HVI as the explanatory variable in all models.
Data related to promotions and advertisements were used only for the construction of HFSI and were not studied separately.
We used the statistical software package IBM SPSS Statistics version 19.0 for these analysis. The significance level was set at 5 %.
Ethical aspects
The present study is part of the project ‘Ambiente Construído e Ambiente Social: Associações com o Sobrepeso, Obesidade e Consumo Alimentar de Crianças e Adolescentes de Juiz de Fora, Minas Gerais’, developed by the Federal University of Juiz de Fora (UFJF), approved by the Research Ethics Committee (under protocol 522·694/2014), according to the Declaration of Helsinki.
Results
We evaluated thirty-three establishments. Of these, most were small local markets (54·5 %, n 18), followed by large supermarket chains (30·3 %, n 10), wholesale and retail supermarkets (9·1 %, n 3) and hypermarkets (6·1 %, n 2; Fig. 1).
Regarding location, 45·4 % (n 15) of the establishments were in neighbourhoods of lower vulnerability; 39·3 % (n 13) were in medium vulnerability neighbourhoods; and 15·1 % (n 5) were in neighbourhoods of higher vulnerability. The establishments were spread throughout the city, in neighbourhoods of different socio-economic levels (Fig. 2). The density of supermarkets per thousand inhabitants varied among the districts of the city and it was possible to observe that neighbourhoods with the lowest social vulnerability did not always have the highest density of supermarkets. We can see that a single neighbourhood presented the highest density of supermarkets (Fig. 3).
Fig. 2 The distribution of supermarkets and similar food retail establishments (included and not included in the sample) according to the Health Vulnerability Index (HVI) classification of the neighbourhood, Juiz de Fora, Minas Gerais, Brazil, 2016
Fig. 3 The density of supermarkets and similar food retail establishments per thousand inhabitants by neighbourhood, Juiz de Fora, Minas Gerais, Brazil, 2016
The mean HFSI score of the supermarkets in Juiz de Fora was 8·91 (sd 1·51). When stratified according to vulnerability, it was observed that neighbourhoods of lower vulnerability had a higher HFSI score, compared with the neighbourhoods of medium and higher vulnerability (P = 0·001). We identified a linear and inverse relationship between HFSI and HVI (P = 0·001; Table 1).
Table 1 The mean Healthy Food Store Index (HFSI) scores of supermarkets in neighbourhoods with different Health Vulnerability Index (HVI) values, Juiz de Fora, Minas Gerais, Brazil, 2016
a,bMean values within a row with unlike superscript letters were significantly different according to Gabriel’s post hoc test (P < 0·05).
* One-way ANOVA test.
† Simple linear regression (explanatory variable: HVI).
When availability, variety, quality and price were evaluated separately (and not for the purpose of HFSI construction), it was possible to verify some differences according to HVI. Fruits, vegetables and ultra-processed foods were available in almost all evaluated establishments, without differences according to HVI classification (P > 0·05). However, differences in the variety of foods were identified.
Neighbourhoods of lower vulnerability had more varieties of apple, lettuce, sugar-free cola drink and juice or nectar (carton) compared with medium HVI neighbourhoods; also, a greater variety of cola brands and filled biscuits compared with establishments located in neighbourhoods of higher vulnerability (P < 0·05). A significant linear and inverse trend for all associations of the above-mentioned variety of foods with HVI was observed (P < 0·05). The quality of apple and carrot was superior in supermarkets located in neighbourhoods of lower vulnerability compared with medium and higher ones, indicating a linear trend in apple quality according to neighbourhood vulnerability (P < 0·05). Similarly, the price of banana, tomato and total of fruits and vegetables presented a linear and inverse relationship with HVI: the lower the HVI of the neighbourhood, the higher the cost of these foods (P < 0·05). In relation to ultra-processed products, only a difference in the price of drink mix was observed, with no linear trend (P > 0·05). The price was higher in neighbourhoods with lower HVI compared with medium HVI (P < 0·05; Tables 2 and 3).
Table 2 The availability, variety, quality and average prices of fruits and vegetables sold in supermarkets and similar food retail establishments of neighbourhoods with different Health Vulnerability Index (HVI) values, Juiz de Fora, Minas Gerais, Brazil, 2016
a,bMean values within a row with unlike superscript letters were significantly different according to Gabriel’s post hoc test (P < 0·05).
x,yProportions within a row with unlike superscript letters were significantly different according to Bonferroni correction (P < 0·016).
* Pearson’s χ 2 test.
† χ 2 linear trend test.
‡ One-way ANOVA test.
§ Simple linear regression (explanatory variable: HVI).
Table 3 The availability, variety, quality and average prices of ultra-processed foods and beverages sold in supermarkets and similar food retail establishments of neighbourhoods with different Health Vulnerability Index (HVI) values, Juiz de Fora, Minas Gerais, Brazil, 2016

a,bMean values within a row with unlike superscript letters were significantly different according to Gabriel’s post hoc test (P < 0·05).
* Pearson’s χ 2 test.
† χ 2 linear trend test.
‡ One-way ANOVA test.
§ Simple linear regression (explanatory variable: HVI).
Discussion
The combined investigation of both secondary (from the official state registers) and primary data (collected directly from the establishments) of food retail in a large-sized city from the countryside in Brazil made it possible to evaluate food environment characteristics and their associations with socio-economic aspects of neighbourhoods. We found significant discrepancies regarding geographic scattering, availability, variety, quality and price of food according to the level of social vulnerability of the establishment’s neighbourhood. Areas of lower vulnerability had a higher concentration of most establishments and provided healthy foods of greater variety and quality, despite higher prices. Although this relationship was easily observed for unprocessed foods (fruits and vegetables), it tended to weaken for ultra-processed products, which presented more constant prices.
Food availability is a critical component of food and nutritional insecurity that is often considered the result of a number of factors, such as spatial proximity to food establishments, financial accessibility and cultural characteristics( Reference Mishra and Kumar 19 , Reference Grimm, Moore and Scanlon 31 ). Limited food availability affects disproportionately the low-income population, exposing these individuals to a higher risk of developing diet-related diseases, such as obesity, cancers, CVD and type 2 diabetes, in comparison with residents of higher-income communities( Reference Larson, Story and Nelson 32 ).
Areas of lower vulnerability presented greater density of supermarkets and a greater variety of products in the stores, in relation to areas of medium and higher vulnerability. Most studies on the food environment in Brazil are made in state capital cities and there is a lack of data concerning cities from the countryside, thus our results contribute to the literature gaps on possible barriers faced by lower-income populations regarding the access to healthy foods( Reference Beaulac, Kristjansson and Cummins 33 – Reference Walker, Keane and Burke 35 ).
Neighbourhoods of greater vulnerability had lower fruit and vegetable prices; however, the food items had worse quality, affecting the perceived value of these products and discouraging their purchase. Product quality is an important attribute that influences consumers’ decision making( Reference Grunert 36 ). Also, it should be noted that this situation poses a clear barrier to the consumption of fruits and vegetables, and not for ultra-processed products, where the maintenance of quality is more commercially viable, given the use of standardized formulations with long-term shelf stability and often dispense special transportation, storage and marketing( Reference Monteiro, Levy and Claro 7 ).
Although not all low-vulnerability neighbourhoods in the city had supermarkets (as shown in Fig. 2), it is undeniable that there was a lower density of these establishments in higher-vulnerability neighbourhoods, especially the extreme north and south of the municipality. Neighbourhoods with greater social vulnerability are not attractive to sophisticated commercial establishments with ample food offer, due the higher rates of violence, precarious urban infrastructure and lower consumer buying power, which tend to inhibit businessmen( Reference Duran, Diez Roux and Latorre Mdo 23 ). Knowing this, it is highly possible that establishments in the poorest areas of Juiz de Fora might be smaller, not from a supermarket chain and less sophisticated. Also, as locals cannot afford expensive products, the vendors would sell low-cost products, and that can explain in part why products in establishments located in more vulnerable neighbourhoods of the city are cheaper than in richer areas( Reference Drewnowski 12 ).
Areas with higher density of establishments are possible attractive poles where consumers without options near their residence can shop for food and what else they need. Where there is a high number of establishments, there is greater competition among the stores, which tends to increase the quality and lower the price of marketed products( Reference Grunert 36 ). For individuals with lower income, however, such a fact may cause an additional limitation, since they probably do not always have money to access transportation to establishments distant from their houses and cannot find fresh, varied, quality and affordable food in establishments near to them. It may result in monotonous food purchase and consumption patterns( Reference Beaulac, Kristjansson and Cummins 33 ).
The only neighbourhood that presented the highest density of supermarkets (Fig. 3) is a sparsely populated area with high HVI( 24 ), high availability of commercial establishments and a large circulation of people and vehicles, since there is an important highway that connects big nearby cities. So, despite its sparse population, because of its location and the fact that is well stocked, that neighbourhood (named Salvaterra) is frequented by residents from close regions who have cars or access to public or private transportation.
The present study is the third one on food environment evaluations conducted in Brazil with a similar methodology (using ESAO-S and calculating the HFSI for a sample of establishments) in the last decade, and the first conducted outside a Brazilian capital( Reference Duran, Diez Roux and Latorre Mdo 23 , Reference Costa, Oliveira and Lopes 37 ). The pioneer study was carried out in the city of São Paulo, involving a sample of supermarkets, greengroceries, local markets, delicatessens and convenience stores located in fifty-two census tracts (selected according to socio-economic level and density of food establishments)( Reference Duran, Diez Roux and Latorre Mdo 23 ). Although the capital’s sample had different characteristics compared with the present study, the mean HFSI score identified herein (8·91 (sd 1·51)) was very similar to the HFSI calculated for supermarkets in São Paulo (10·33 (sd 2·87)) and very distant from the score found for small local markets (3·07 (sd 2·50))( Reference Duran, Diez Roux and Latorre Mdo 23 ). Also, in the São Paulo study, where the supermarkets’ locations were stratified according to their socio-economic characteristics, higher HFSI scores were identified for richer areas and, like the findings of the present study, positive aspects in relation to the availability of healthy foods were found to increase in the direction of socio-economic improvement( Reference Duran, Diez Roux and Latorre Mdo 23 ). This finding suggests a similarity between the food environment in capitals and countryside towns, a fact identified for the first time in Brazil.
Some limitations, however, may be pointed out in relation to the present study, such as the use of secondary data sources for the assessment of socio-economic vulnerability and location of establishments, which may lead to inaccuracies. When choosing to use a standardized instrument, it is necessary to limit the data collection to the information determined therein. However, the use of the validated instrument allows reliability in data analysis and comparability with other studies. To avoid misclassification of the food stores, the field researchers were thoroughly trained.
Regarding the price analysis, we always selected the cheapest variety/brand and therefore we might be comparing prices of non-identical products, which is a limitation. On the other hand, this was the preconized methodology of the utilized validated instrument. Considering the same product type – which can be a banana or a can of cola soft drink – but sometimes in different varieties or brands, with the premise of analysing food access and considering quality, on unprocessed foods, and packing size, on ultra-processed products, we understand that the products are comparable. The choice for a specific brand or variety runs through more abstract criteria of preference and convenience that can be related to a product’s marketing strategies for example, which are aspects not deeply covered in our study.
Another limitation concerns the evaluation of establishments during a single month of the year and this may influence the variety and quality of some foods, especially fruits and vegetables. However, all the establishments were visited in a short period of time, so the findings are comparable within the sampled supermarkets.
In future analysis, it is important to consider other underlying aspects, such as the evaluation of the HFSI for other types of establishments (such as mini-markets, convenience stores, fairs and greengroceries), allowing comparisons on the availability of healthy foods among different food stores.
Conclusion
The present study showed that supermarkets and similar establishments are more concentrated in areas of lower social deprivation. In greater social deprivation neighbourhoods, those establishments have lower prices of healthy foods, which can be an important factor in favour of food and nutritional security in the region. However, the HFSI and, separately, the variety and quality of those foods are worse, compared with areas of low vulnerability. This aspect calls attention to the fact that different regions present different demands related to access to healthy foods.
The findings of the study are potential guiding principles, with a high level of specificity, for designing public policies focusing on food and nutritional security for the population.
Acknowledgements
Acknowledgements: The authors thank the undergraduate nutrition student, Pamella Donadoni Coelho, for assisting in data collection. Financial support: This work was supported by the Brazilian National Council for Scientific and Technological Development (CNPq; grant number 484946/2013-7). The Brazilian Coordination for the Improvement of Higher Education Personnel (CAPES) also supported with scholarships to M.A.L., M.M.A. and A.S.C. (finance code 001). CNPq and CAPES had no role in the design, analysis or writing of this article. Conflict of interest: None. Authorship: M.A.L., M.M.A. and A.S.C. contributed in the design, data analysis and writing of the final version of the article; B.V.L.C. and R.M.C. contributed in the data statistical analysis and in the writing of the final version of the article; I.R.C., L.O.C. and M.P.N. contributed in the writing and critical revision of the final version of the article; L.L.M. contributed in the study design, writing and critical review of the final version of the article. All authors have approved the final version of the manuscript and declare that they are responsible for all aspects of the manuscript, ensuring its accuracy and integrity. Ethics of human subject participation: This study is part of the project ‘Ambiente Construído e Ambiente Social: Associações com o Sobrepeso, Obesidade e Consumo Alimentar de Crianças e Adolescentes de Juiz de Fora, Minas Gerais’, developed by the Federal University of Juiz de Fora (UFJF), approved by the Research Ethics Committee (under protocol 522.694/2014), according to the Declaration of Helsinki.


