


Population ageing has become a global phenomenon, especially in developed countries. In 1990, it was documented that 6% of the world population was aged 65 years or older. By 2019, this statistic had increased to 9%, and it is estimated to further increase to 16% by 2050 worldwide.1 This poses many concerns, as older adults tend to be more isolated, perform fewer occupational activities (professional, leisure, etc.), and have limited social support and access to health-related information. Higher exposure to numerous health risks through ageing results in a high socioeconomic burden due to increased medical costs.
The various health risks and their consequences for social welfare in the older adult population can be investigated using a concept termed health-related quality of life (HRQoL). HRQoL was developed to specifically examine health-related aspects of quality of life, such as disease status, occurrence of pain or discomfort, and physical functioning.Reference Ferrans, Zerwic, Wilbur and Larson2 Previous studies investigating factors that affect HRQoL in older adults have found physical functions including mobility, grip strength and balance to be significantly associated with HRQoL.Reference Fagerström and Borglin3 In addition, lower levels of social support predict lower levels of HRQoL, especially for older adults living alone.Reference Kim and Lee4 These findings suggest that HRQoL is affected by a wide range of variables.
Recently, a psychometric approach called network analysis has been proposed as a method to investigate variable interactions. In comparison with other methods of analysis, this approach offers a broader perspective on variable interactions by producing a visual and easily comprehensible network structure and novel indices to measure patterns of interaction.Reference Borsboom, Deserno, Rhemtulla, Epskamp, Fried and McNally5 In public health, network analysis can be useful in investigating social and environmental influences on health, or health-related factors such as HRQoL. Constructing such networks enables the development of more efficient intervention plans by offering insights regarding target factors for enhancing HRQoL.Reference Luke and Harris6 To date, no study has investigated HRQoL and related factors in older adults from a network perspective.
Therefore, the major aim of this study was to use network analysis to provide insight into HRQoL and related factors using nationwide health data. First, we constructed a network consisting only of different dimensions of HRQoL to examine which particular dimensions have important roles. Second, we investigated bridging variables that link HRQoL dimensions with various lifestyle and psychosocial factors. Finally, we analysed the relationships connecting the overall HRQoL index with other lifestyle factors to identify variables of primary importance for enhancing HRQoL.
Methods
Study design and participants
Data were obtained from the publicly available Korean National Health and Nutrition Examination Survey (KNHANES) for 2018, 2019 and 2020. The KNHANES is conducted by the Korea Disease Control and Prevention Agency in the form of a rolling sample survey.Reference Kish7 Rolling sampling is a useful sampling method for large population surveys, in which non-overlapping F number of rolling samples are periodically collected. The probability distribution of each sample is 1/F, such that after F of cycles, the cumulative samples become a sample of the entire population.
The 2018 data were taken from the seventh KNHANES, third year (KNHANES VII-3; Korea Disease Control and Prevention Agency),8 2019 data from the eighth KNHANES, first year (KNHANES VIII–1)9 and 2020 data from the eighth KNHANES, second year (KNHANES VIII–2).10 Selecting cases with ages 65 years or above resulted in 1653, 1735 and 1712 cases (5100 in total) for KNHANES VII-3, VIII-1 and VIII-2, respectively. Listwise deletion excluded 657 cases owing to missing responses. As a result, the final data-set eligible for analysis contained 4317 cases, comprising 1878 males (43.5%) and 2439 females (56.5%). Participants’ mean age was 72.74 (s.d. = 5.07). Figure 1 shows a flow chart depicting the case exclusion process for this study.
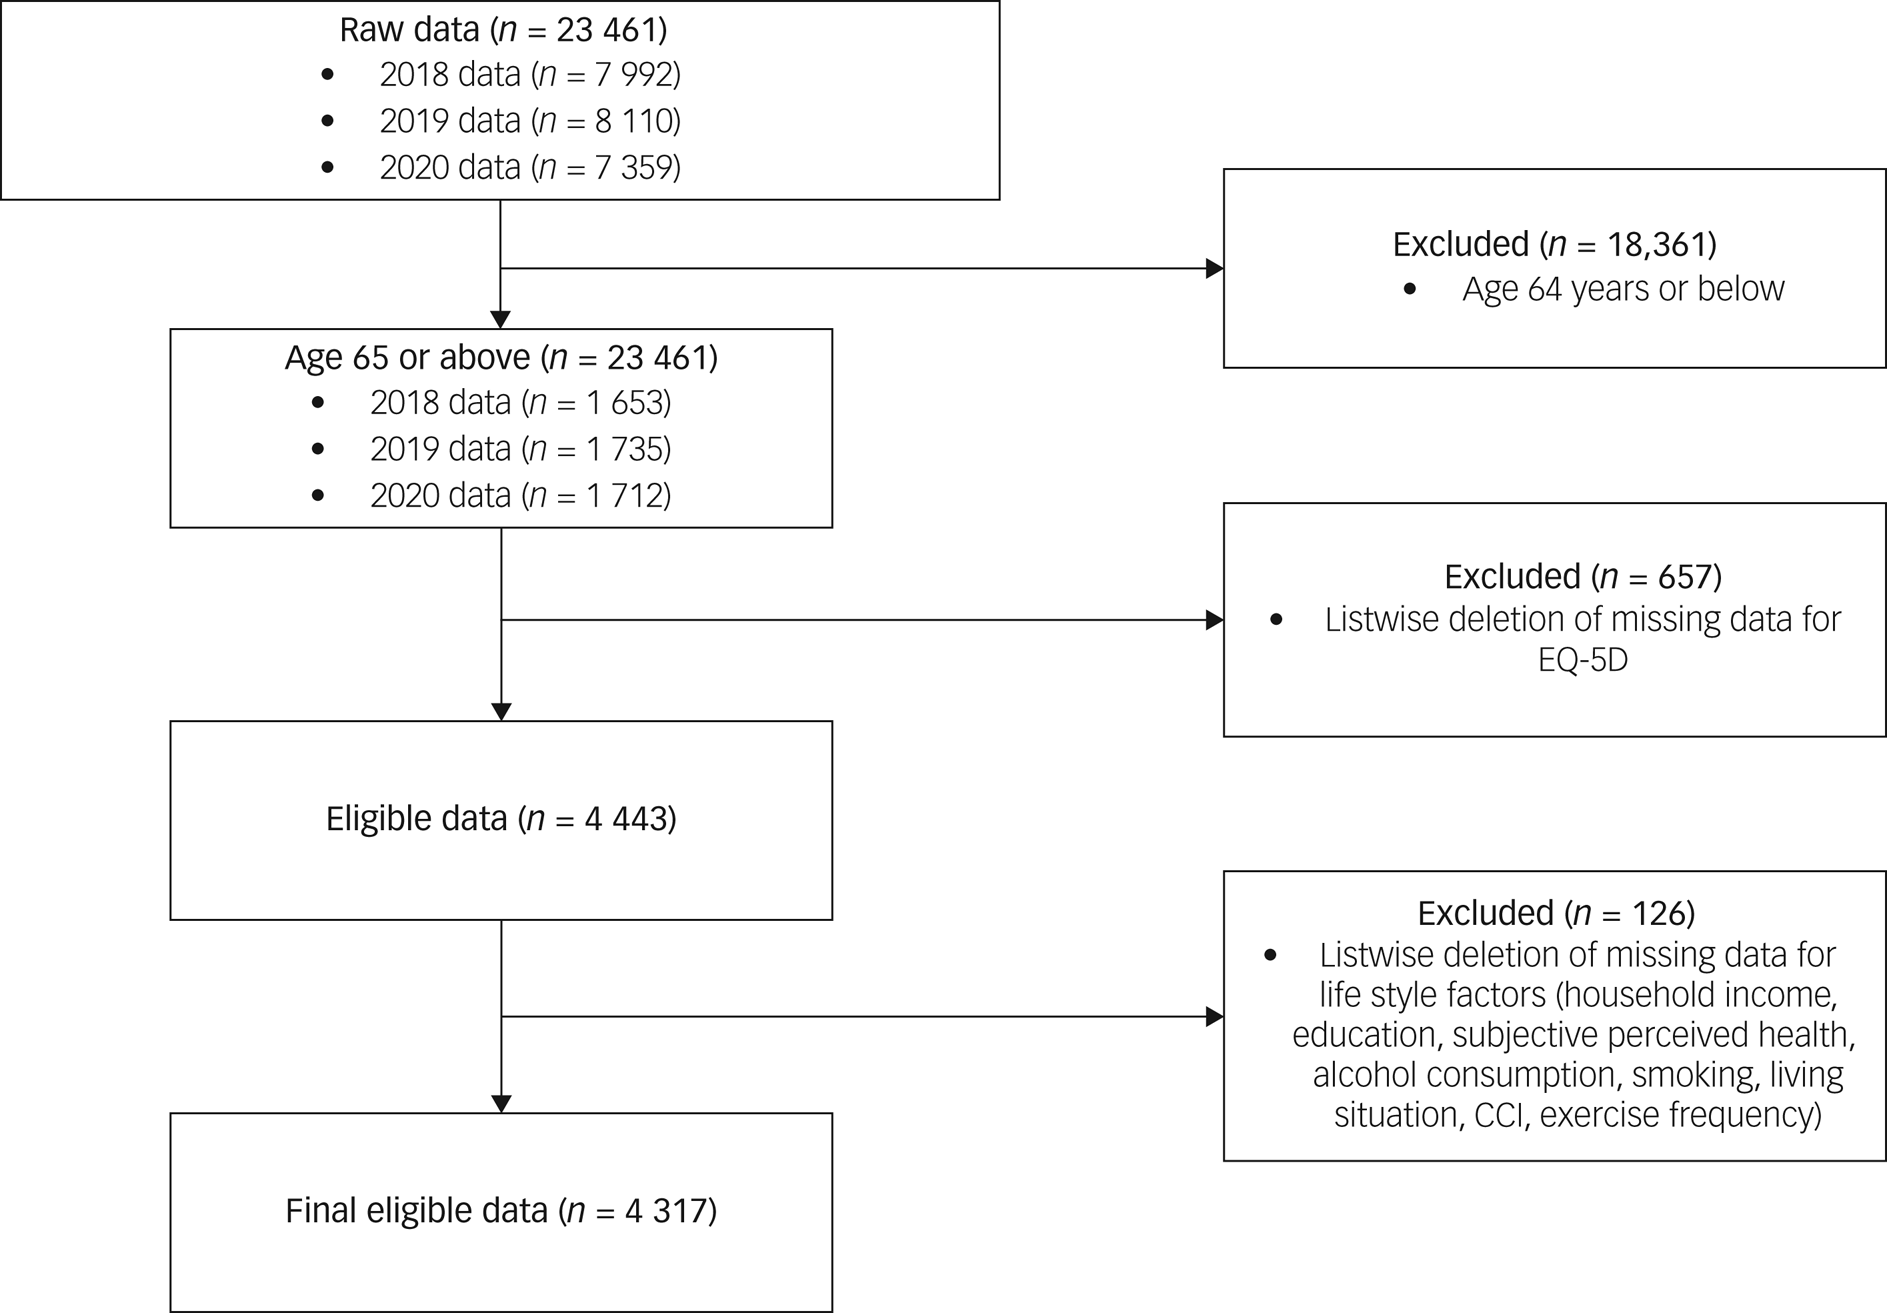
Fig. 1 Flow chart illustrating case exclusion process for the 2018, 2019 and 2020 Korean National Health and Nutrition Examination Survey. CCI, Charlson Comorbidity Index.
The authors assert that all procedures contributing to this work comply with the ethical standards of the relevant national and institutional committees on human experimentation and with the Helsinki Declaration of 1975, as revised in 2008. Consent was received by the Korea Disease Control and Prevention Agency from all participants prior to conducting the KNHANES. All procedures involving human subjects were approved by the Institutional Review Board of Konkuk University Medical Center (KUMC 2022-07-063).
Measures
EQ-5D
The EQ-5D is a self-report scale developed by the EuroQol Group.11 The EQ-5D rates HRQoL based on five dimensions: mobility, self-care, usual activities, pain/discomfort and anxiety/depression. Each dimension is rated on a three-point Likert scale ranging from no problem,1 some or moderate problem,Reference Ferrans, Zerwic, Wilbur and Larson2 and extreme problem.Reference Fagerström and Borglin3,Reference Rabin and de Charro12 The EQ-5D scale has been translated into Korean and validated for use in that language.13 Here, EQ-5D scores were converted into a single index score computed using weighted scores for each dimension, with the weight assignment developed by Lee et al.Reference Lee, Nam, Chuang, Kim, Yang and Kwon14 The EQ-5D has shown acceptable reliability and construct validity in older adult populations.Reference van Leeuwen, Bosmans, Jansen, Hoogendijk, van Tulder and van der Horst15,Reference You, Liu, Yang, Pan, Ma and Luo16 Permission for the use of the EQ-5D scale was obtained for the KNHANES and can be found in the publicly available data instruction file (https://knhanes.kdca.go.kr/knhanes/sub03/sub03_02_05.do).
Lifestyle and psychosocial factors
Household income was assigned a score ranging from 1 (first quartile, low income) to 4 (fourth quartile, high income). Household income was selected instead of individual income, as older adults above 65 are likely to have retired and receive income from sources other than individual work. Education was assigned a score such that higher scores indicated higher educational background, ranging from 1 (primary school or lower) to 4 (university or higher). Living situation was re-coded into a binary variable where 1 indicated living with someone, and 0 indicated living alone. Subjective health asked how participants felt about their health on average, with scores ranging from 1 (very good) to 5 (very bad). The stress item asked how much the subject experienced stress on average. Stress was re-coded such that higher scores indicated a worse condition. As a result, stress scores ranged from 1 (almost none) to 4 (very much). Alcohol consumption frequency scores ranged from 1 (almost none) to 6 (more than four times a week). Smoking was re-coded into a binary variable where 1 indicated a smoker and 0 a non-smoker. Exercise frequency was re-coded into three levels such that 0 indicated no exercise per week, 1 indicated fewer than 3 days per week, and 2 indicated more than 4 days per week. Medical comorbidity was evaluated using the modified version of the Charlson Comorbidity Index (CCI) for this study.Reference Charlson, Pompei, Ales and MacKenzie17 A score of 1 was assigned if the subject responded positively to questions asking whether they were currently suffering from myocardial infarction, angina, stroke, lung disease (tuberculosis, asthma, lung cancer), connective tissue disease (rheumatoid arthritis, osteoarthritis), liver disease (hepatitis B, hepatitis C), diabetes or and kidney disease; a score of 2 was assigned for those with cancer, and 3 for those with liver cirrhosis. CCI index was coded into four levels, ranging from 0 (no comorbidities) to 3 (three or more comorbidities).
Statistical analysis
Descriptive analysis
Prior to the main analyses, we conducted a descriptive analysis using SPSS. For each variable, we calculated frequencies and percentages by gender, age, household income, education, living situation, subjective health, EQ-5D, CCI, stress, alcohol consumption, smoking and exercise. For the EQ-5D index, we computed the mean and standard deviation. The results are presented in Table 1.
Table 1 Descriptive statistics of demographic, lifestyle and psychosocial factors among the participants
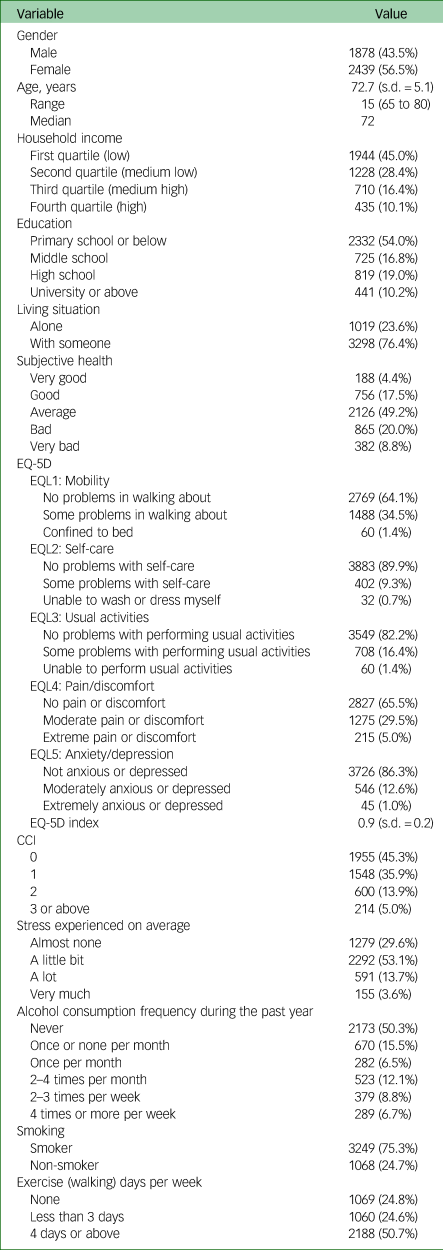
CCI, Charlson Comorbidity Index.
In addition, we calculated frequencies by gender, age, household income, education, living situation, subjective health and CCI for each level of all EQ-5D dimensions and compared them using chi-squared tests. The results are presented in Table 2.
Table 2 Frequencies and chi-squared test results for EQ-5D dimensions according to gender, age, household income, education, living situation, subjective health and CCI
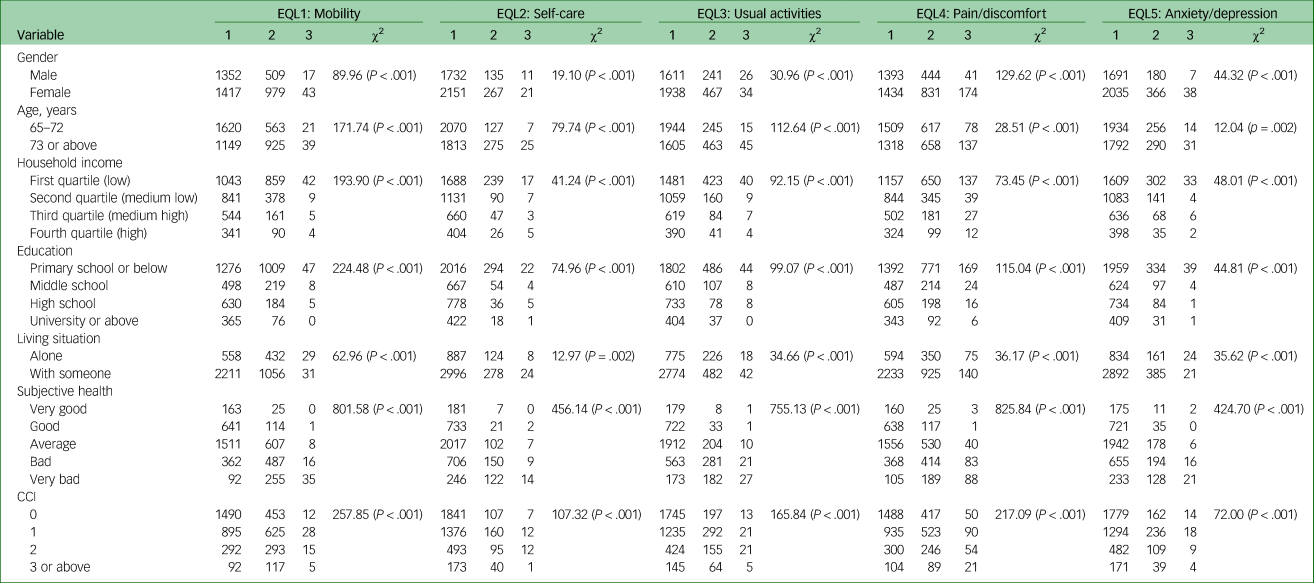
CCI, Charlson Comorbidity Index.
Network I: EQ-5D network
To investigate how each dimension of EQ-5D contributed to the overall network, we first conducted network analysis on the five dimensions of EQ-5D to investigate its structure; this was termed ‘Network I’. In a network, variables are each represented as nodes (circles) and the relationships between the nodes as edges (lines). As our data were ordinal, we created a polychoric correlation matrix to compute the network. Edges were computed using partial correlation coefficients between nodes. Centralities are indices characteristic to networks, each representing a pattern of node interaction. Strength, closeness and betweenness centrality indices for each node were computed. Strength is a measure of how strongly a node is related to each adjacent node, determined by considering the absolute values of edge weights. Closeness refers to the inverse sum length of the shortest path of a node to all other nodes in the network. Finally, betweenness is the number of times a node of interest is passed through on the shortest route between every possible pair of nodes in the network.Reference Opsahl, Agneessens and Skvoretz18,Reference Bringmann, Elmer, Epskamp, Krause, Schoch and Wichers19 All analyses involving network analyses were conducted in R studio (version 4.2.0.), a development environment for the programming language R. Network analyses were conducted by regularised estimation using graphical least absolute shrinkage and selection operator with the extended Bayesian information criteria.Reference Epskamp and Fried20,Reference Friedman, Hastie and Tibshirani21 All network and centrality analyses were conducted using the qgraph package.Reference Epskamp, Cramer, Waldorp, Schmittmann and Borsboom22 Detailed methods and explanations of network analysis are provided in Supplementary Text 1 available at https://doi.org/10.1192/bjo.2023.536.
Network II: bridge analysis between EQ-5D and lifestyle and psychosocial factors
Our second aim was to identify the bridging nodes connecting EQ-5D dimensions and lifestyle factors. Nodes were grouped into two communities: EQ-5D dimensions, comprising five nodes; and lifestyle and psychosocial factors, comprising nine nodes. The resulting network was termed ‘Network II’. To identify bridging nodes, we computed bridge centrality indices. Bridge centralities are defined similarly to extant centrality indices but in the context of node communities. For example, in case of a network with two communities of nodes, a node having high bridge strength indicates that it has the largest sum absolute value of edges connecting to nodes in the other community.Reference Jones, Ma and McNally23 However, for our network, we computed bridge expected influence instead of bridge strength, as this also takes negative edges into account.Reference Robinaugh, Millner and McNally24 Bridge centrality analyses were conducted using R, with package networktools.Reference Jones and Jones25 Details regarding how bridge centrality was computed are available in Supplementary Text 1.
Network III: edge analysis between EQ-5D index and lifestyle and psychosocial factors
The third network, ‘Network III’, was constructed to examine which lifestyle and psychosocial factors were strongly related to the overall HRQoL level. As such, the five nodes representing EQ-5D dimensions were replaced with a single node representing the EQ-5D index. To investigate edges connected to the EQ-5D index, we used the bootnet function to conduct significance testing on edges connecting the EQ-5D node to other nodes.Reference Epskamp, Borsboom and Fried26
Accuracy and stability analysis for all estimations
We performed bootstrapping to evaluate the accuracy and stability of all parameter estimations. Edge weights of the network were evaluated by estimating the 95% confidence interval for each edge using a non-parametric bootstrap method with 1000 bootstraps. Next, the reliability of centralities was evaluated by computing correlation stability coefficients (CS-coefficients) for each centrality. Detailed explanations of CS-coefficients are provided in Supplementary Text 1. The recommended cut-off for CS-coefficients is 0.5, and it is advised not to interpret centralities scoring CS-coefficients below 0.25.Reference Epskamp, Borsboom and Fried26
To evaluate the edge weights, a bootstrapped difference test was performed. This test involves a null-hypothesis significance test to compare whether one edge weight significantly differs from another, based on their bootstrapped CI.Reference Epskamp, Borsboom and Fried26
Results
Descriptive statistics
Around half of the participants reported low household income (45.0%) and indicated their highest level of education to be primary school or below (54.0%). The majority of the participants were living with someone (76.4%). Most participants indicated their health condition to be average (49.2%). On the CCI index, 45.3% scored 0, indicating no comorbidities, whereas 35.9% scored 1, 13.9% scored 2, and 5% scored 3 or above. In addition, 50.3% of participants indicated that they did not consume any alcohol during the past year, 75.3% were currently smokers and 50.7% reported that they exercised 4 days or more per week. A significant proportion of participants reported experiencing almost no stress (29.6%) or some level of stress (53.1%) on average.
The majority of participants indicated that they had no problems in performing self-care (89.9%) and usual activities (82.2%) and did not feel anxious or depressed (86.3%). A substantial proportion of participants indicated that they were experiencing some problems with walking about (34.5%) and moderate pain or discomfort (29.5%). The overall mean for the EQ-5D index was 0.89 (s.d. = 0.15). A summary of descriptive statistics for EQ-5D and lifestyle factors is presented in Table 1.
Network I
Network I is visualised in Fig. 2a. The strongest edge was that connecting EQL2 (self-care) and EQL3 (usual activities), with partial correlation coefficient value 0.55. The bootstrapped CI results for each edge are presented in Supplementary Fig. 1. Details of network visualisation are given in Supplementary Text 1.
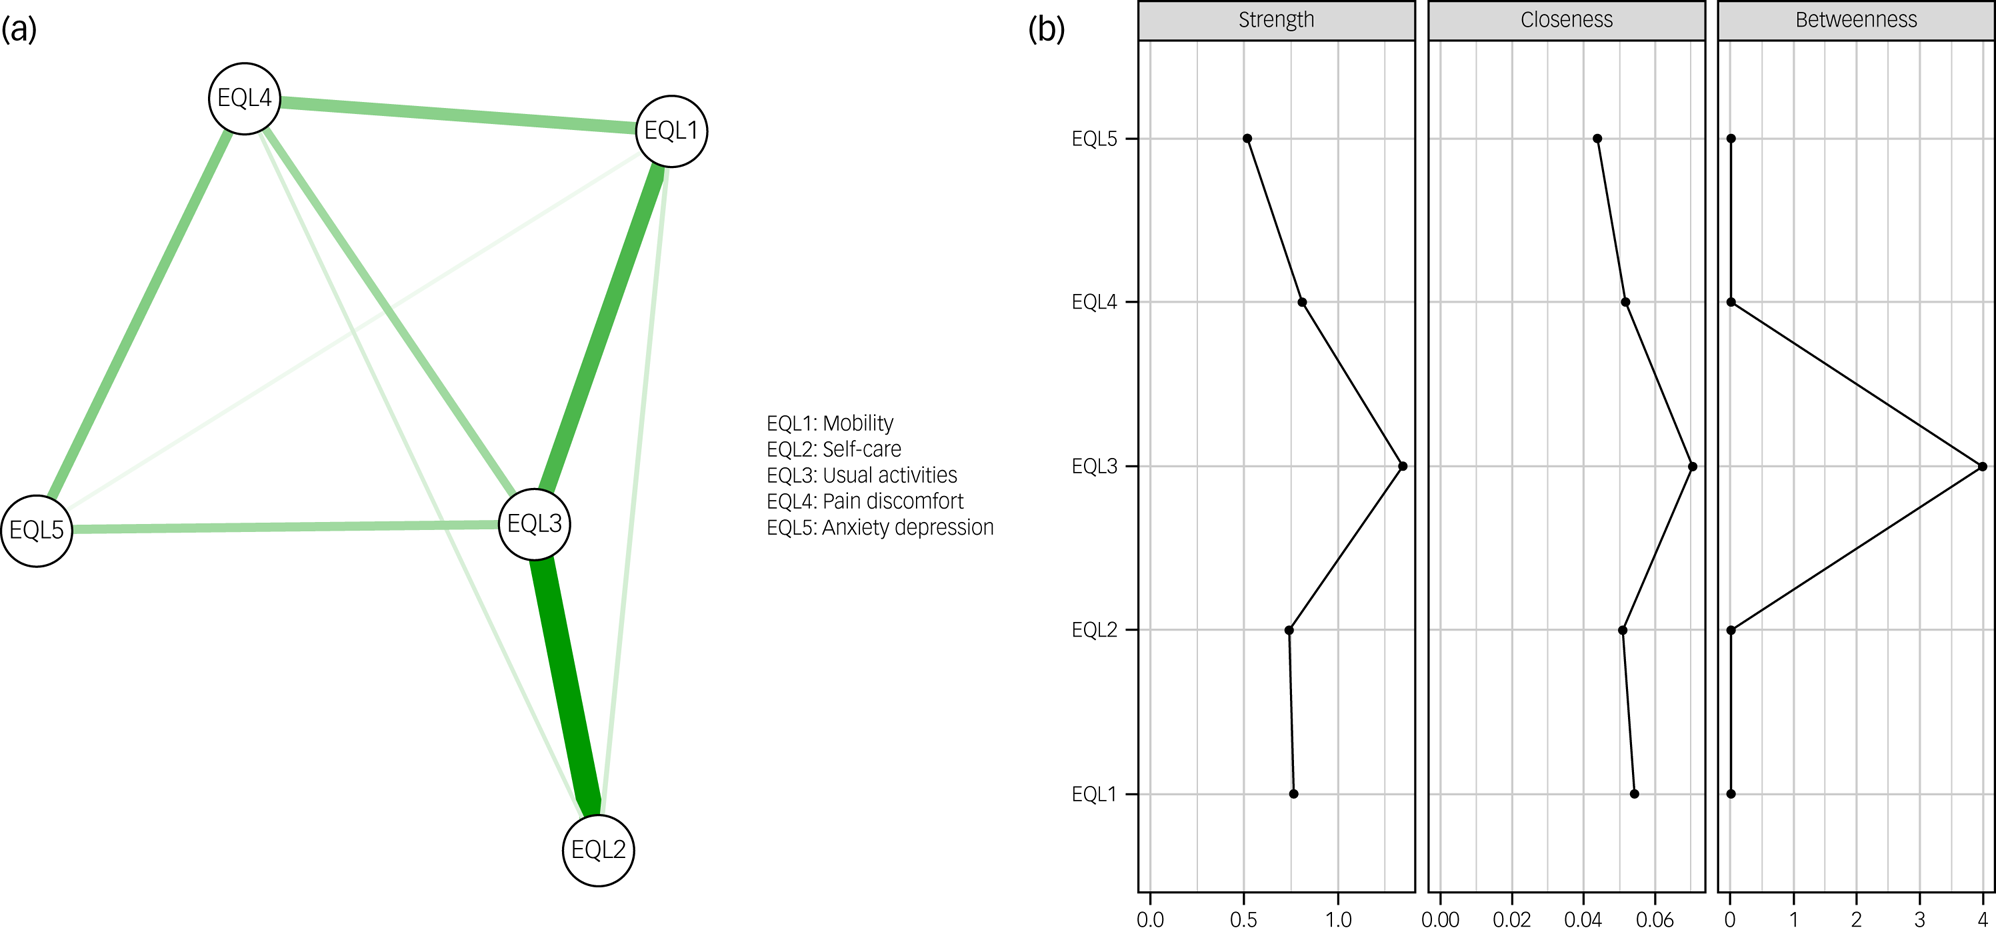
Fig. 2 (a) Network I containing EQ-5D dimensions. Thicker lines indicate stronger edge weights. All edges represent positive partial correlation coefficients. (b) Graph showing raw centrality scores for strength, closeness and betweenness for EQ-5D dimensions.
According to the centrality analysis, overall, the largest centralities were observed for EQL3 (usual activities). Figure 2b illustrates the raw centrality scores for strength, closeness and betweenness. As all CS-coefficients were above 0.5, all indices were treated as accurate and were thus interpreted. The case-dropping bootstrap results for the centrality indices can be found in Supplementary Fig. 2.
Network II
Network II contained all five dimensions of EQ-5D as well as lifestyle and psychosocial factors and was used to examine bridging nodes. Network II is illustrated in Fig. 3. Of the 91 possible total edges that could be estimated, 63 edges remained in the network. The strongest edge weight connected EQL2 and EQL3, with a partial correlation coefficient value of 0.52. Some negative edges were observed (e.g., EQL1–exercise). Bootstrapped CIs for all edges are presented in Supplementary Fig. 3.
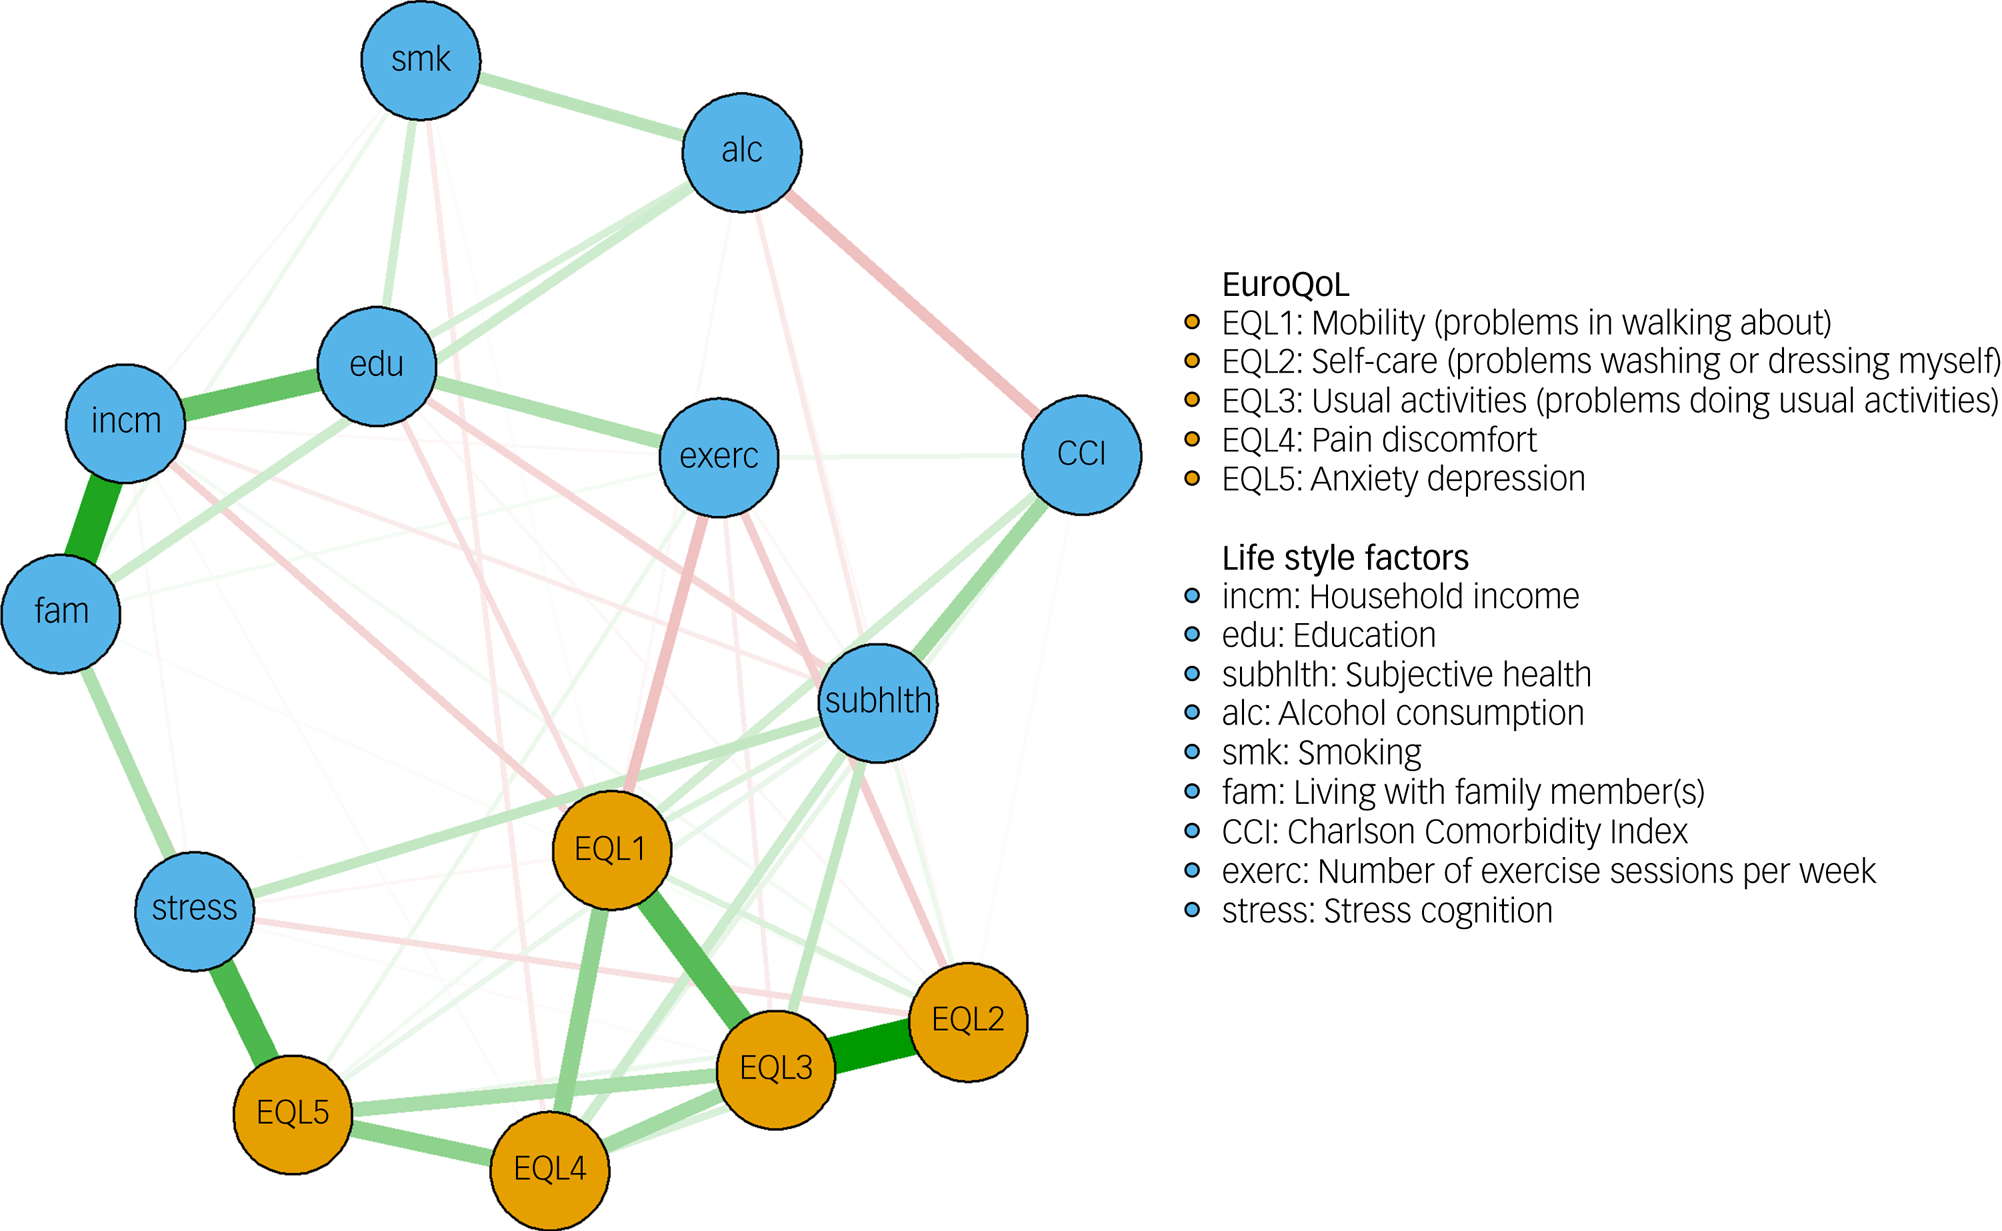
Fig. 3 Network II showing EQ-5D dimensions and lifestyle factors. Thicker lines indicate stronger edge weights. Red indicates negative edge weights, and green indicates positive edge weights. EQ-5D dimension nodes are shown in orange, and lifestyle factor nodes in blue.
In the bridge centrality analysis, stress had the highest bridge closeness value, followed by subjective health. Stress also had the highest value of bridge betweenness, followed by EQL5 (anxiety/depression), and family (living situation). Subjective health had the highest bridge two-step expected influence, followed by EQL5 and stress. A graph illustrating raw scores of bridge centralities is shown in Supplementary Fig. 4. CS-coefficients for bridge centralities were all above 0.5. Thus, all bridge centralities were interpreted. Results of the case-dropping bootstrap can be found in Supplementary Fig. 5.
Edge analysis
Finally, for Network III, edges connected to the EQ-5D index were investigated. The resulting network is shown in Supplementary Fig. 6. As our main interest was the EQ-5D node, we used the flow function included in the qgraph packageReference Epskamp, Cramer, Waldorp, Schmittmann and Borsboom22 to create a diagram showing edges stemming from the EQ-5D index (Fig. 4). Bootstrapped edge-weight CIs are shown in Supplementary Fig. 7. The strongest edge connected with the EQ-5D index was for subjective health, followed by exercise.
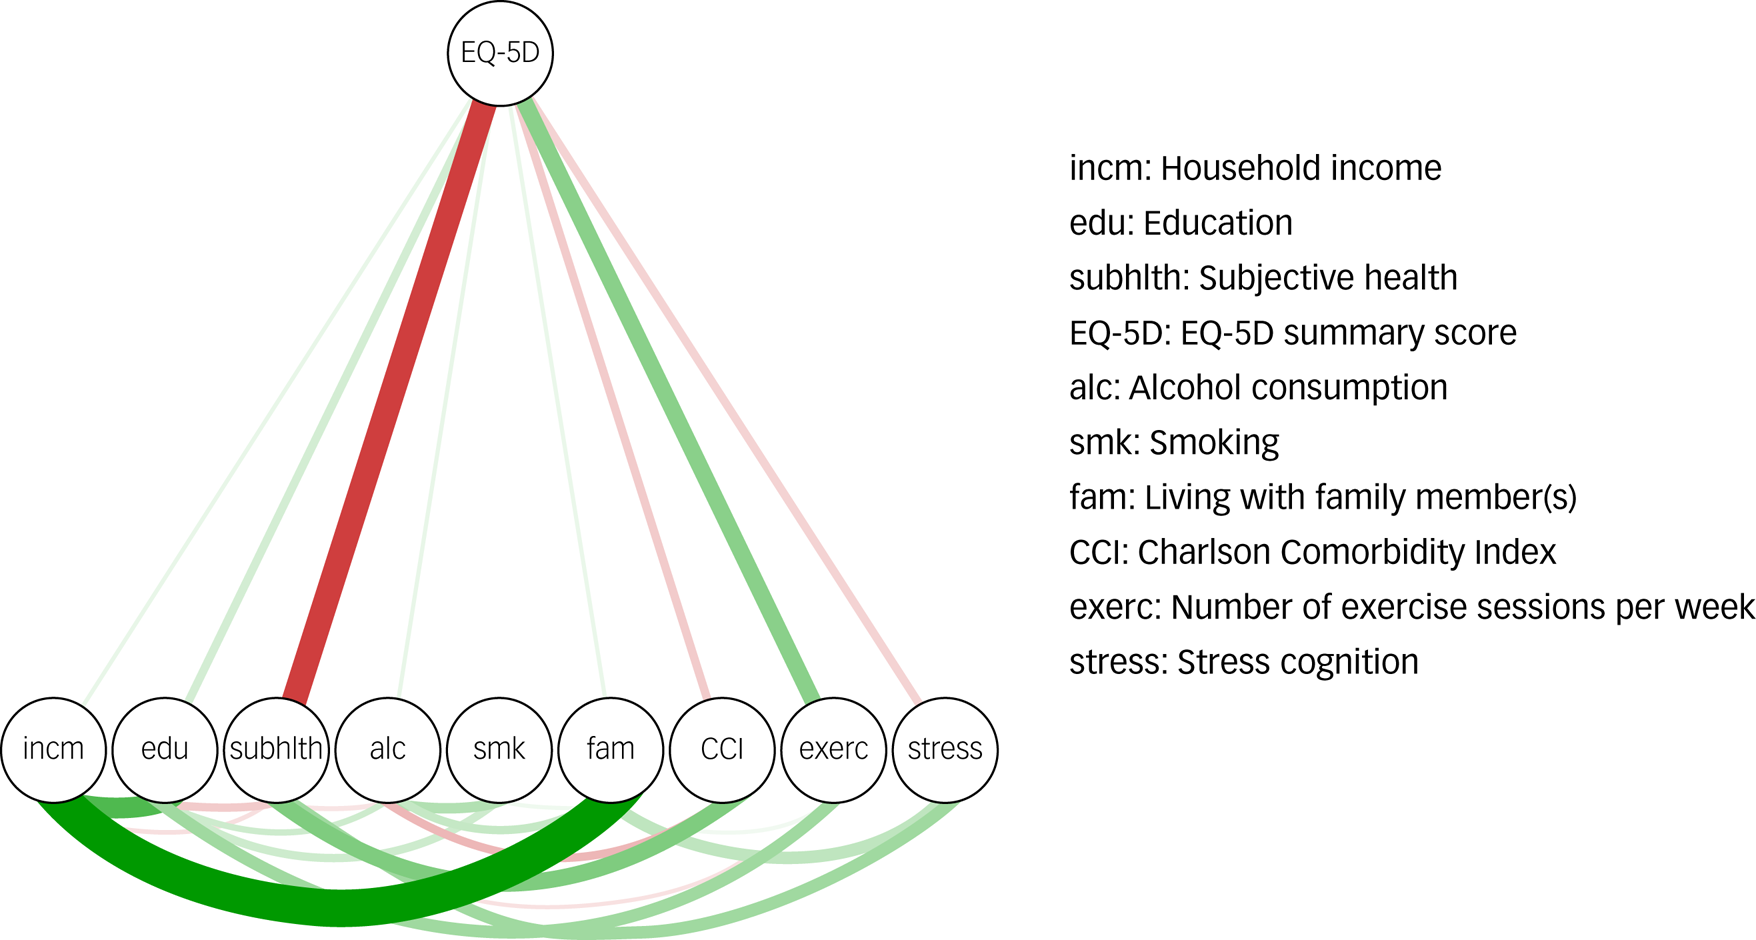
Fig. 4 Network III constructed using the flow function from the qgraph package. Edge weights were derived from the EQ-5D index. Thicker lines indicate stronger edge weights. Red indicates negative edge weights, green indicates positive edge weights.
Discussion
This study investigated Korean nationwide health data for an older adult population with three aims. First, we investigated which node had the central role in a network of HRQoL dimensions. The results revealed EQL3 (usual activities) to have the highest centrality index within the HRQoL network. Second, bridge analysis showed that subjective health, stress and EQL5 (anxiety/depression) had the highest bridge centrality indices. Finally, in Network III, subjective health and exercise were found to be strongly related to the EQ-5D index. Our results have implications regarding HRQoL in the older adult population, which we discuss below.
Usual activities (EQL3) emerged as the most central node, with the highest strength, closeness and betweenness centralities. This suggests that EQL3 has the strongest and closest links with other EQ-5D dimensions. Within the EQ-5D framework, EQL3 is an important index designed to capture activities involved in daily life, such as work, housework, family and leisure activities.Reference Gamst-Klaussen and Lamu27 It often emerges as an important dimension in studies that investigate HRQoL in patients, for example, those with chronic conditions.Reference Bergfors, Astrom, Burstrom and Egmar28,Reference Lin, Pickard, Krishnan, Joo, Au and Carson29 EQL3 can also be referred to as functional independence, defined as one's ability to perform activities of daily living. Functional independence ensures autonomy and is thus an important indicator of older adults’ quality of life.Reference Molenaar, Barten, te Velde, van der Schoot, Bleijenberg and de Wit30,Reference Curzel, Forgiarini Junior and Rieder Mde31 In cases of degenerative diseases that are common in older adults, such as dementia, interventions are often planned to tackle the decline in functional independence, as this is frequently linked to other problematic conditions such as depression, falls and cardiovascular diseases.Reference Thom and Clare32 Furthermore, this result is in line with a previous study that showed functional independence to be a determinant of HRQoL dimensions, including usual activities.Reference León-Salas, Ayala, Blaya-Nováková, Avila-Villanueva, Rodríguez-Blázquez and Rojo-Pérez33 This result highlights the importance of functional independence for older adults and supports the use of various types of aid to maintain functional independence. For example, information technology, mobile phone applications and the Internet of Things are being developedReference Dewsbury and Linskell34,Reference Gonzalez, Navarro, Fontecha, Cabanero-Gomez and Hervas35 to improve functional independence in older adults. In this regard, improvements in smart home technologies that can provide assistance, safety and convenience should be emphasised as a step towards enhancing functional independence in older adults. The results of our study suggest that improving functional independence is a promising direction towards subsequently improving other dimensions of HRQoL in the older adult population.
Another important result of this study was the high bridge closeness and bridge expected influence of subjective health in Network II. Bridge closeness is a measure of the average distance from a node to all nodes in another community, and bridge expected influence is defined as the sum of edges a node has with nodes from the other community. Thus, subjective health may have a strong and immediate effect on all dimensions of EQ-5D. This was emphasised in Network III, where EQ-5D index and subjective health showed a strong negative association. It should be noted that subjective health is a subjective opinion of what an individual thinks of their health on average, whereas each dimension of EQ-5D is descriptive and thus relatively objective. Previous studies have shown that perceived health is significantly worse in older adults compared with younger adults,Reference Cockerham, Sharp and Wilcox36 especially in those with lower levels of income, education and social support, and increased depression.Reference Shields and Shooshtari37–Reference Okamoto and Tanaka39 Low subjective health in older adults is known to be a predictor of mortality and functional decline.Reference Baron-Epel, Shemy and Carmel40,Reference Lee41 Therefore, to improve subjective health in medical services targeted to older adults, these predictive and associated factors should be considered. Our results indicate that improvements in subjective health will have positive effects on HRQoL.
Our results also showed stress and regular exercise to be important bridge factors connecting lifestyle factors and HRQoL. Stress disrupts homeostasis, leading to negative effects on one's health.Reference Chrousos and Gold42 Therefore, it is not surprising that among many lifestyle and psychosocial factors, stress had a close association with HRQoL. The result for exercise indicates that the importance of exercise in older adults cannot be underestimated. Interventions for physical training in older adults have been shown to have positive effects on cognitive functions, mood and dementia.Reference Eggenberger, Schumacher, Angst, Theill and de Bruin43,Reference Lautenschlager, Almeida, Flicker and Janca44 Furthermore, one previous study has shown psychological distress to be a significant mediator between moderate-to-vigorous physical activity and quality of life.Reference Awick, Ehlers, Aguinaga, Daugherty, Kramer and McAuley45 Combined with our results, this specifies the direction of change that cannot be observed in a network. These results highlight the role of exercise as a variable that initiates positive changes in HRQoL and stress. Exercise improves functional independence by preventing ageing and increasing subjective health perception and is also a good means of reducing stress.Reference Mudge, Giebel, Mgt and Cutler46–Reference Singh48 However, the accessibility of exercise to older adults is limited, as they may require specialised methods of exercise because of physical limitations due to ageing. Therefore, the development of specialised programmes in institutions such as senior citizen centres is necessary to promote regular exercise in the older adult population and enhance HRQoL.
This study had a number of limitations. First, data analysis was conducted under a cross-sectional design. Therefore, it was difficult to establish directionality between variables, although for some variables, the causal direction may have been self-explanatory (e.g. living situation and household income). Second, although one of our main results focused on subjective health cognition, only a single item measured this concept. This limitation highlights the need for development of tools to evaluate subjective health cognition in further detail. Third, other important psychosocial and lifestyle factors such as nutrition status, social capital and marital status were not included, despite their possible effects on HRQoL. Finally, although there are other factors that are known to affect HRQoL in older adults, such as cognitive dysfunctionReference Pan, Wang, Ma, Sun, Xu and Wang49 and social isolation,Reference Hawton, Green, Dickens, Richards, Taylor and Edwards50 only a limited number of factors were taken into account owing to the retrospective nature of this study.
Despite these limitations, we obtained meaningful results by evaluating a network comprising factors that have been known to affect HRQoL in older adults using community-based, large-scale nationwide data. To improve HRQoL in older adults, functional independence should be considered a priority target in health policies. Efforts should be made to enhance subjective health cognition via education and psychological interventions rather than considering it to be an individual characteristic. Our results suggest that intervening with respect to modifiable factors such as stress, subjective health and regular exercise may be sufficient enough to increase HRQoL.
Supplementary material
Supplementary material is available online at https://doi.org/10.1192/bjo.2023.536.
Data availability
The data-sets used during the current study are available from the homepage of the Korea Disease Control and Prevention (https://knhanes.kdca.go.kr/knhanes/sub03/sub03_01.do). They can also be made available upon reasonable request to the corresponding author, H.J.J. The code used for analysis in this study is available for public access (https://cran.r-project.org/web/packages/qgraph/index.html).
Author contributions
E.J.C. curated the data, performed data analysis and wrote the first draft of the paper. Y.M., S.-H.R. and H.J.J. reviewed and edited the paper. H.J.J. designed the study and led the investigation. All authors approved the submitted version of the paper.
Funding
This research was supported by Konkuk University in 2022.
Declaration of interest
None.


 Open access
eLetters
No eLetters have been published for this article.