


1. Introduction
Many voters are thought to vote based on cues they find on the ballot itself rather than any trait of the candidate or party. Voters have been shown to chose candidates based on order they are listed on the ballot (Gulzar et al., Reference Gulzar, Ruiz and RobinsonForthcoming; Koppell and Steen, Reference Koppell and Steen2004; Ho and Imai, Reference Ho and Imai2008; Blom-Hansen et al., Reference Blom-Hansen, Elklit, Serritzlew and Villadsen2016) candidate name complexity (Muraoka, Reference Muraoka2021) or the type of voting technology (Fujiwara, Reference Fujiwara2015; Desai and Lee, Reference Desai and Lee2021).
In this research note, we make the first study of perhaps the most prominent behavioral cue on ballots in many democracies, election symbols. As a guide for illiterate voters, many countries, including India, South Africa, Italy Pakistan, the Bahamas, Egypt, Singapore, and Thailand, print a party or candidate symbol next to the candidate's name. These symbols, which may be complex logos of simple pictures of everyday objects, are prominently displayed in the election materials of candidates, and become one of the most important parts of their branding. While symbols are frequently mentioned in ethnographic accounts of elections (Banerjee, Reference Banerjee2013), we are not aware of any systematic study of their effects, or their strategic use by candidates.
The possible effects of ballot symbols at are more complex than ballot order, since voters are theorized to always favor the first candidate due to cognitive heuristics (Kim et al., Reference Kim, Krosnick and Casasanto2015) and all candidates consequently prefer to be first. Symbols, particularly everyday objects can have an emotive appeal to voters, and different groups of voters may be familiar with, or attracted by, different symbols. The “right” way for candidates to choose symbols thus varies both across constituencies and across candidates.
We focus on India, the world's largest democracy, to take advantage of a naturally occurring experiment in symbol allocation. While political parties are permanently assigned symbols, independent candidates apply for a symbol from a list of available ones, giving their top three choices. When multiple independent candidates choose the same symbol, a drawing of lots determines the winner. This lets us study the causal effect of gaining one's preferred symbol, as well as to study descriptively which symbols are chosen where.
Using a set of recent elections in the state of Tamil Nadu, we find that symbols can influence vote choice among lottery-participating independent candidates, even conditional on initial symbol preference and constituency. Independent candidates who win their preferred symbol have a vote share of 21.8percent higher than those who do not, though since most independents perform poorly this effect is small in terms of overall vote share. We believe that the impact of well-established party symbols may possibly be larger—certainly competition between party factions over their use is intense. Politicians respond to these incentives, and there is a high level of competition for the most desirable symbols.
Descriptively, familiarity appears to be the most desirable trait for symbols. Candidates favor symbols previously associated with political parties, or visually resembling those of existing parties. Symbols associated with food, agriculture and cooking are also relatively popular, while furniture and toys are unpopular. At the district level, areas where specific consumer goods are more common are more likely to see those goods chosen as symbols, though we are obviously unable to determine whether this reflects familiarity or affection for these goods, or whether the effect is driven by good owners.
This note makes several contributions to the literature. It reinforces existing findings on the role of behavior and ballot effects factors in voting, providing evidence from a new, a potentially important, behavior cue. It also shows that parties anticipate this behavioral response, and shape their symbol selection to their own appeal and their constituency. More broadly, it shows that visual culture, often treated as epiphenomenal to political processes, can play an independent role in shaping behavior.
2. Symbols in politics
In many democracies, political parties or candidates must include election symbols next to their names on the ballot. These symbols are intended as an aid for voters incapable of reading candidate names, though the policy has persisted in democracies with high levels of literacy. These symbols are assigned or chosen some time before the election, and politicians often make these symbols a central part of their advertising and branding. However, while symbols are often discussed in ethnographic accounts of elections, the authors are aware of no study of their effects.
Voters, especially those who are tired or lack information, may rely on cognitive heuristics to make decisions among candidates. In the case of ballot order, they may assume that candidates listed first are more qualified and important than others, or simply be unwilling to process names after the first. Symbols are potentially much more evocative signifiers than ballot order. In the case of established political parties, they may become associated with traditions of electoral success, or with specific policies. The rooster symbol, for instance, was closely associated with the Democratic party and with white supremacy in the state of Louisiana, and when in 1948 the state's rights faction of the party claimed the rooster for Strom Thurmond and forced Harry Truman to use the donkey symbol, this was considered decisive in destroying Truman's chances in the state (Key, Reference Key1949, 341). Even symbols with no past electoral use may convey information to voters. The Italian Christian Democrat's cross symbol, for instance, conveyed a message about the relationship between the party and the catholic church. In these situations, voters are using symbols to infer candidate ideology and qualifications in much the same way they might use party identification (Bonneau and Cann, Reference Bonneau and Cann2015) or candidate occupation (McDermott, Reference McDermott2005) when those are listed on the ballot.
However, even pictures of everyday objects may convey semiotic content. A lantern, for instance, may convey images of light and enlightenment, guidance, and leadership. Voters may use these symbols to infer candidate's ideology or qualifications even when they symbol assignment has only a limited relationship to their actual traits. To quote Muraoka (Reference Muraoka2021, 315) “confused with a complicated set of options, some voters may find it more difficult to make appropriate judgments about the policy and performance of candidates…[and] perhaps even inadvertently, rely on seemingly minor cues that they easily find at the polling station without regard for their relevance to candidates’ quality.” Such behavioral preferences for superficial traits are well-known in consumer product marketing, where the color or design of logos and packaging strongly influences brand image and consumer choice (Bottomley and Doyle, Reference Bottomley and Doyle2006).
How should candidates respond to this voter behavior? In general, they should try to choose symbols that have positive connotations for voters: strength, competence, benevolence, etc. Which symbols carry such connotations, of course, varies from culture to culture, and from constituency to constituency, so the choices of candidates should vary spatially, unlike the strategic responses of candidates to ballot position (Gulzar et al., Reference Gulzar, Ruiz and RobinsonForthcoming). At a minimum, candidates should favor goods which are familiar to voters, in order to maximize the number of voters making inferences based on the symbol, or to make the candidate seem more familiar to voters.Footnote 1
Note that a candidate with a desirable symbol might alter her behavior to further emphasize the role of the symbol in her campaigning, increasing the visibility of the symbol and their association with it, while candidates with a less desirable symbol make less use of it. In practice, this means that our estimates are a composite of the effect of symbols and the effect of candidates’ behavioral response to their allotted symbol. Without very detailed data on candidates’ visual messaging, disentangling these two mechanisms is impossible. However, both mechanisms are based on the same basic behavioral claims: that some voters vote based on symbols, and that some symbols are contextually more appealing than others.
To summarize, we expect that (1) symbols should influence vote choice, (2) more “effective” symbols should be more popular, and that (3) candidates should chose symbols that are familiar to their constituencies. In the rest of the note, we causally test the first of these claims, and provide some descriptive evidence regarding the other two.
3. Election symbols in India
In India, the world's largest democracy, symbols were instituted at independence as an essential tool for voting in a society with high illiteracy. India is a federal parliamentary democracy where both state and national legislatures are elected from single-member districts using a plurality system. Each candidate has a symbol printed next to their name and button on the electronic voting machine.
Candidates of electorally successful national and state parties (“recognized parties”) are guaranteed the exclusive use of their symbols. These symbols, like the hand of the Indian National Congress and the lotus of the Bharatiya Janata Party, are universally known and closely associated with the parties in question. When parties split, the faction gets the party symbol, which is regarded as having a major advantage. Candidates of “unrecognized” parties, which are unable to meet the minimum electoral performance to be recognized, must choose their symbols from a list of 198 free symbols created by the national Election CommissionFootnote 2, though once they have done so they get the symbol everywhere they run candidates. Most of these symbols are drawings of everyday objects. Figure 1 shows images of the most popular free symbols.
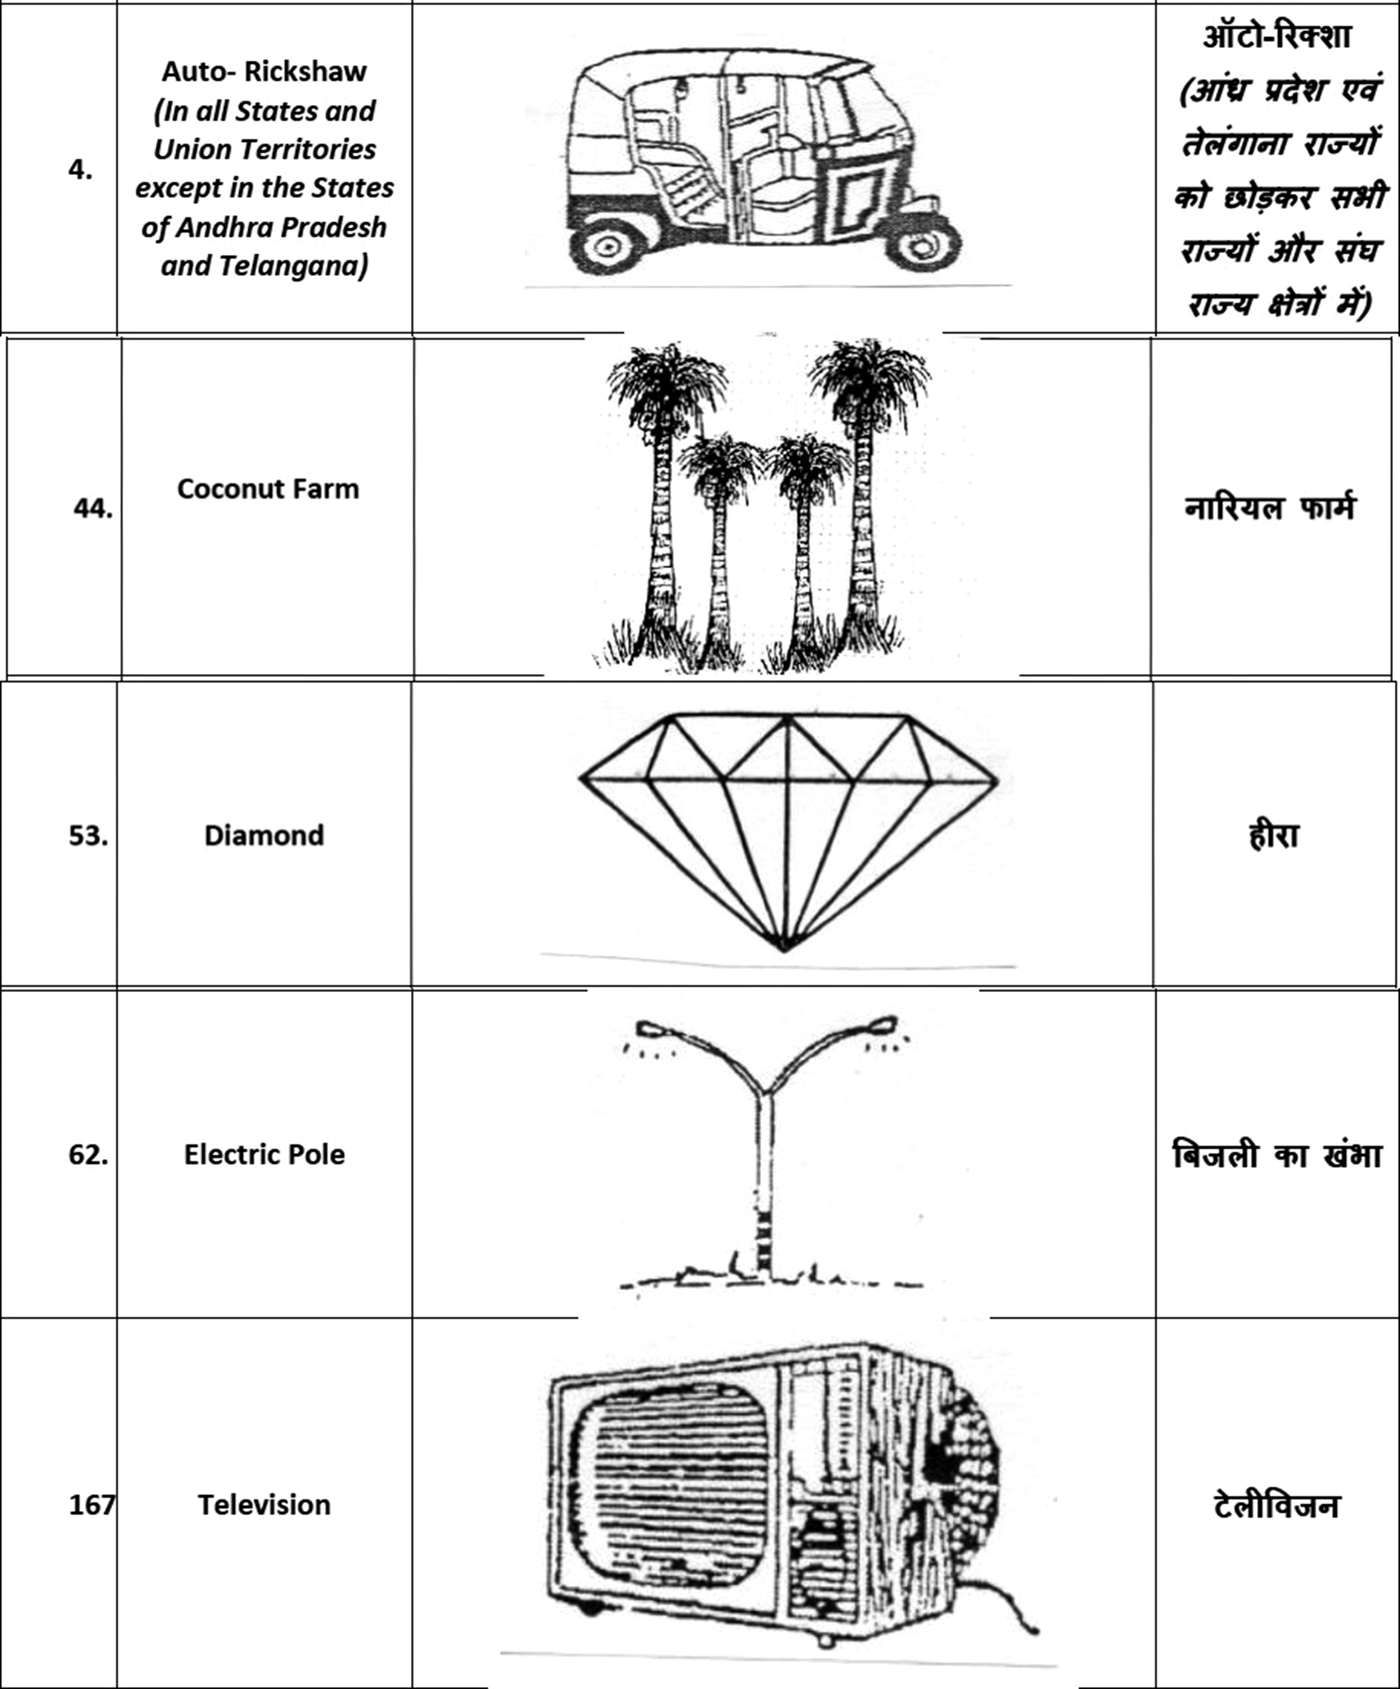
Figure 1. The five most popular free symbols in Tamil Nadu, 2016–21.
Independent candidates are allotted symbols from among the free symbols not claimed by the unrecognized parties. They are allowed (but not required) to list their top three choices of symbol on their nomination forms. Candidates are allotted their top choice if no other candidate wants it. If several independent candidates want the same symbol, the District Electoral Officer (a senior bureaucrat) conducts a drawing of lots to determine who gets it. The losing candidates in the lottery are allotted the next symbol listed on their form if available, and otherwise are allotted a randomly chosen free symbol.
The high value of symbols to parties can be seen in the intrigues within the All India Anna Dravida Munnetra Kazhagam (AIADMK), one of the two major parties in the southern state of Tamil Nadu. Under longtime leaders M. G. Ramachandran (MGR) and J. Jayalalithaa, the party's two-leaves symbol had become ubiquitous on walls and banners in Tamil Nadu. According to the party website, the two-leaves symbol showed Jayalalithaa “is two times the magnificence of other leaders” and “will work double for its people.”Footnote 3 After Jayalalitha's 2016 death, the party was gripped by a factional struggle between her former aides O Panneerselvam (OPS) and Edapaddi K Palaniswamy (EPS) and T. T. V. Dhinakaran, the nephew of Jayalalitha's longtime companion. Both petitioned the election commission for “the famed Two Leaves, [which] has a history of bestowing credibility and cementing loyalty.” The election commission was unable to decide, and granted EPS and Dhinakaran the hat and OPS the electric pole. Both sides were aware of the symbolic possibilities of these choices. Hat-wearing EPS supporters proclaimed that “the Hat is very favourable for us because our leader MGR always wore a hat. We'll wear the hat and camp and it will be definitely effective,” while OPS supporters were pleased that “the symbol in some sense resembles the…two leaves” and that “it was not long ago that Chennai corporation converted all the lamps in city into the two lamps model, and that…has made their job familiarising the twin lamps easy.”Footnote 4 When EPS and Dhinakaran fell out, the election commission granted OPS and EPS the two leaves, while Dhinakaran was granted his own symbols, first the pressure cooker, then the gift box, and then the pressure cooker again.
It is difficult to overstate the role of election symbols in the visual culture of India politics. Banerjee (Reference Banerjee2013, 120) notes that “party symbols are used liberally in all campaign materials; party supporters are encouraged to sport clothing, umbrellas, caps, and scarves marked by the party symbol and in the colours of the party thereby creating maximum visibility and subliminal awareness among voters during a campaign. Great play is also made on the names of parties and the symbols…Akhilesh Yadav of the Samajwadi Party made the most of his party's symbol, which is a bicycle…he cycled thousands of miles across Uttar Pradesh… By doing so he could convey a message about his down-to-earth nature, his accessibility, his desire to identify with the common person despite his expensive overseas education, and his youth and vigor with which he hoped to replace his aging and unwell father.” During the campaign they are painted over walls throughout the country, and independent candidates regard the fact that they are assigned symbols only after nomination, a major disadvantage in making themselves know to voters.
4. Data and estimation
To study the effect of symbols, we focus on four elections in the Indian state of Tamil Nadu. While the list of available symbols and the lot drawing policy are implemented nationally, they are difficult to study because each candidate's top three symbol choices are listed on their nomination forms. These forms, unlike the much-studied affidavits of assets and criminal cases which candidates also submit, are not usually made public, but the Chief Electoral Officer of Tamil Nadu began posting them online in 2019. We scrapped these forms, which were then manually translated from the original handwritten Tamil. These data were then merged with the candidate affidavit data digitized by the Association for Democratic Reforms and the Trivedi Center's Election data.
The data cover four different elections for two different bodies held on three separate days. The 2016 and 2021 state elections chose members for the 234 seats in the state assembly of Tamil Nadu. In April 2019, elections were held for Tamil Nadu's 39 seats in the national parliament, as well as by-elections in 18 state assembly constituencies.
We focus on independent candidates, since they can choose their symbols. Across the four elections, we have data on the symbol choices of 3628 independent candidates.Footnote 5 Of these, 1.3 percent were illegible, 23.7 percent did not indicate a choice, 19.0 percent choose a symbol not on the permitted list, 11.3 percent choose a valid symbol but had their first choice preempted by a unrecognized party, 28.7 percent received their unique first choice, and 9.7 percent made conflicting first choices and were entered into the drawing of lots. We focus on the last category in our causal estimation of the effects of symbols and the last three categories in our descriptive study of symbol choice.Footnote 6 Note that the causal results apply only to the subgroup of candidates choosing “disputed” symbols, who are dissimilar to other candidates in several respects (Table A3).
The dependent variable is logged vote choice in percent. The unlogged variable is strongly right-skewed, as shown in Figure A.1. While a few independent candidates win sizable votes, in Tamil Nadu's two block party system most do very poorly, with the median independent earning only 0.08 percent of the vote. A balance test (Table A.1) shows that lottery winners and losers are similar on pretreatment observables.
While winning the lottery is random, in the overall sample there is heterogeneity between winners and losers in the distributions of symbol choice (since there can be several losers but only one winner) and there is also heterogeneity between constituencies and across types of elections in the level of political competition. For these reasons, the main models include fixed effects for each drawing of lots (year-constituency-first choice symbol). For this reason, the estimates we present are the effect of winning the lottery conditional on constituency and symbol choice, neither of which vary within strata. Standard errors are clustered at the constituency-year level to account for the interdependence of vote choice in a race. The estimating equation is thus:

where Log(VoteShare)ijt is the logarithm of vote share of candidate i of constituency j in year t, LotteryWinner i is the dummy variable indicating whether candidate i won the lottery, F ljt is the lottery fixed effect in year-constituency-first choice level, and $\epsilon _{ijt}$ is the error term.
5. Results
Table 1 shows the effect of winning one's preferred symbol on vote share. For a candidate with the median vote share, winning one's preferred symbol would increase vote share by 21.8 percent.Footnote 7
Table 1. The effects of winning lottery on vote share
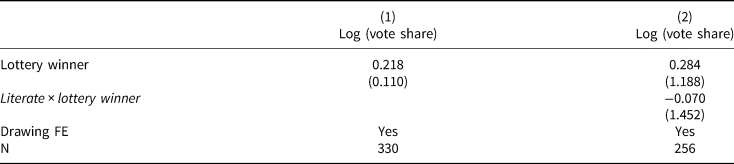
Note: The table reports the effects of winning lottery in symbol assignment on the vote share of the candidates. The results show that winning lottery increase vote share by 21.8 percent. Standard errors in parentheses are clustered at the constituency. The drawing fixed effect of symbol selection and constituency is included in each model.
It is tempting to theorize that the effect of winning a symbol would be higher in areas with high illiteracy, where more voters might be supposed to be choosing candidates based on their symbol. However, there is insufficient variation in Tamil Nadu (one of India's more literate states) to test this. Model 2 shows that while the effect of winning the lottery is higher in districts with high literacy, the effect is not statistically significant in our relatively small sample.Footnote 8
What types of symbols are chosen? Figure 2 shows the top 20 symbols chosen by candidates. Of these symbols, eight had a previous association with a political party or faction, or are thought to resemble a major party symbol.Footnote 9 The other popular symbols include the diamond, television, and coconut farm.
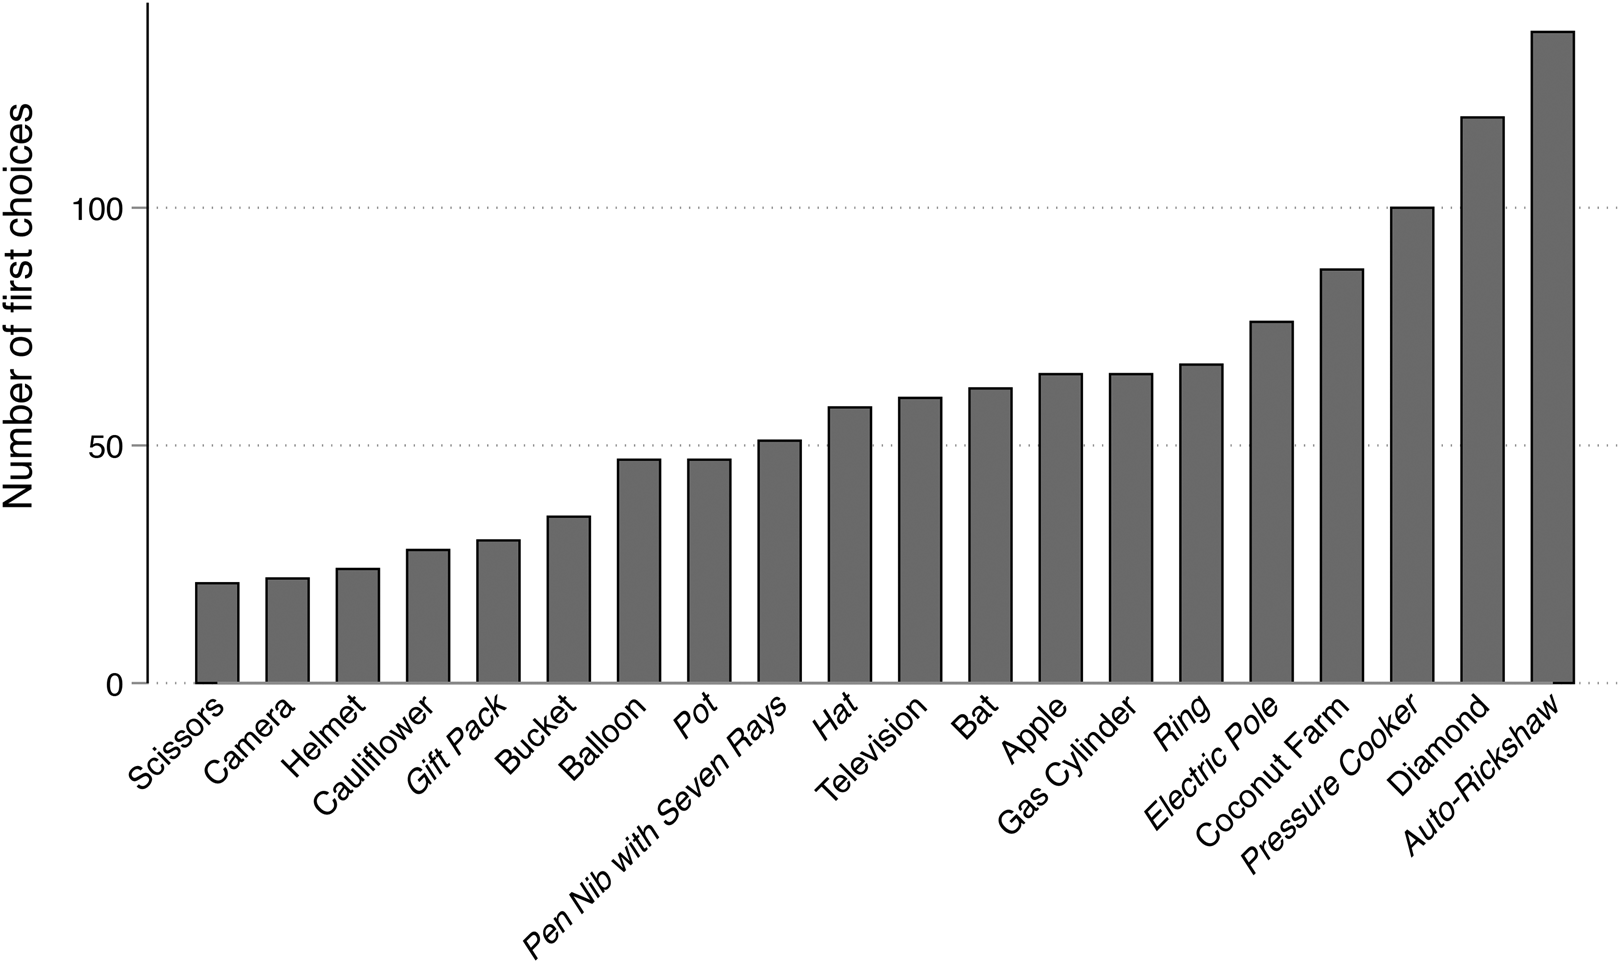
Figure 2. The top 20 first choice symbols. Note: This figure shows most popular first choices of candidates in the Tamil Nadu sample by number of chosers. Symbols associated with a party are marked in italics.
The set of popular symbols is quite heterogeneous and culturally specific. For instance, we suspect that the coconut farm symbol would be less appealing in states other than Tamil Nadu, which is India's largest coconut-growing state and where the trees are very common. Figure A.2 shows the distribution of first choices across categories of free symbols, relative to the overall distribution of free symbols. Overall, candidates do not seem to cluster on particular categories of symbol. While symbols associated with familiar daily activities such as transportation and construction and cooking are popular, this is broadly reflective of the distribution of available symbols.
Whatever their origins, some symbols are plausibly more effective than others. Figure 3 shows these heterogeneous effects for the nine symbols chosen by more than ten lottery entrants. While the estimates are imprecise, some symbols appear to influence vote choice more positively than others, with the effect of the diamond being statistically significant. Interestingly, we see some evidence that candidates are responding to these incentives. Figure 3 also reveals that the symbols with the highest estimated effects also tend to be chosen more commonly by candidates, though there is considerable variation.
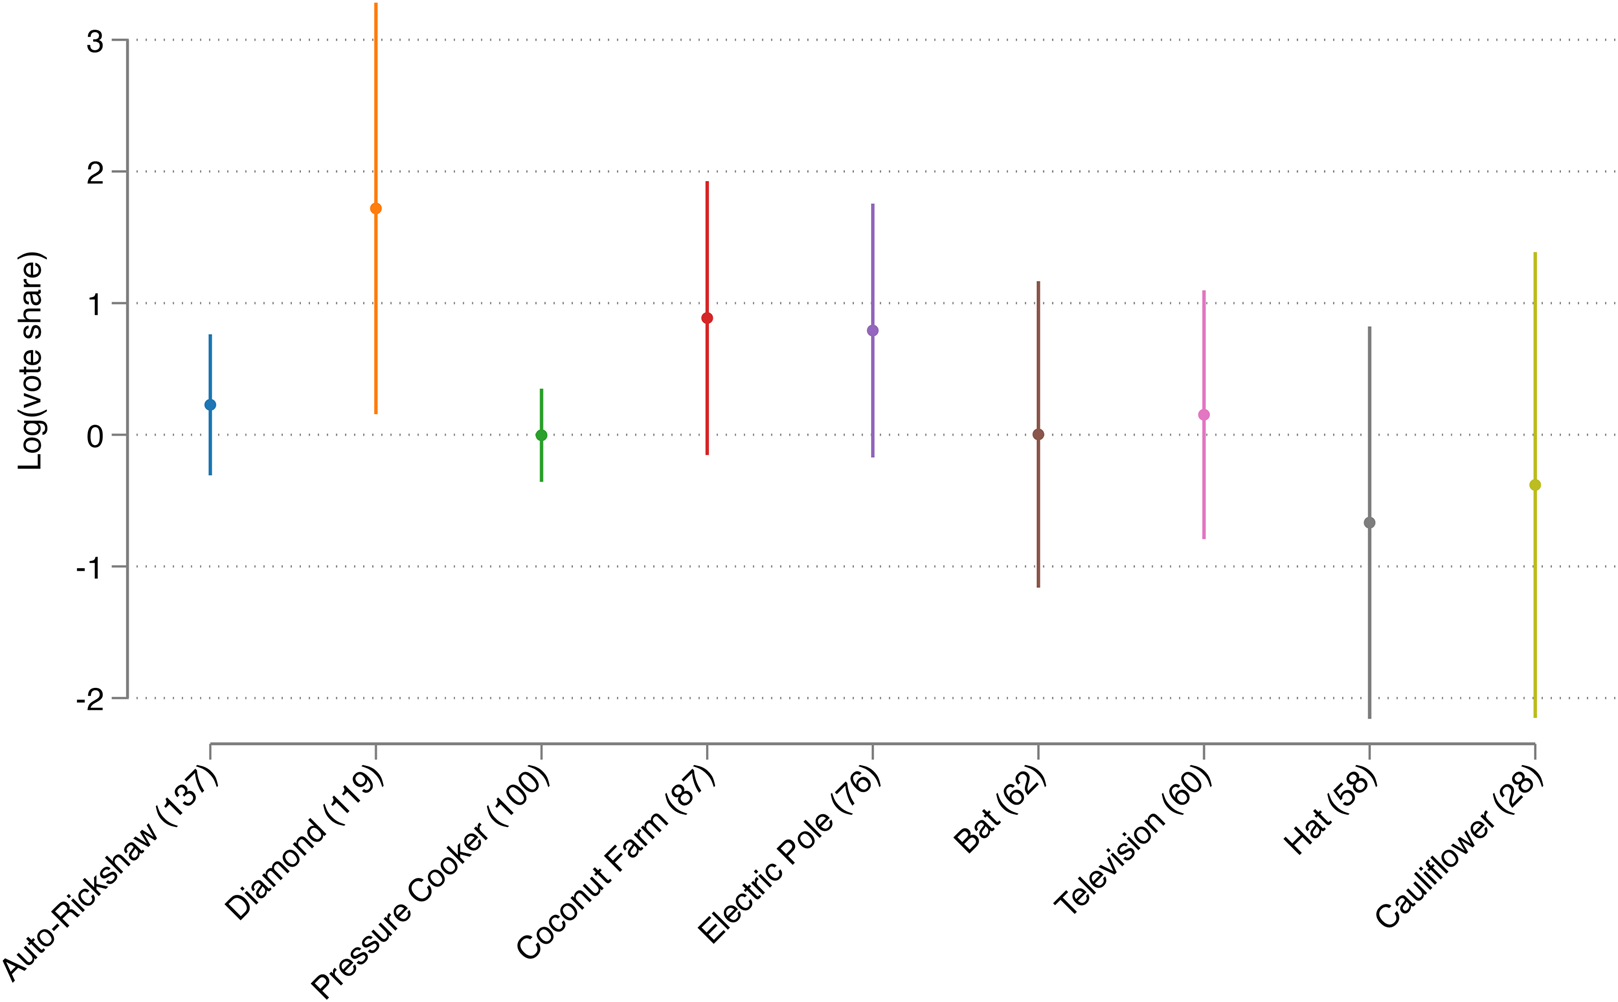
Figure 3. Estimated effect of lottery winning by first-choice symbol. Note: This figure displays the coefficient estimates for the effect of winning the lottery for each of the ten most popular symbols. The confidence level of estimation is 90 percent. The number of candidate first choices is shown in the parentheses.
Do candidates choose symbols that are particularly fitted to their constituency? We find some evidence for this in Table 2, which shows that candidates are more likely to choose objects that are relatively familiar to their voters. Using the 2016 National Family Health Survey, we calculated the proportion of households in each administrative district who possess a wide variety of household goods. We focus on four goods that are relatively common as symbols (greater than 0.5 percent of first choices) and neither universal nor rare for households—air conditioners/coolers, pressure cookers, gas stoves/canisters, and computers. The choice of these symbols is more common in areas where they are common in the homes of voters, and we can jointly reject the null that the joint effect is zero. The results with full controls are shown in Table A.2. There are at least three possible mechanisms for this finding: That some voters have an emotional attachment to goods they possess and candidates attempt to exploit these attachments, that candidates are not strategic but choose goods which they themselves possess, and that candidates simply dislike goods which they believe would make communication more difficult. We cannot adjudicate among these mechanisms, but given the overall preference for familiar symbols in the sample we find the second and third more plausible.
Table 2. The effects of district features on symbol choices
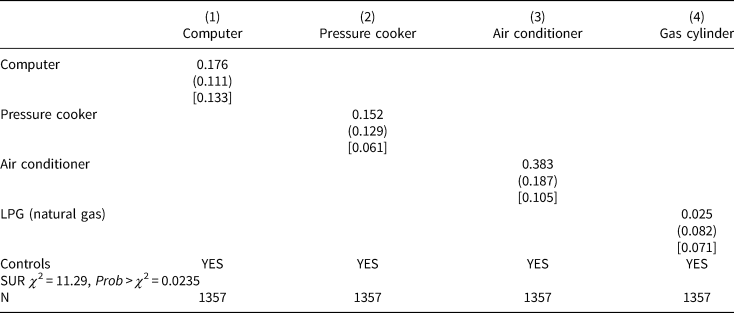
Note: The table reports the correlation between district features and symbol choices by individual candidates. Empirical results show that the candidates from districts with more air conditioner are more likely to choose it as the election symbol. Standard errors in parentheses and square brackets are clustered at district level. The standard errors in parentheses are from single OLS regression models and standard errors in square brackets are from SUR joint model test. The table with full controls is presented in Table A.2.
6. Discussion and conclusion
Election symbols, like other aspects of ballot structure, have a small but appreciable effect on vote choice, with candidates who obtain their preferred symbols winning significantly more votes than those that do not. Note that this is very probably an underestimate of the potential effect of symbols, since we are estimating the effect of first choice symbols relative to second and third choice symbols, rather than relative to the least attractive symbols. In addition, many of the most attractive symbols are presumably chosen by political parties. The results suggest that more study of the role of visual culture in politics may be warranted.
Unlike other elements of ballot structure, what constitutes a good symbol varies from constituency to constituency and from candidate to candidate, with candidates choosing symbols likely to be familiar to themselves and to their voters. This indicates that candidates are strategically responding to the behavioral heuristics of voters, attempting to maximize the degree to which “irrational” elements of voter's decision calculus benefit them. To the extent that these choices contain meaningful information about candidate type, symbols, and images more generally, may in fact be a more reasonable decision heuristic for voters than others commonly in use. Future research may wish to focus on the way political images are chosen to signal the policy and personality of candidates.
Supplementary material
The supplementary material for this article can be found at https://doi.org/10.1017/psrm.2023.58. To obtain replication material for this article, https://doi.org/10.7910/DVN/TJ8CUV
Acknowledgements
We thank Charithra Chandran and Amirthavarshani Maha for extraordinary research assistance.


