


1. Introduction
The creation of context-related Knowledge Graphs (KGs), that is, KGs that can be used only in specific environments, seems to be the next step for allowing KGs to become the main knowledge representation format for the Web (Abu-Salih, Reference Abu-Salih2021). The semantic knowledge graph, which combines the RDF knowledge graph with the simple knowledge organization and links resources to the unstructured data, is a suitable knowledge representation structure for a knowledge-based system. Moreover, Decision Support Systems (DSSs) basically are knowledge-based applications which can be aided in a great extent by KGs, as KGs can bring to the surface semantically related information in order for a DSS to produce its decisions.
Our focus in this work is on representing information for disaster management and media planning, more specifically, information about: (a) Observations and Events (for example, information from photos, and information from text messages); (b) Spatial and Temporal data, such as coordinates or labels of locations and timestamps; and (c) Tasks and Plans for disaster management and media planning. Information representation in Linked Open Data format aids in the data’s reuse and linkage with other KGs (Ehrlinger & Wöß, Reference Ehrlinger and Wöß2016; Villazon-Terrazas et al., Reference Villazon-Terrazas, Ortiz-Rodriguez, Tiwari and Shandilya2021). For an individual in a disaster management situation it is also important to access geospatial data that contains information about the location that suffered the destruction. Moreover, when covering a recording of a documentary in a remote location, unknown to the media production team, a journalist should have access to geospatial data that gives details on the location they will be visiting. This information will enable him or her to accurately and cost-effectively setup the production. For this reason, we provide a mechanism that creates or updates Points-of-Interest (POIs)Footnote 1. We will refer throughout the paper to the POI creation/update mechanism as POI management mechanism. The formal definition of a POI is a specific place or location point inside a map that someone may find useful or interesting. In our situation, POIs also comprise geospatial data that includes details from user-provided videos, photos, and text messages on the condition of a location which has suffered a destruction and data that can assist journalists in actual situations involving media preparation.
Our work is based on two major use cases. The first one is for disaster management which has as target group the first responders and citizens of a location. The second one is for media planning which has as target group media crews and journalists. Therefore, the tools presented below, that is, the POI management mechanism, the task creation/update mechanism, and the danger zone creation/update mechanism can be used by either group. More specifically, the POI management mechanism and the task creation/update mechanism can be used by both groups, that is, first responders/citizens and media crews/journalists. The danger zone creation/update mechanism, though, is mostly oriented for the first responders and the citizens.
Following the POI management mechanism, a first responder is also interested in the actions (s)he has to perform in the unfortunate scenario of a disaster. For this reason, the module we propose is equipped with an automatic task creation mechanism which indicates to first responders exactly what task they have to perform during a disaster. For example, a task could be the following: in the case of a flood the first responders should construct flood wall barriers at the spots with coordinates (x, y), in order to restrict the spread of the flood. The task creation mechanism assigns tasks to POIs and is based on a data-driven DSS. First responders and citizens, apart from a POI which contains information about a specific point in the map, are also interested to know which region has been affected by a disaster and how dangerous the area is (i.e., severity of the area). Therefore, we also provide a mechanism that creates or updates danger zones and assigns to them severity scores indicating the level of severity. Similarly to the task creation mechanism, the danger zone mechanism gets the severity score from a DSS. Notice that the task creation mechanism can also be used by journalists or media crews for media planning.
The KG of the XR4DRAMA framework was created, to serve as the knowledge representation for the XR4DRAMA projectFootnote 2. Through the use of many technologies, including eXtended Reality (XR), XR4DRAMA is committed to enhancing situation awareness. The main use cases of the XR4DRAMA project focus on disaster management and media planning. In short, the XR4DRAMA project stands in three key points: (a) Facilitating the gathering of all necessary (digital) information for a particular, difficult or even dangerous situation that a media team faces, (b) Utilizing extended reality technologies to simulate an environment ‘as if on site’ in order to accurately predict an event or incidence, and (c) Establishing a shared understanding of an environment and giving users of the project’s platform (first responders in the field/control room, citizens, and journalists) the option to update representations of locations as events change, allowing them to comprehend and re-evaluate the effects of particular actions/decisions. As a result, the KG of the XR4DRAMA framework may incorporate the findings of several advanced analysis components that process multimodal data and depict the structures they produce (in this project, for the media use case, we integrate visual and textual analysis messages). Additionally, the XR4DRAMA framework provides an innovative method through its POI management mechanism that may generate or update POIs, which contain essential geospatial data that can make it easier for journalists to cover the production recordings and information that is needed in a case of emergency.
The most important information during disasters for the people involved is the situation before the disaster and is mostly unavailable. Furthermore, first responders are not trained to face those real-life scenarios because mostly they acquired theoretical knowledge on how to act during events. The extended reality environment can replicate the principal features of a general disaster. The KG of the XR4DRAMA framework can work as the knowledge representation mechanism that will allow participants to be trained in a safe situation also making use of physiological sensors to monitor response and health data.
As part of their day-to-day business, journalists and other media houses produce news coverage in various locations. Despite thorough research and preparation, remote production planning very often runs into challenges and difficulties. Much depends on the characteristics of the individual location and the situation on the ground. These challenges can be circumstantial and organizational — like accessibility, noise, the presence of people, the lack of infrastructure (from electricity supply to parking space), the wrong choice of equipment or other filming restrictions. Hence, it is crucial for journalists and media houses to access information about the state of a location, such as the accessibility of the location, among others, in order to plan their media coverage.
The challenge is to combine all this information in order to give everyone a precise description of the state of the location and the situation on the ground in order to prepare themselves for a smooth and safe production. The XR4DRAMA framework is capable of filling the aforementioned gap in distribution of crucial knowledge to journalists, in order for them to be able to plan more efficiently the news coverage. Moreover, with the XR4DRAMA framework, the status of first responders can be monitored, to better assign tasks during emergencies. Based on the aforementioned aspects, the XR4DRAMA framework in a real-life scenario can provide first responders important information and can reproduce in real time the actual event inside the control room to allow for well-informed and efficient decision-making. Therefore, the XR4DRAMA framework has two groups of targeted audience, which can use the KG separately, the first responders and the media.
Our contribution in this paper, is the KG of the XR4DRAMA framework which can represent multi-modal measurements, by mapping textual, visual, and stress-level messages/measurements, which in turn can aid citizens and first responders, in order to avoid crisis or tackle with the best possible outcome a disaster that has already occurred, and let journalists report the important elements in a location as effectively as possible. Another contribution of the paper is the POI management mechanism for the XR4DRAMA framework, which could be helpful in real-life scenarios by creating (or updating) POIs that will further ease the work of first responders and notify the citizens. Moreover, the POI management mechanism can be useful in real-life occasions by creating and maintaining POIs that will further facilitate journalists’ work by informing them of the location’s current condition. Next, the task creation mechanism is another contribution of this paper; it indicates to first responders, citizens, and journalists exactly what task they have to perform during a disaster, for the best possible outcome. Finally, the danger zone creation/update mechanism is a contribution of this paper, as the danger zone mechanism which indicates what regions have been affected by a disaster and what is the level of severity for that specific area. The source code of the XR4DRAMA framework along with the evaluation results, can be found hereFootnote 3.
The rest of this paper is organized as follows. Section 2, discusses the related work. The XR4DRAMA framework, the POI management mechanism that creates or updates POIs, the task creation and danger zone creation/update mechanisms are all presented in Section 3. The evaluation of the KG, the POI management mechanism, the task creation mechanism, and the danger zone create/update mechanism can be found in Section 4. Lastly, we conclude our paper with Section 5.
2. Related work
The study has four main components, the KG of the XR4DRAMA framework, the POI management mechanism which extracts knowledge from the XR4DRAMA framework, the task creation mechanism, and the danger zone creation/update mechanism. For this reason, we separate our related work into four main sub sections, one for similar knowledge graphs, one for the information extraction mechanisms for disaster management and media planning, one for task creation mechanisms in media planning and disaster management scenarios, and a fourth one for danger zone creation in disaster management scenarios.
Knowledge graphs disaster management: The first category of knowledge graphs that can be considered close to the KG of the XR4DRAMA framework, are KGs for destructions. It is worth noticing that this area of KGs is not very rich, as there were just a handfull of studies related to KGs for destructions. Some interesting cases are Li & Li (Reference Li and Li2013) and Chou et al. (Reference Chou, Zahedi and Zhao2010, Reference Chou, Zahedi and Zhao2014). In the first one, the authors present a KG for semantic representation of textual information, whose main aspect is the multi-document summarization for disaster management. However in the other two studies, the authors present similar KGs (i.e., multi-document summarization for disaster management), but for information existing in various websites for disaster management. The difference between the aforementioned studies and the KG of the XR4DRAMA framework lies mostly in the aspect that KG of the XR4DRAMA framework can represent knowledge for visual messages and stress-level measurements and can also create POIs which can help in real-life scenarios.
Next, the study of Murgante et al. (Reference Murgante, Scardaccione and Casas2009) presents a KG for seismic risk domain. The authors develop a KG which offers an improvement of semantic interoperability, in order to decrease the economical and social costs, deriving from seismic events, which by extension can lead to a prevention strategy to reduce damages. The COVID-19 KG (Wise et al., Reference Wise, Ioannidis, Calvo, Song, Price, Kulkarni, Brand, Bhatia and Karypis2020), was also constructed in order to improve the semantic interoperability of the literature about the current pandemic. Nevertheless, the KG of the XR4DRAMA framework is more general than the aforementioned studies, as it is not restricted to only one type of disaster.
The area of KGs for disaster management is richer than the area of KGs for destructions; some papers that present a blueprint of what a KG for disaster management should contain are presented in Werder (Reference Werder2007); Xu & Zlatanova (Reference Xu and Zlatanova2007) and Klien et al. (Reference Klien, Lutz and Kuhn2006). In the last two, the focus is mostly on geospatial information about a disaster, while the first one is more general. The difference between these studies and KG of the XR4DRAMA framework, is that they remain at a theoretical level while we offer a complete KG with a POI management mechanism.
In Zhang et al. (Reference Zhang, Zhu, Zhu, Xie, Li, Fu, Zhang and Tan2020) and Purohit et al. (Reference Purohit, Kanagasabai and Deshpande2019), the authors present a deep learning model that can generate a KG for disaster management, but as most data-driven models it is restricted upon the data that is trained. This means that if a new case needs to be inferred, for instance a different type of disaster, new classifiers need to be trained. Comparing this to the KG of the XR4DRAMA framework which is not restricted to the information existing in some datasets, shows that our KG might be more general than these models. Close to our study is Moreira et al. (Reference Moreira, Ferreira Pires, van Sinderen and Costa2015), where the authors present a KG for disaster management, but they do not include a POI management mechanism, for accessing the information in the KG. Similar is the case of Babitski et al. (Reference Babitski, Bergweiler, Grebner, Oberle, Paulheim and Probst2011), as there is no POI management mechanism.
One can take a more detailed view for the KGs about disasters and disaster management by reading the survey of Mazimwe et al. (Reference Mazimwe, Hammouda and Gidudu2021).
Knowledge graphs for media planning: The area of KGs for media planning is not very rich, as only a handful of studies can be classified in this area. For instance, the studies of Opdahl et al. (Reference Opdahl, Berven, Alipour, Christensen and Villanger2016) and Berven et al. (Reference Berven, Christensen, Moldeklev, Opdahl and Villanger2018) are two similar studies which present mechanisms for media planning. The basic concept for both these studies is that they offer a news extraction mechanism which based on the semantics of a KG, will extract related posts from social web sites, and other well-known media houses, about an event. This synergy of news extraction, and subsequently representation of knowledge about an event, is set to help a journalists to see what parts of the event have been covered, and what are the restrictions for accessing a location to cover the event. The difference with the KG of the XR4DRAMA framework lies mostly in the POI management mechanism, as we offer the most crucial information about an event in a POI, and therefore make it more easily digestible for the journalists, while Opdahl et al. (Reference Opdahl, Berven, Alipour, Christensen and Villanger2016) and Berven et al. (Reference Berven, Christensen, Moldeklev, Opdahl and Villanger2018) return information in the form of text which can be more time consuming for an individual to process.
The area of media planning in disasters based on KGs is also not so rich, as to the best of our knowledge, only a few studies exist in this area. KG in media are mostly used for fake news detection (Pan et al., Reference Pan, Pavlova, Li, Li, Li and Liu2018) and building event-centric news (Rospocher et al., Reference Rospocher, van Erp, Vossen, Fokkens, Aldabe, Rigau, Soroa, Ploeger and Bogaard2016; Tang et al., Reference Tang, Feng and Zhao2019). Some exceptions are Wang & Hou (Reference Wang and Hou2018) and Ni et al. (Reference Ni, Liu, Zhou and Cao2019). In the former, the authors propose a method to construct a KG for disaster news based on an address tree. Address Trees, are tree structures which analyze an address having as root the broader region. For example, home address
 $\to$
town district
$\to$
town district
 $\to$
town, is a small address tree. In the latter, the authors present a data-driven model which generates storylines from huge amount of web information and proposes a KG-based disaster storyline generating framework. For the work of Wang & Hou (Reference Wang and Hou2018), comparing to KG of the XR4DRAMA framework there is not a mechanism for creating POIs, and the indication for the location is given in string descriptions which can be obscure in some cases, while KG of the XR4DRAMA framework represents locations with coordinates. For Tang et al. (Reference Tang, Feng and Zhao2019), the issue of noise in the data inserted in the KG is addressed, an issue which is not part of the KG of the XR4DRAMA framework.
$\to$
town, is a small address tree. In the latter, the authors present a data-driven model which generates storylines from huge amount of web information and proposes a KG-based disaster storyline generating framework. For the work of Wang & Hou (Reference Wang and Hou2018), comparing to KG of the XR4DRAMA framework there is not a mechanism for creating POIs, and the indication for the location is given in string descriptions which can be obscure in some cases, while KG of the XR4DRAMA framework represents locations with coordinates. For Tang et al. (Reference Tang, Feng and Zhao2019), the issue of noise in the data inserted in the KG is addressed, an issue which is not part of the KG of the XR4DRAMA framework.
The following studies (Rospocher et al., Reference Rospocher, van Erp, Vossen, Fokkens, Aldabe, Rigau, Soroa, Ploeger and Bogaard2016; Tang et al., Reference Tang, Feng and Zhao2019), present methods and tools to automatically build KGs from news articles. As news articles describe changes in the world through the events they report, an approach is presented to create event-centric KGs using state-of-the-art natural language processing and semantic web techniques. Such event-centric KGs capture long-term developments and histories on hundreds of thousands of entities and are complementary to the static encyclopedic information in traditional KGs. Even though these two studies might not solve exactly the same problem with XR4DRAMA framework, the crucial information can be accessed through sophisticated SPARQL queries, which might not be user-friendly even with an UI. On the other hand, XR4DRAMA through its POI management mechanism serves the crucial information about an event, with a POI, which is more easily understandable by an individual. One can have a more detailed view at KGs for media by reading the survey (Opdahl et al., Reference Opdahl, Al-Moslmi, Dang-Nguyen, Gallofré Ocaña, Tessem and Veres2022).
Information retrieval mechanisms for disaster management and media planning: Currently, the information extraction mechanisms that exist in the area of disaster management and media planning are not related to a KG; this is an important drawback as semantically related information is ignored. The studies Islam & Chik (Reference Islam and Chik2011); Bouzidi et al. (Reference Bouzidi, Amad and Boudries2019); Shen et al. (Reference Shen, Murzintcev, Song and Cheng2017), present information extraction mechanisms that extract information from various websites, for decision support. However, the recommended decision is not a result of reasoning, which can be achieved mostly with the semantics of a KG. Similar is the case with Pi et al. (Reference Pi, Nath and Behzadan2020); Vallejo et al. (Reference Vallejo, Castro-Schez, Glez-Morcillo and Albusac2020), where drone footage from disasters is analyzed. The POI management mechanism of the XR4DRAMA framework, can give an initial direction on how a KG can be used in order to manage crucial information about a disaster.
The current pandemic brought the need of sophisticated information extraction mechanisms, which can semantically connect information in the extensive literature about the COVID-19 topic. For this reason, many data-driven models (Esteva et al., Reference Esteva, Kale, Paulus, Hashimoto, Yin, Radev and Socher2021; Roberts et al., Reference Roberts, Alam, Bedrick, Demner-Fushman, Lo, Soboroff, Voorhees, Wang and Hersh2020), that extract information from the literature, in order to help health workers to do their work, were developed. However, as most data-driven question answering models, they are restricted to a specific set of data, and new classifiers need training over huge amount of data to tackle new questions. This is not the case, with an information extraction mechanism that is based on the information of a KG, as answering a new question can be just a translation of a natural language question to a SPARQL query. XR4DRAMA framework is based on this philosophy.
Task creation mechanisms for disaster management and media planning: The area of task creation for disaster management and media planning is quite rich, but it has not been coupled yet with the semantically related information that could be provided from a KG, neither the tasks which are recommended are the result of a DSS. For instance, the following three studies recommend methodologies on collaborative decision-making and task performing for disaster management, and news coverage (Noran, Reference Noran2014; Sabur, Reference Sabur2012; Boné et al., Reference Boné, Dias, Ferreira and Ribeiro2020). Additionally the study Boné et al. (Reference Boné, Dias, Ferreira and Ribeiro2020) offers an information extraction mechanism from visual and textual data for better decision-making. But none of the aforementioned studies are based on a KG, which could enhance the quality of the information which is put into the decision-making, and therefore making the decision not equipped semantically related information.
Next, the studies Li et al. (Reference Li, Zhu, Zhang, Fu, Gong, Hu and Cao2020) and Shen et al. (Reference Shen, Murzintcev, Song and Cheng2017) offer an XR simulation with digital twins which perform recommended tasks in various disaster management scenarios. The tasks include media coverage and first responder responsibilities during disaster. The study of Sinha et al. (Reference Sinha, Kumar, Rana, Islam and Dwivedi2019) indicates how the technology of Internet of Things helps in task creation during disasters for media planning and first responders, by displaying how the agile and quick exchange of information optimizes the management of a disaster. Finally, the study of Lee & Bui (Reference Lee and Bui2000) develops a Multi Agent System which during a disaster management scenario needs to come up with an optimal task sequence in order to tackle with the best possible outcome the disaster. Similar to Noran (Reference Noran2014); Sabur (Reference Sabur2012); Boné et al. (Reference Boné, Dias, Ferreira and Ribeiro2020) the aforementioned studies do not use a KG as a background knowledge and also do not have a DSS.
Project GenoaFootnote 4 was a software project commissioned by the United States’ DARPAFootnote 5 to analyze large amounts of data and metadata to help human counter-terrorism analysts. Genoa’s primary function was intelligence analysis in order to assist human analysts. The program was designed to support both top-down and bottom-up approaches; a policy maker could hypothesize a possible attack and use Genoa to look for supporting evidence of such a plot, or it would compile pieces of intelligence into a diagram and suggest possible outcomes. Human analysts would then be able to modify the diagram to test various cases. The difference between the project Genoa and the framework presented in this paper, is that it is a DSS for a different contexts as we focus on disaster management and media planning, and project Genoa focuses on terrorism.
Danger zone creation or update for disaster management and media planning: In contrast to the area of task creation for disaster management and media planning which is rich, the area of danger zone mechanisms, that is, mechanism that will create or update danger zones in an area based on some severity score have not been given much attention. In this area we found only a handfull of studies related to danger zone creation or update, but not necessarily with the help of a DSS or with background knowledge coming from a KG. More specifically, the studies for danger zone creation during a disaster mostly refer to how media can affect the common opinion in order to create clusters of safe areas in a map. For instance, the study Karasneh et al. (Reference Karasneh, Al-Azzam, Muflih, Soudah, Hawamdeh and Khader2021), creates or updates safe areas for the COVID-19 pandemic (i.e., where the spread is big and where not). Similarly Siders et al. (Reference Siders, Hino and Mach2019) creates safe and danger areas after an earthquake has occurred. The aforementioned studies do not use a DSS to create/update a danger zone, and also do not have a KG as a background knowledge base, comparing to our study. One could also read the following reviews about danger zone creations or updates (Saja et al., Reference Saja, Goonetilleke, Teo and Ziyath2019; Oh & Lee, Reference Oh and Lee2020), but the authors in both studies do not strictly define what is considered a danger zone therefore they provide various definitions as to what is a danger zone.
3. XR4DRAMA framework
The project’s platform’s back-end includes the KG of the XR4DRAMA framework. Because of this, a detailed investigation of the multimodal mapping mechanism that accepts messages from the visual and textual analysis components and transmits their content into the XR4DRAMA framework will be skipped. Nevertheless, one can find a blueprint of these messages hereFootnote 6. Moreover, the source code of the multimodal mapping mechanism can be found here footnote 1. The idea behind the pipeline is to map the data into the KG after the multimodal mapping mechanism has received the message from a component. The POI management mechanism of the XR4DRAMA framework will then construct a new POI or update an existing one based on the information in the message and the information from the KG, when the message is received from the textual or visual analysis component. In the second case, the premise is that a generated POI’s status has changed, for instance, the area has become crowded, necessitating an update of the POI’s metadata. The pipeline is depicted in Figure 1, where each circled number denotes a different step’s sequence.
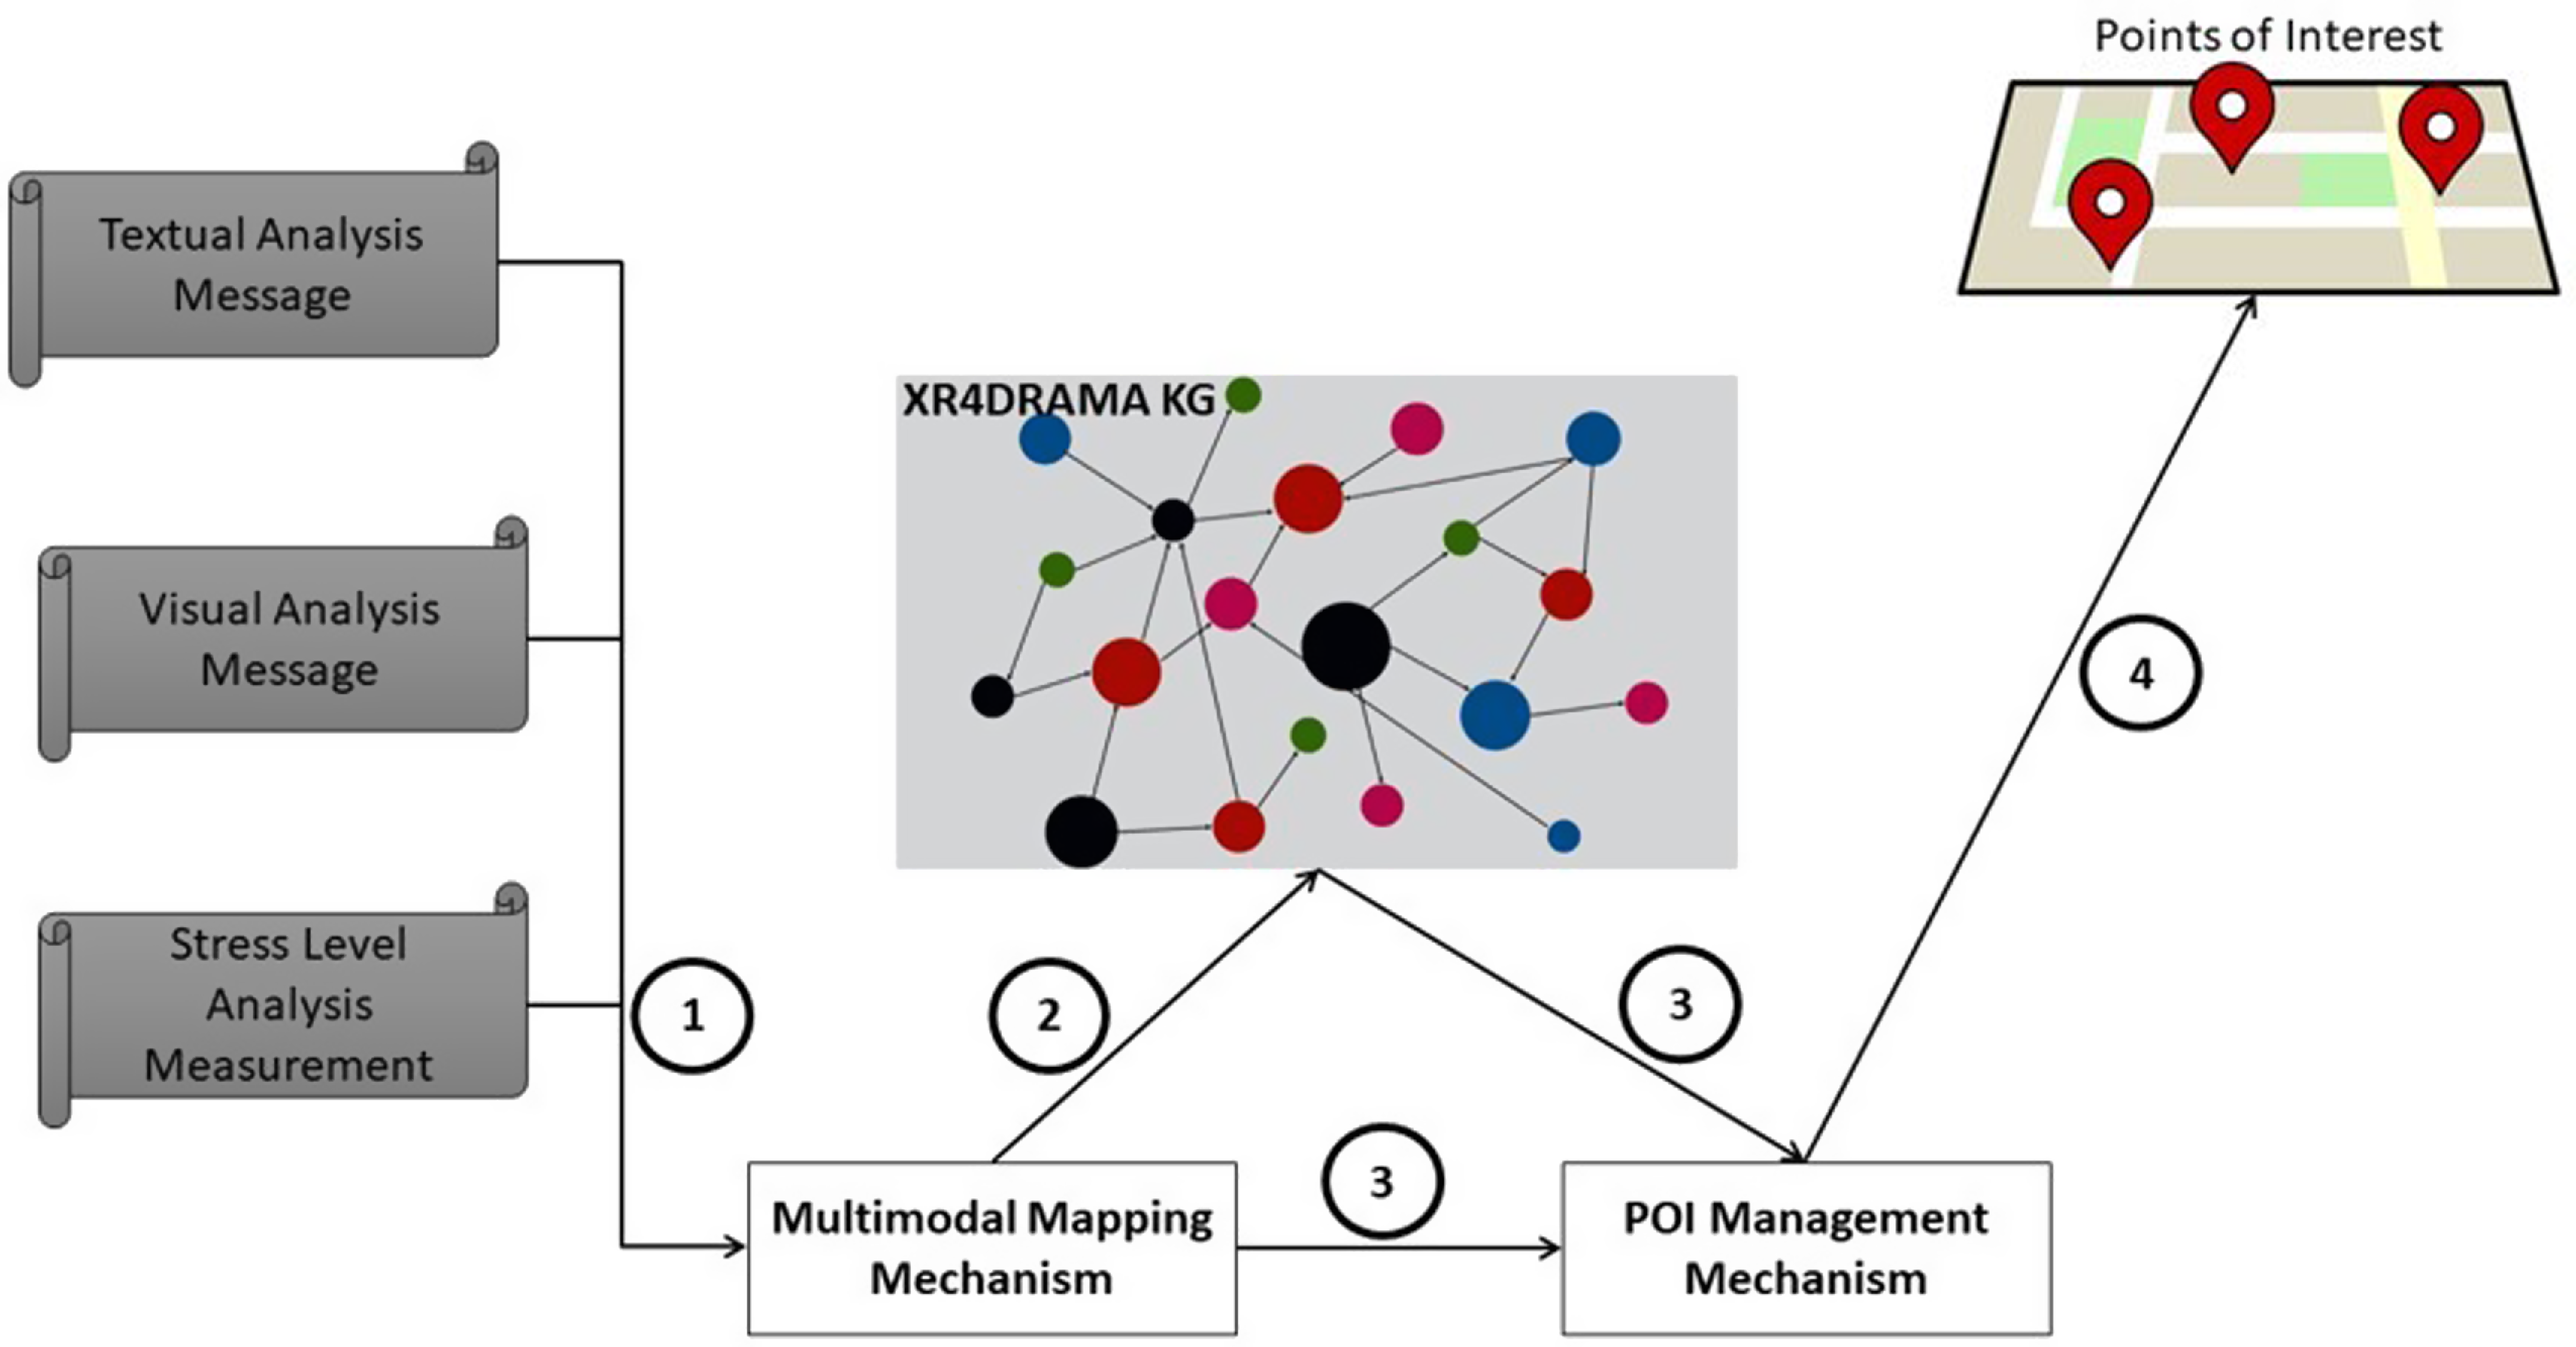
Figure 1. Pipeline of the XR4DRAMA framework.
On the other hand, regarding the pipeline of the KG which communicates with the DSS component, there are two functionalities. In the first one, the DSS will send information about tasks which need to be performed by first responders and citizens in a disaster management scenario, and the KG will attach them to specific POIs. These messages are triggered by external sensors. In our case, for the task creation mechanism we defined a use case where the water level of a river would be monitored, and the external sensors would triggered each time the water surpasses a specific level. In the case where the water level surpasses a specific level task would be attached to POIs. But also other emergency case scenarios can be considered. In the second one, the DSS will send a severity score which will be attached to an existing danger zone or a new danger zone which needs to be created. Figure 2 depicts how based on the messages of the DSS, the XR4DRAMA framework attaches tasks to POIs or creates/updates danger zones based on severity scores.
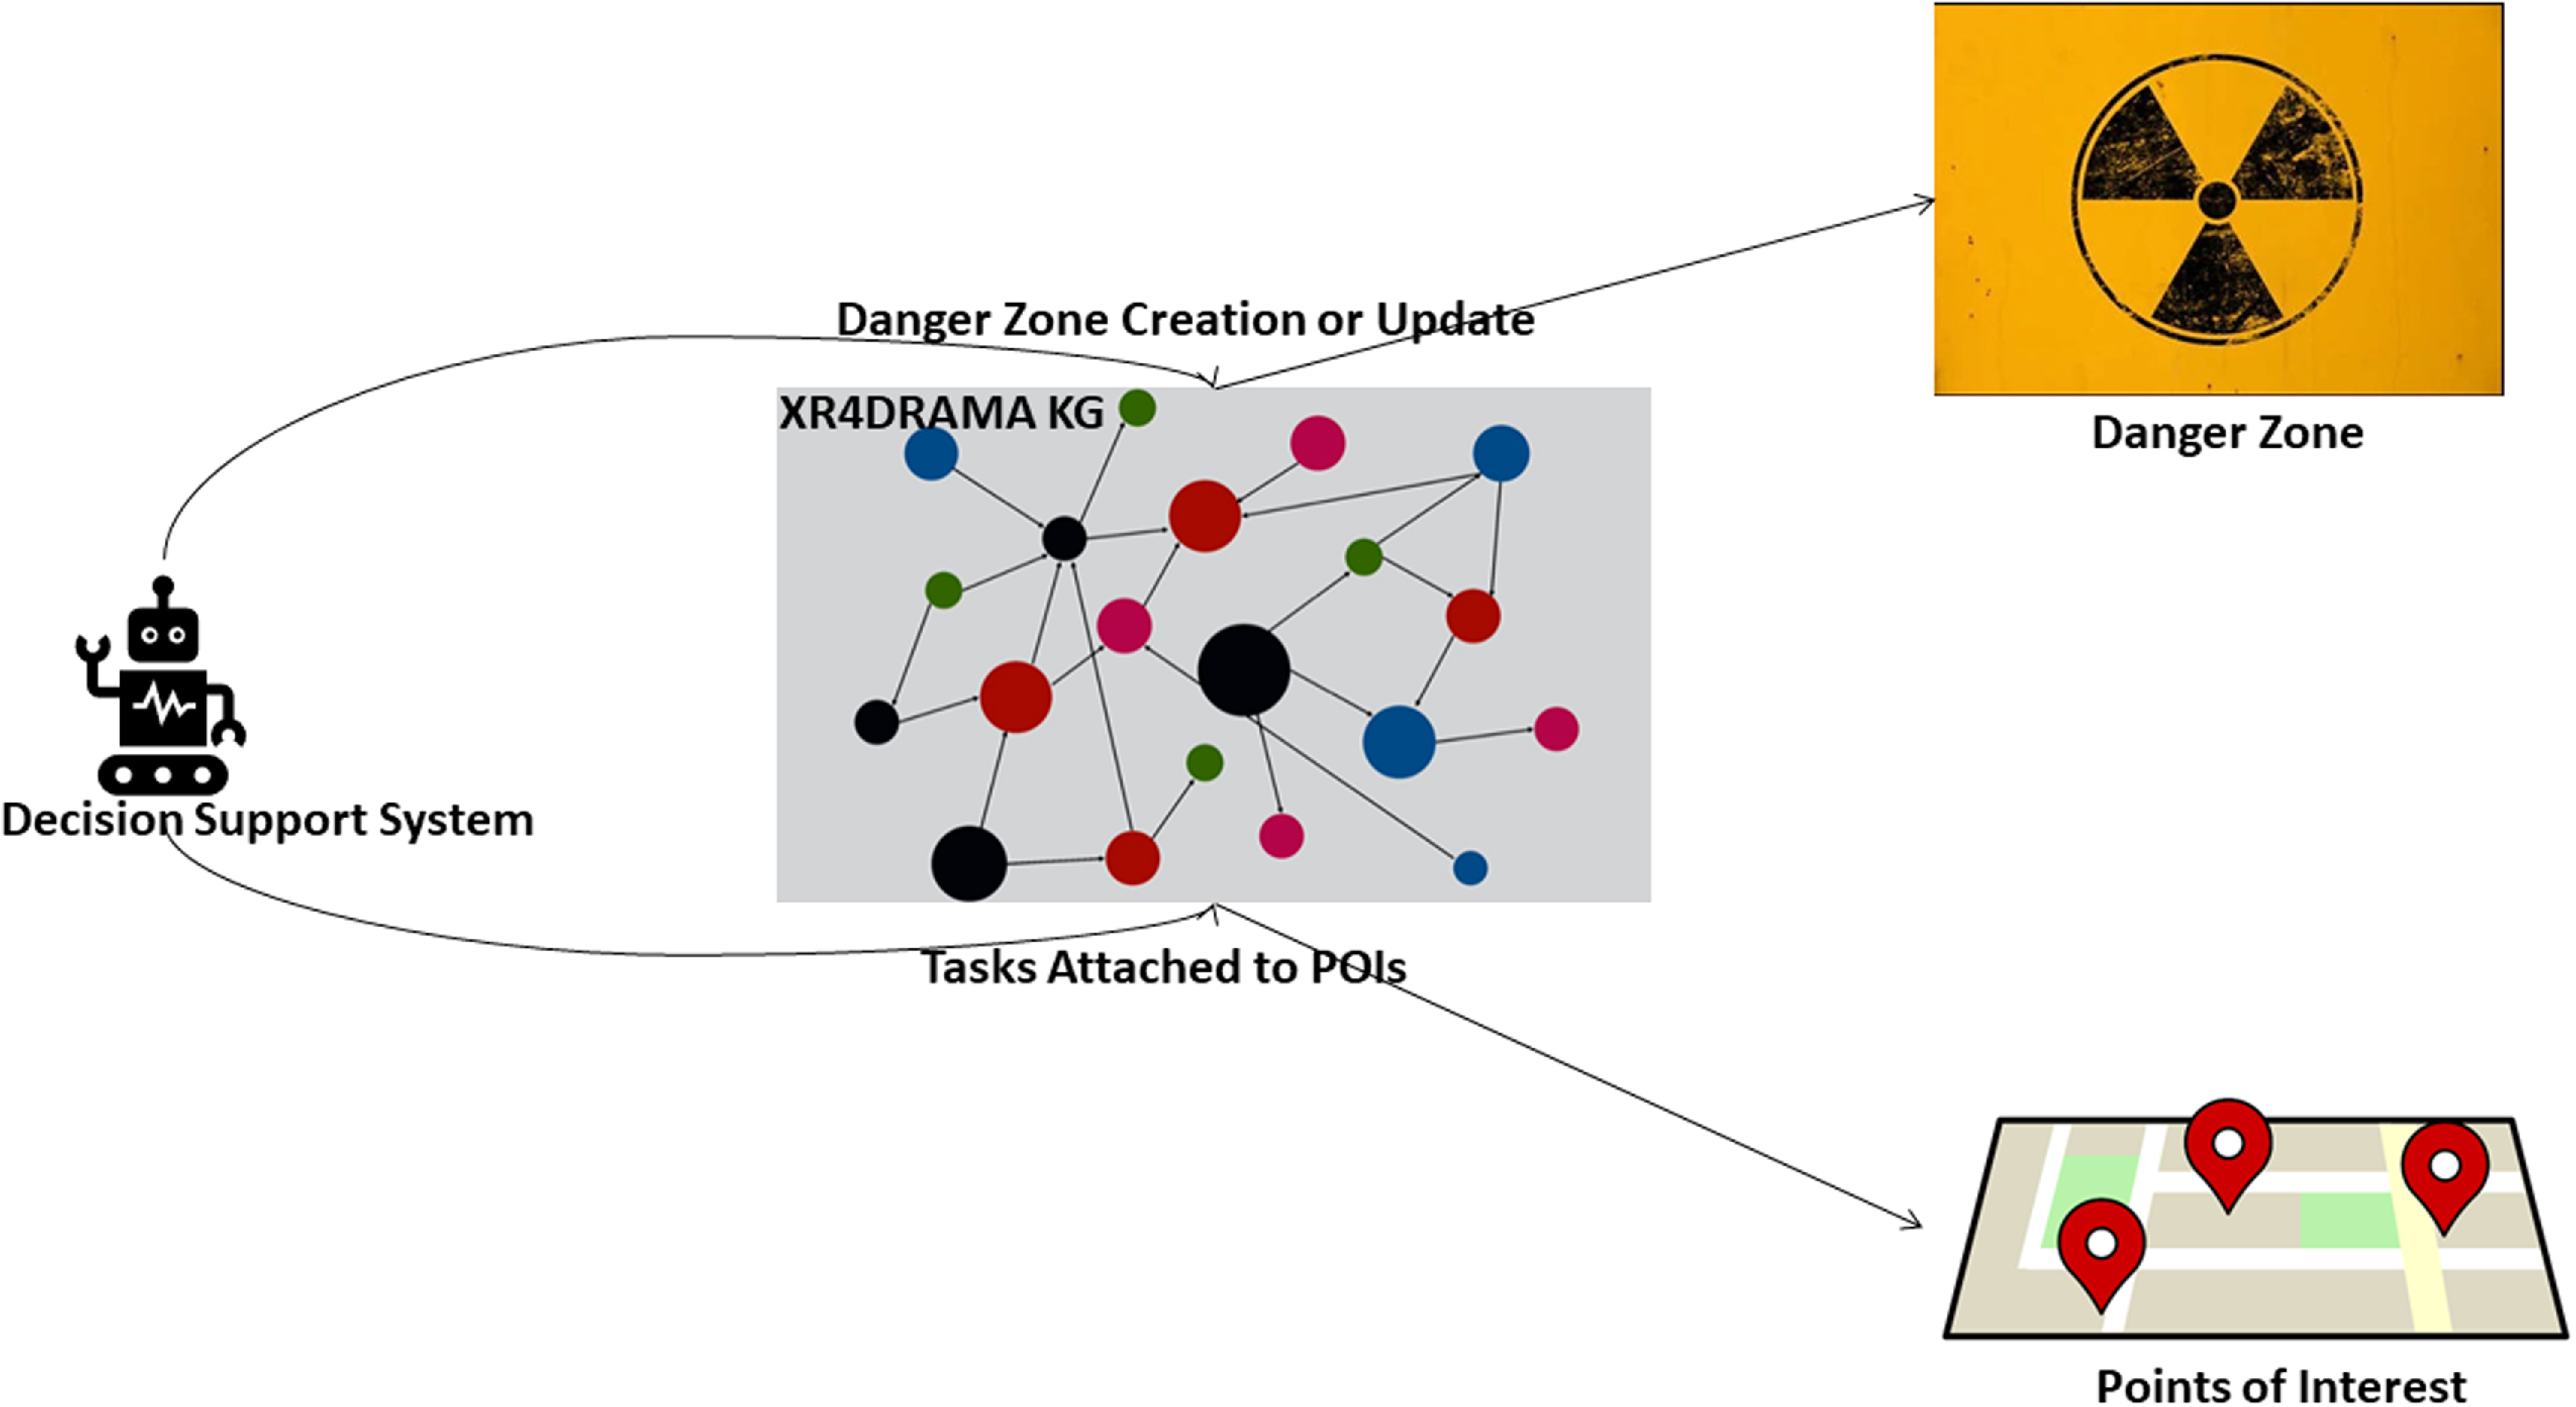
Figure 2. Pipeline of the XR4DRAMA framework concerning the DSS.
3.1. Nature of data
The multi-modality and variety of data flowing in the system and the necessity of homogenization and fusion mandated the adoption of a semantic knowledge graph to address the requirements of the project. The XR4DRAMA framework is not responsible for archiving and storing raw data files, since there is an underlying data storage facility for that purpose. Instead, the XR4DRAMA framework hosts metadata of raw data, analyses results and miscellaneous information to be mapped and fused into the knowledge base. The XR4DRAMA framework is accompanied with novel ontological models to achieve proper semantic annotation of the raw data.
The main categories of data needed to be captured in the XR4DRAMA framework were: physiological analysis, visual analysis, and textual analysis results and general information about virtual reality experiments.
The physiological signals were collected, in a controlled experiment oriented to the requirements of the project, which would detect the stress level of the subjects. The ultimate goal was to obtain and assess stress indicators directly from the skin of the subjects while experiencing different setups of the space. The analysis for these data was based on a rational [0, 1] space where values close to 0 expressed neutrality while values near 1 suggest high stress levels (Gollob et al., Reference Gollob, Kyrou, Petrantonakis and Kompatsiaris2022).
The visual analysis component consists of several machine learning (ML) models either trained from scratch or fine-tuned from other efforts. The model performing semantic segmentation (Qiu et al., Reference Qiu, Li, Liu and Huang2021) on images was trained to extract semantic labels and percentages per pixel on images while the Verge classifier (Andreadis et al., Reference Andreadis, Moumtzidou, Apostolidis, Gkountakos, Galanopoulos, Michail, Gialampoukidis, Vrochidis, Mezaris and Kompatsiaris2020) was deployed to classify the images (or video frames) to one or more classes based on context.
The analysis conducted on text was extensive, however, only few resulting assets were selected to be included in the XR4DRAMA framework due to the decision not to deep copy structures from a SOLR instanceFootnote 7 which do not serve any requirements. Such assets are: the text itself, the sentences which are contained in the text, and the named entity relations found within the text.
3.2. XR4DRAMA ontology scheme
In this subsection, we give a high-level overview of the KG schema’s structure (i.e., the XR4DRAMA ontology) and the guiding principles of each class. You can find the KG and the software developed to populate it here footnote 3. A high-level overview of the main XR4DRAMA ontology classes is shown in Figure 3.
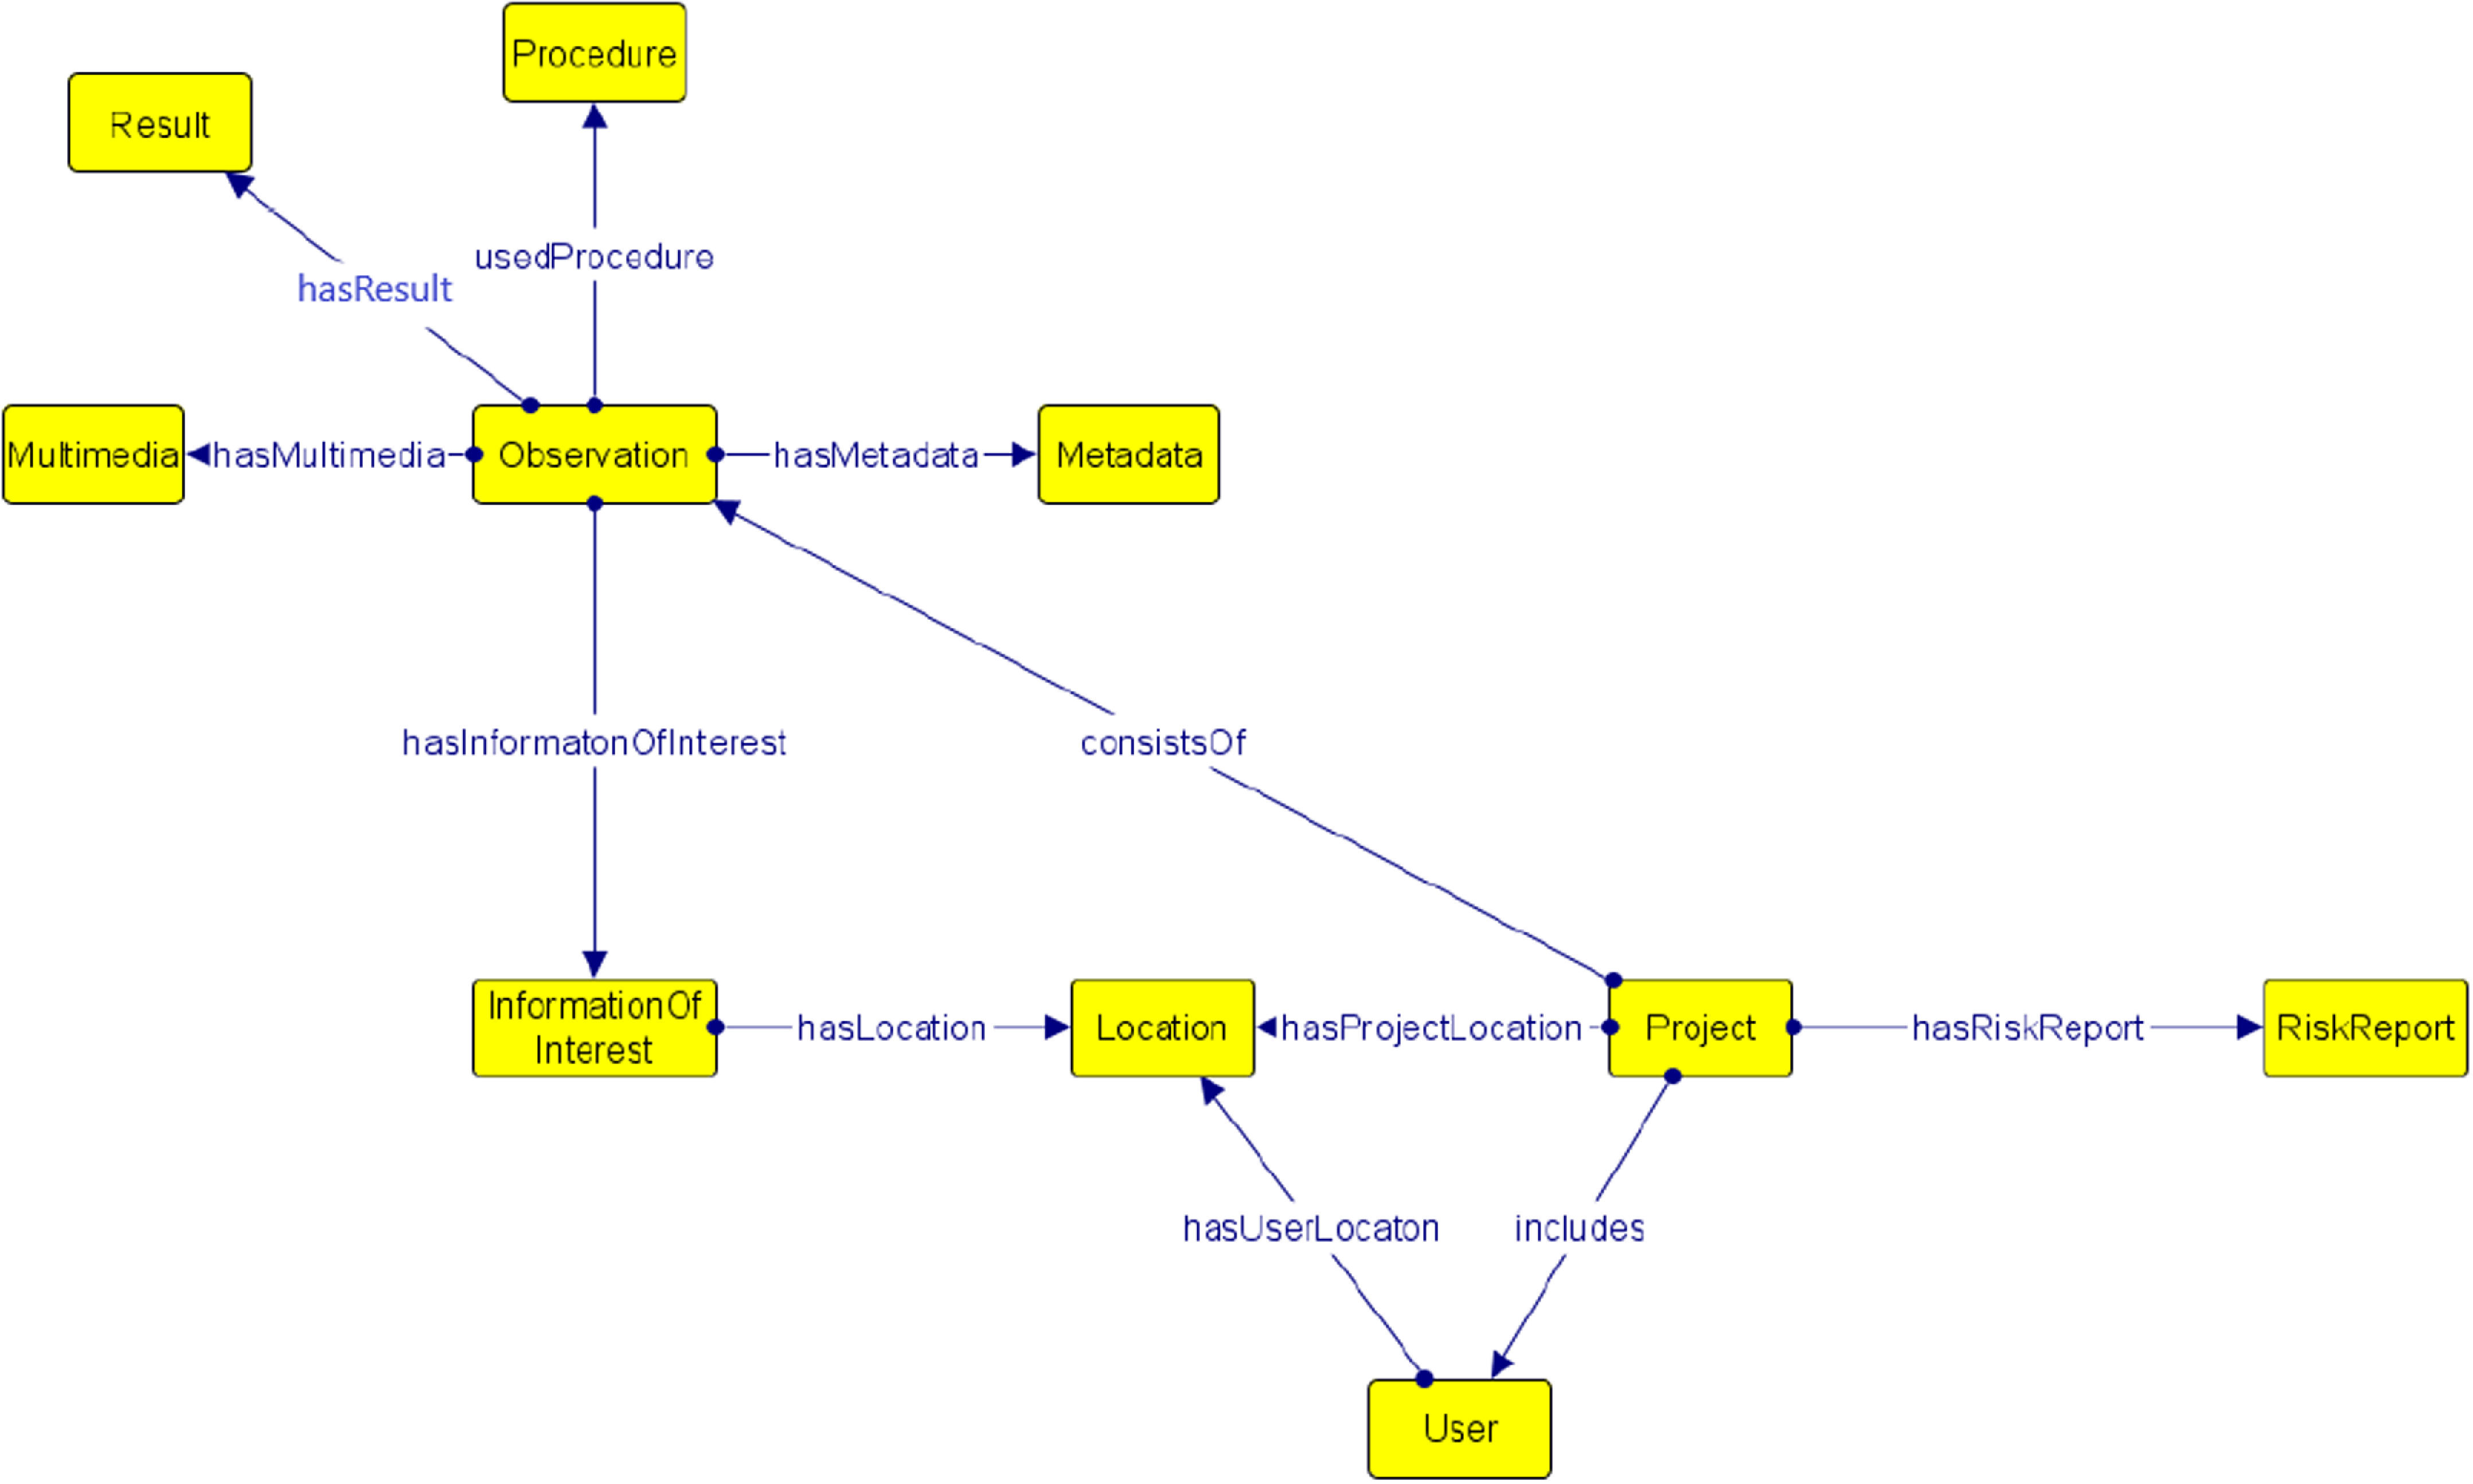
Figure 3. High level illustration of the XR4DRAMA’s framework KG.
The initial scheme of the ontology was based on the user requirements, and the competency questions (CQs) that the domain experts defined. So, a first version of the scheme was developed only from user interaction and knowledge from domain experts. Subsequently, we also took into consideration the information that was mapped inside the KG, meaning that after the structure and the content of the messages from the various component was defined, we restructured the scheme of the ontology in order to cover the extra information that needs to be represented.
-
InformationOfInterest: The fundamental entities of interest to aid in decision-making.
-
Location: The location of an event is represented by this class. It may be displayed with the location’s name or with its coordinates (e.g., Vicenza).
-
Metadata: All the supplementary data that is provided with the analysis results and can be used in the decision-making process is referred to as metadata.
-
MultimediaObject: Indicates the type of the transmission that is used to transfer information; it can be either Audio, Textual, or Video.
-
Observation: This class, which is utilized by each individual component, describes the method of assessing the date.
-
Result: This class represents information about the outcome of an observation.
-
Procedure: This class represents information about the procedures that should be taken during an observation (i.e., tasks that should be performed).
-
Project: A project is a set of observations.
-
RiskReport: This class describes the total outcome of all risk levels derived from various components. We added this class as some locations can be risky to access due to various reasons.
-
User: Users are journalists, first responders and citizens, and each journalist/first responder/citizen is given a unique ID.
We also analyze the purpose of the various object type properties, that is, properties that connect instances from one class with instances from another class.
-
hasMultimedia: This property identifies if the observation was provided via a textual, video, or image post.
-
hasResult: This property shows how the event in the observation turned out.
-
usedProcedure: This property identifies the method used to extract the information from the observation, such as whether the information was taken from the visual or textual analysis component.
-
hasInformationOfInterest: This property identifies the most important data in an observation, such as the type of scene, for example airfield, and the recognized objects, such as building, automobile, etc. Domain experts suggested what was deemed important information.
-
hasMetadata: This property indicates the metadata of the observation, based on the type of the observation, namely weather the observation is a result of the: (a) visual analysis component (see Table 1), or (b) textual analysis component (see Table 3).
-
hasLocation: This property shows where the important information in an observation is located. Notice that the location is specified using latitude and longitude.
-
consistsOf: This property lists the observations that make up a project. A project is a collection of observations with neighboring coordinates.
-
hasProjectLocation: This property indicates the location of the project.
-
includes: This property indicates the ID of the user that created the project.
-
hasUserLocation: This property indicates the location of the user.
-
hasRiskReport: This property indicates the risk level of the project, that is, if it is an emergency or not.
The subgraphs where the visual, textual, and stress level analysis messages are mapped in the KG of the XR4DRAMA framework, can be found in Figures 4, 5, and 6, respectively.
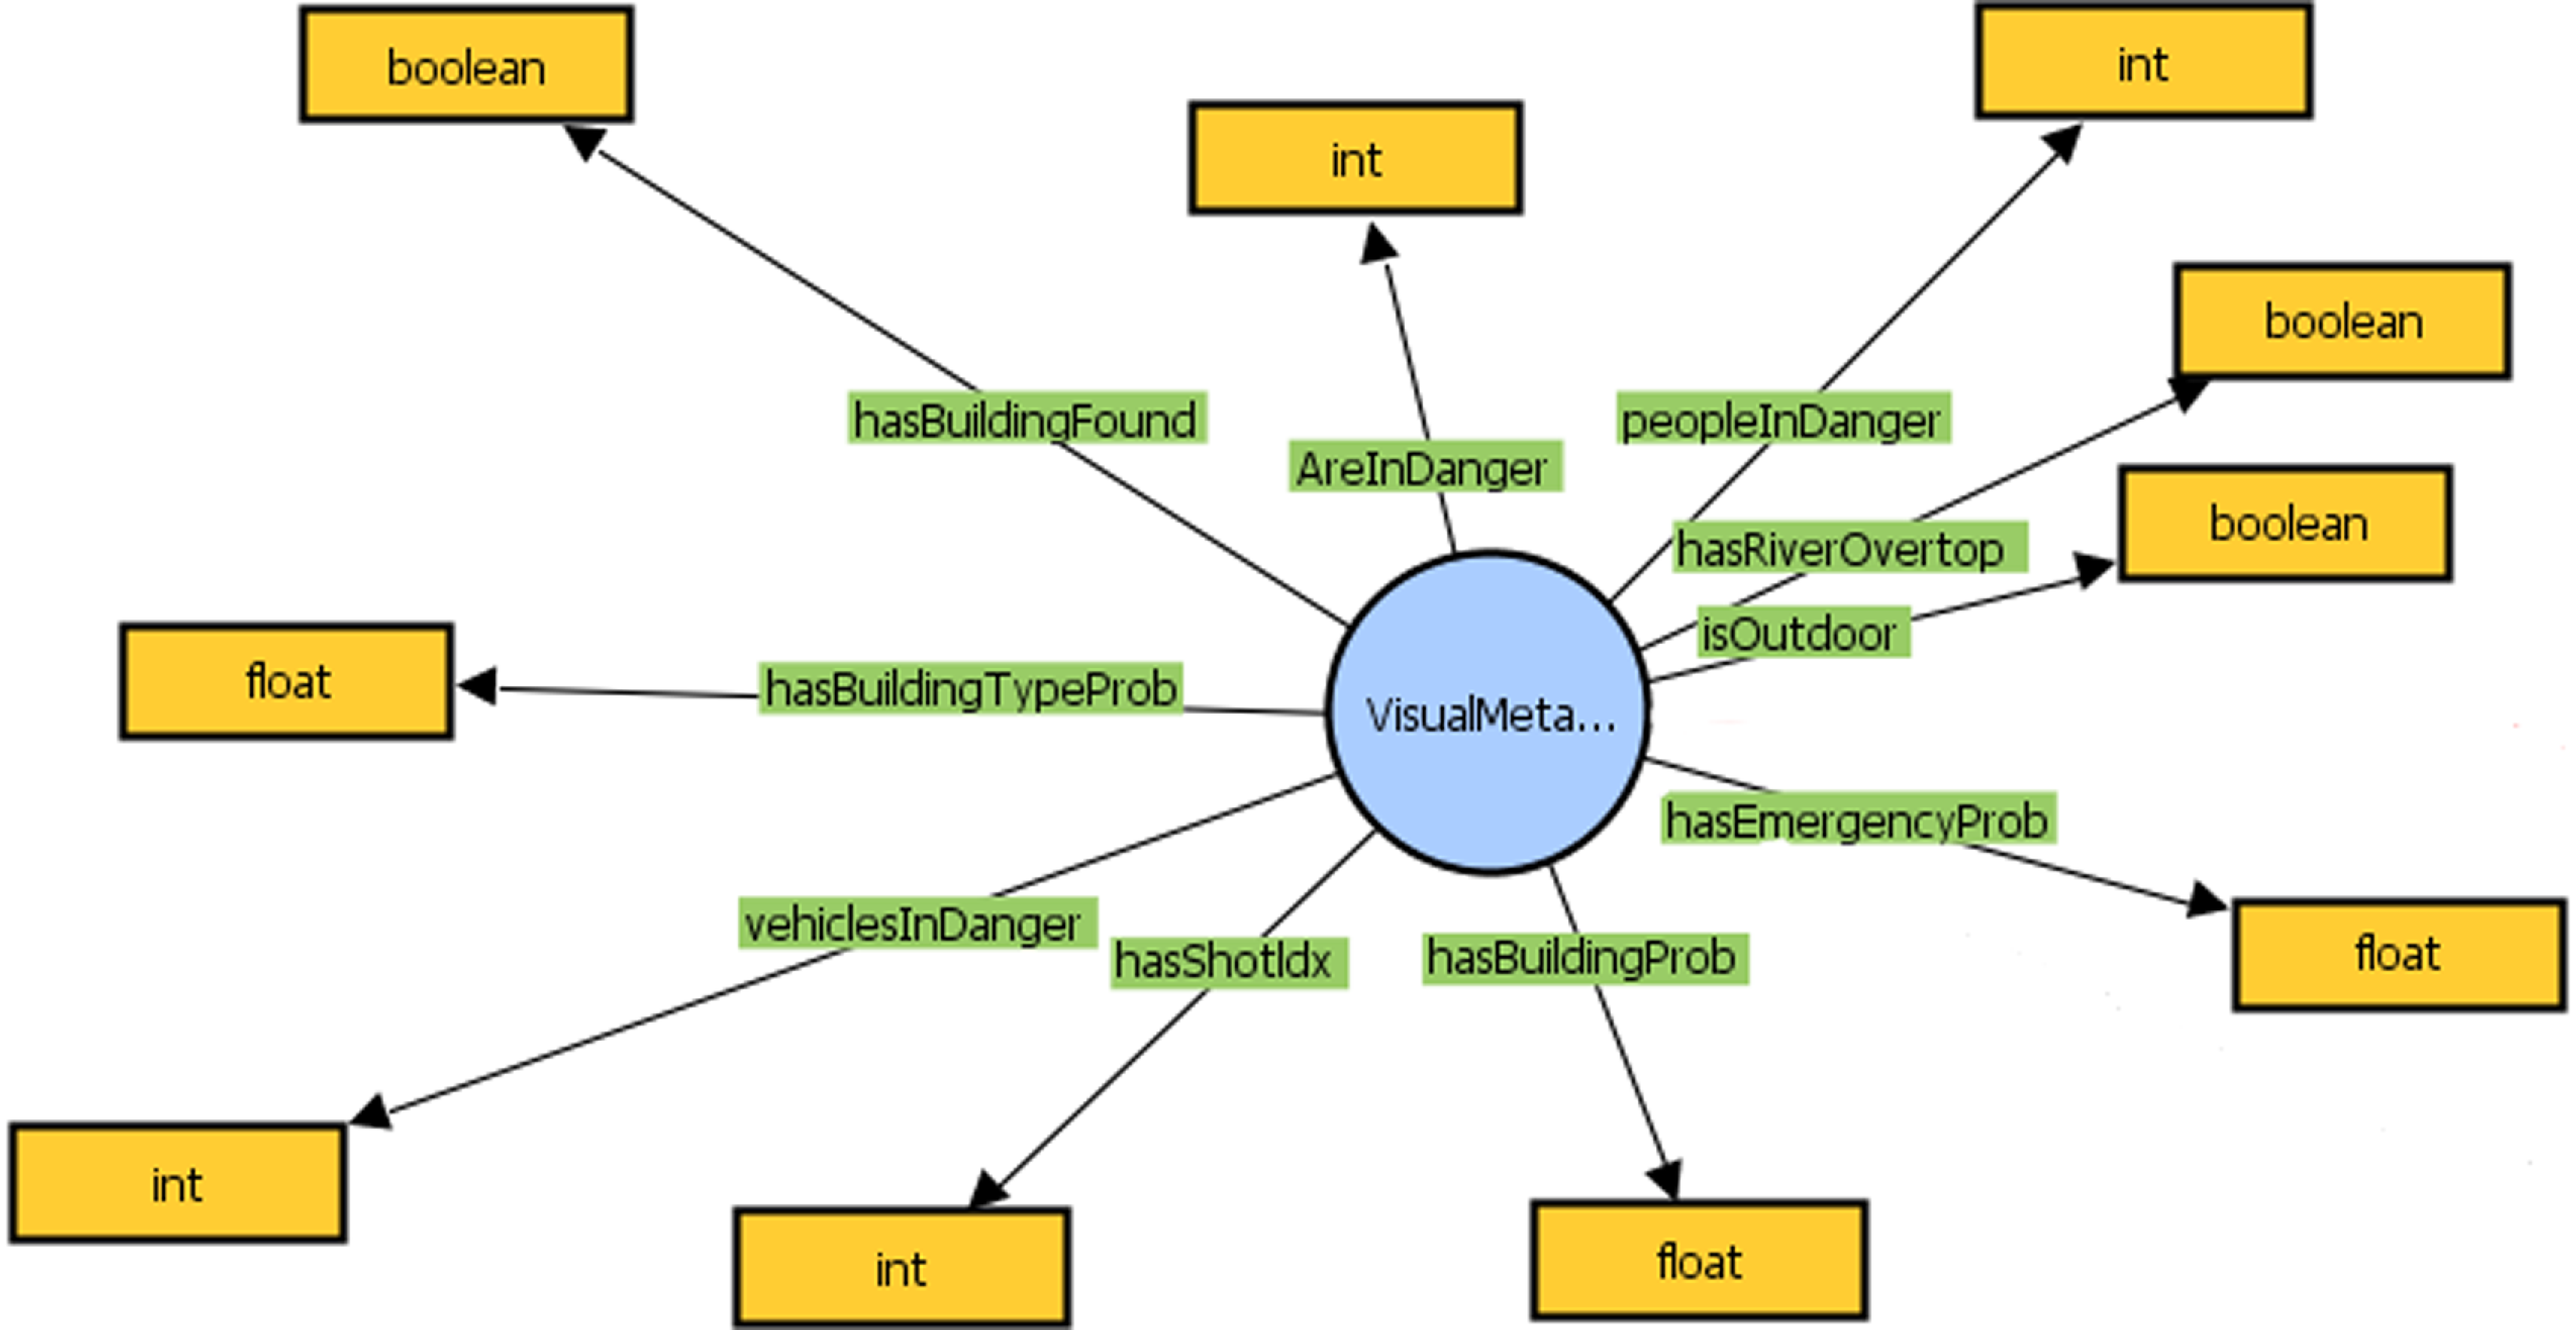
Figure 4. Subgraph of KG where the Visual Analysis message is mapped.
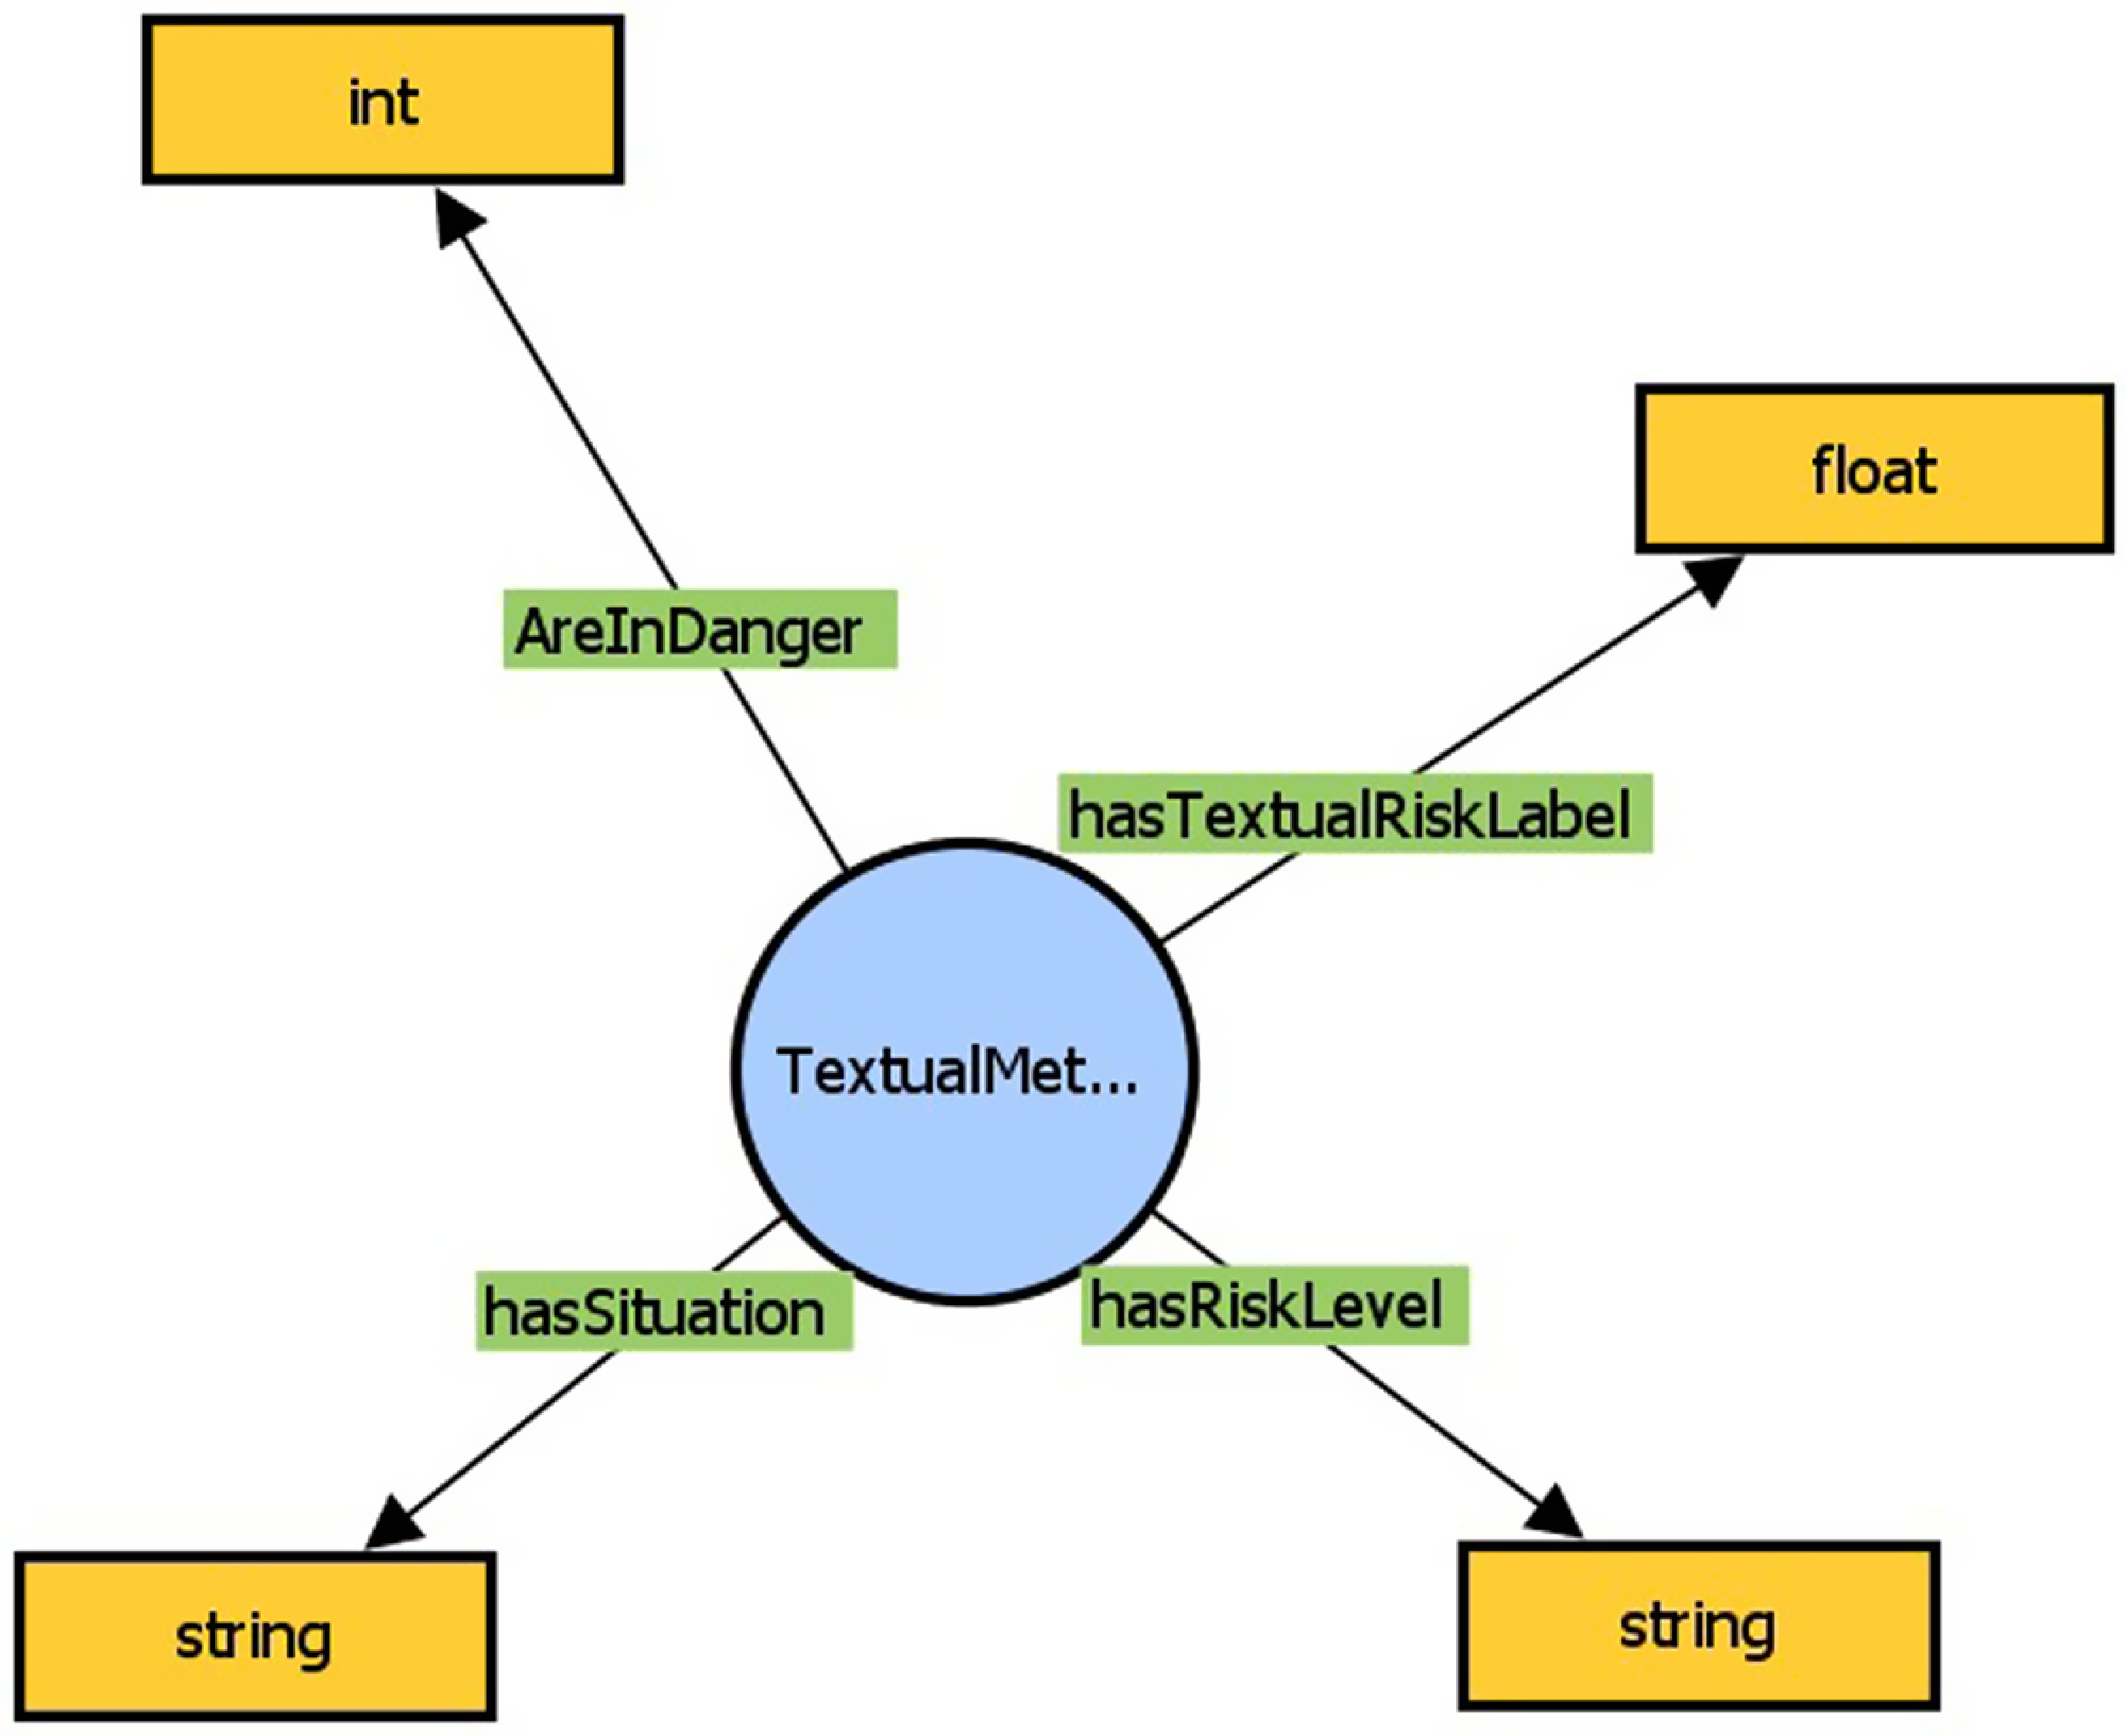
Figure 5. Subgraph of KG where the Textual Analysis message is mapped.
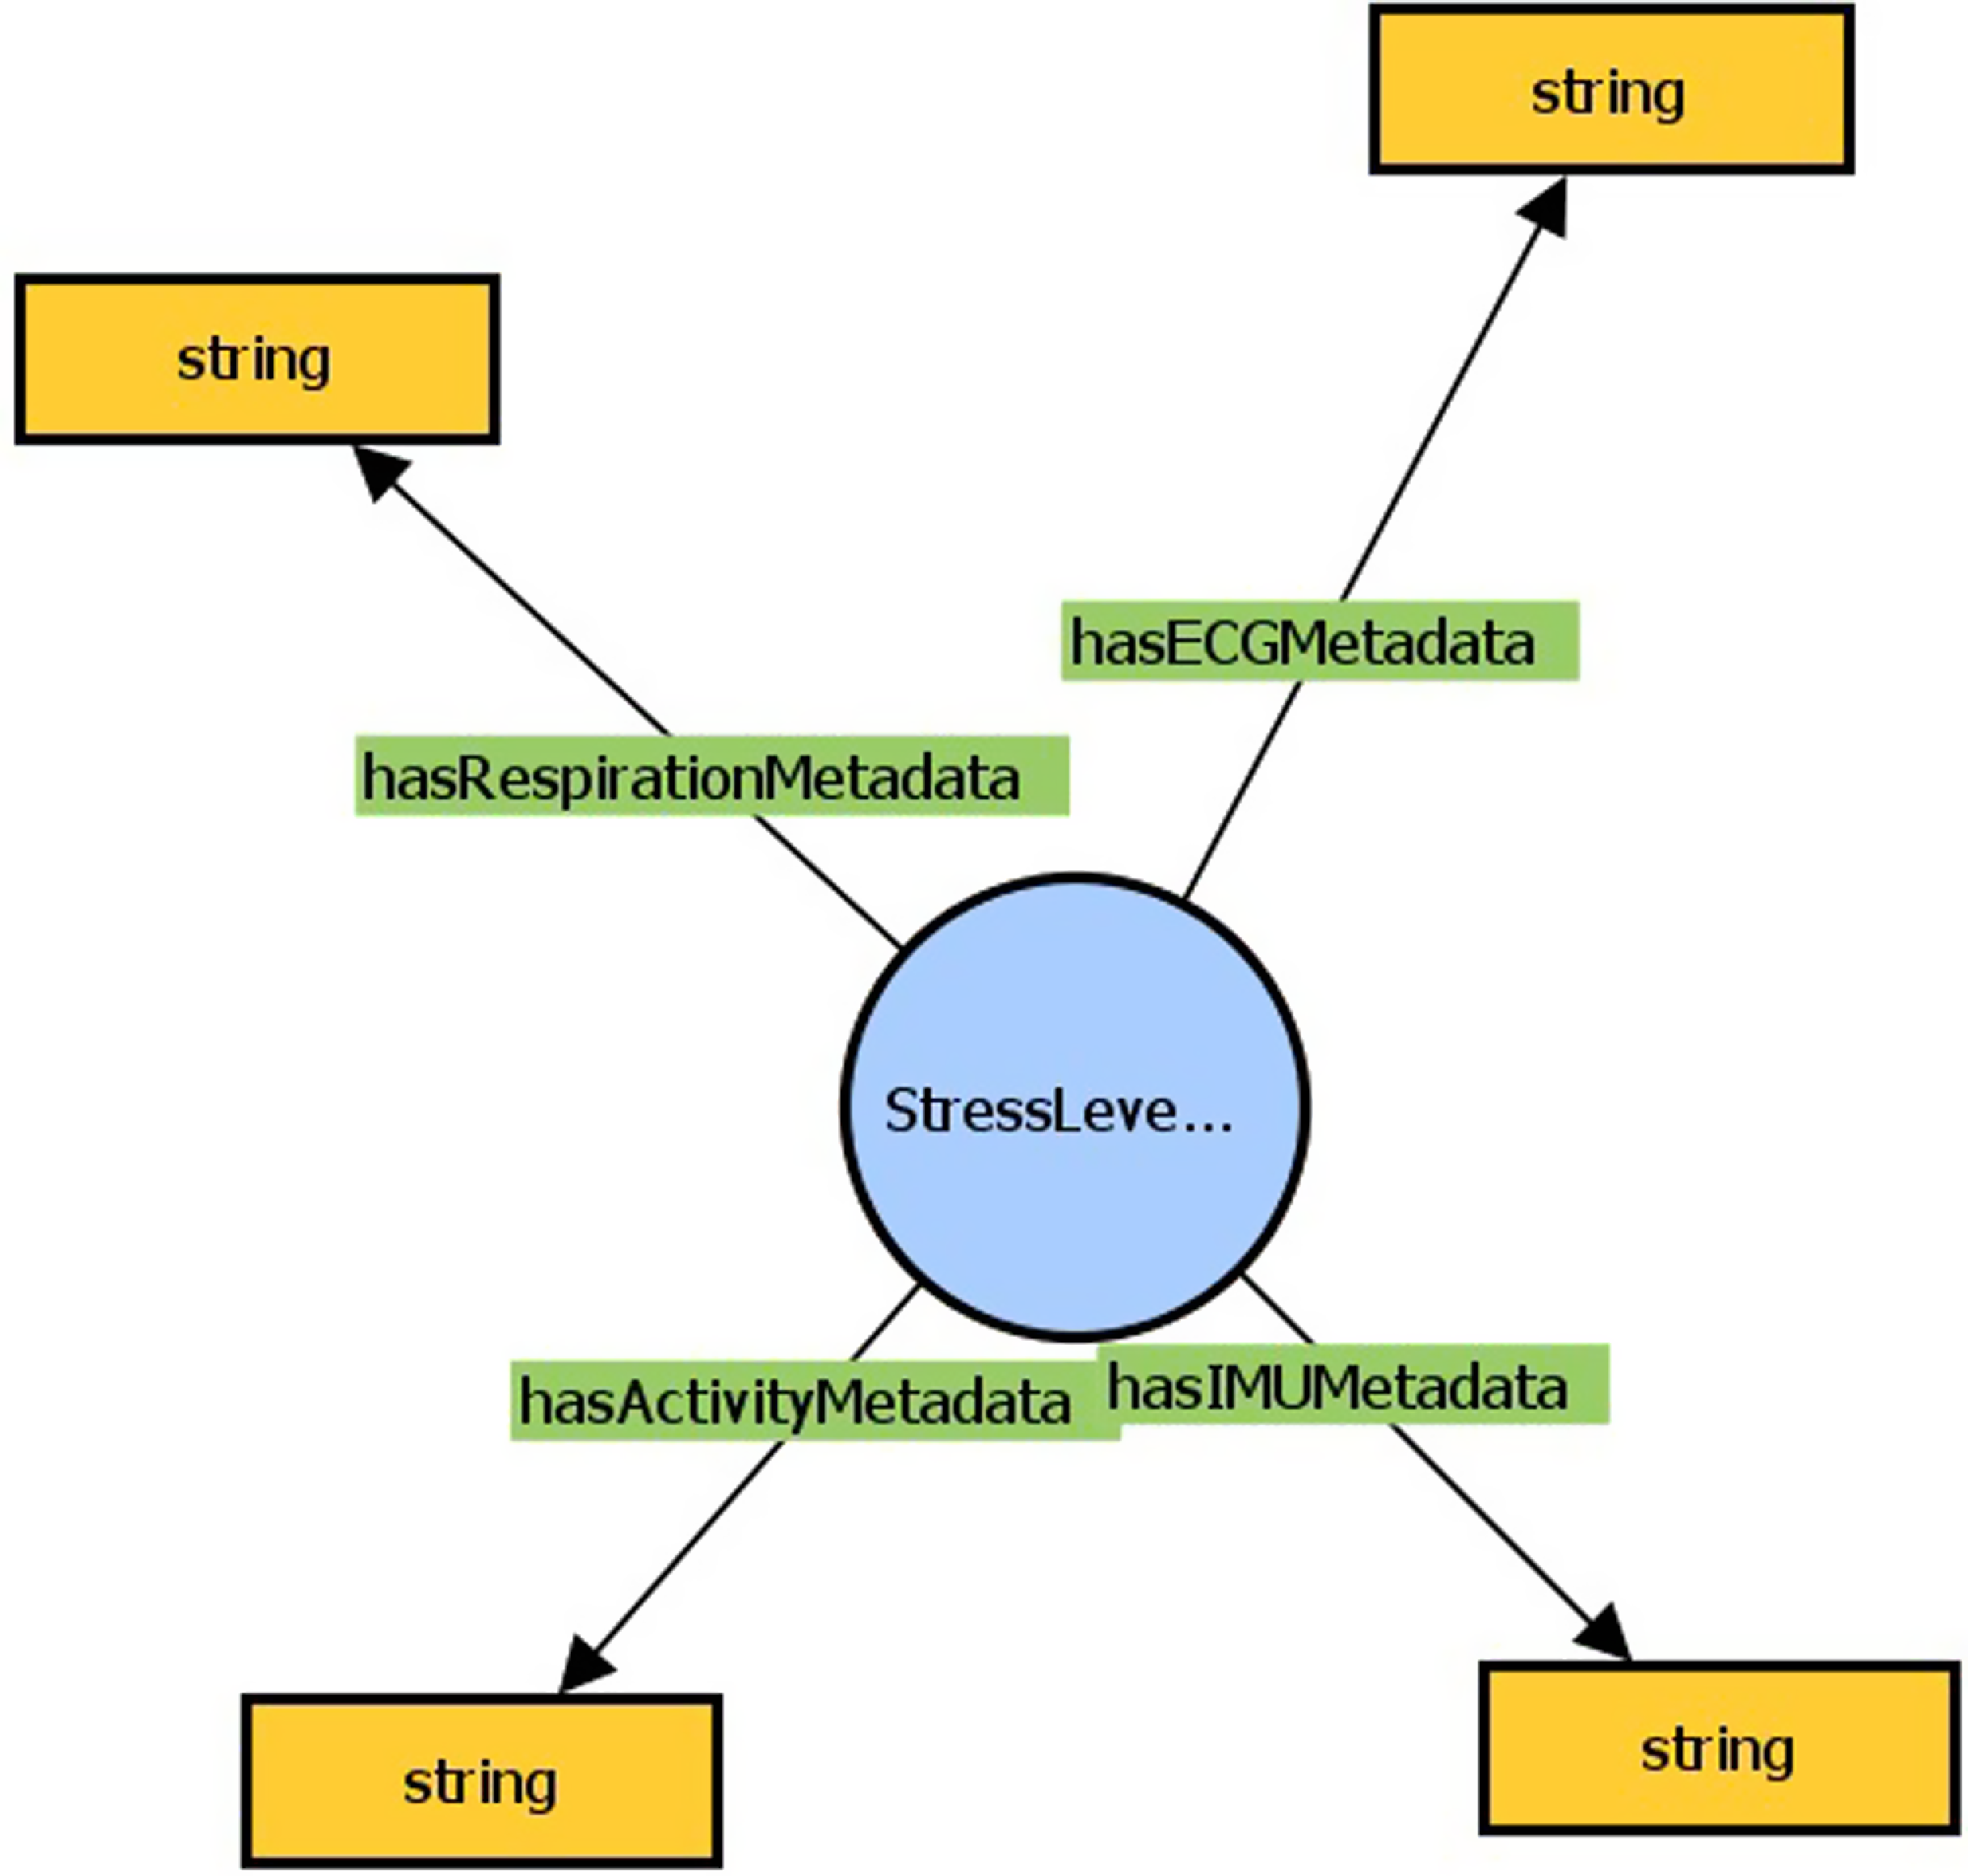
Figure 6. Subgraph of KG where the Stress Analysis message is mapped.
3.3. Points of interest management mechanism
The idea behind POIs is to create some points in an area (i.e., pins on a map) that contain crucial geospatial information, that could ease the work of first responders, and help citizens to avoid an emergency. POIs can be created or updated by any user through a phone application (which is not currently public). The user can either send an image/video which will then be analyzed by the visual analysis component, and some of the crucial information in the image/video will be then passed to a new or already existing POI, or a textual message; the pipeline for a textual message is similar. Notice that in Figure 1, we also show that the POIs receive information from the KG. Here we analyze only the information from the messages, as the information from the KG refers to some IDs that relate to the projects and the observations (see Section 3.2).
The creation of a POI is easily understandable, as if no POIs exist in the area a new one needs to be created, if an emergency occurred. On the other hand, the update of POIs is performed when other POI(s) already exist in the area, and some information in them needs to be updated, as the state of the emergency has changed. For instance, a flood affected more buildings. Below we analyze the information from a visual message that is passed to a POI when is created (see Table 1) or updated (see Table 2).
One can notice that when a POI is created the information passed from the visual analysis messages are: (i) how many people are in danger, (ii) how many vehicles are in danger, (iii) how many animals are in danger, (iv) what infrastructure was affected, (v) what objects are affected, (vi) the type of emergency, and if the emergency is a flood (vii) if a river has overflown. The aforementioned data can be dynamic, meaning that even if some are missing, the POI will still be created. Moreover, the current_user is the name of the user who sends the message, the category and subcategory characterize the area which was affected; in our running example a Education area, and more specifically, a University was affected. Finally, the coordinates are also provided in the format: [longitude, latitude]. The necessary data is the current_user, the category, the subcategory, and the coordinates. On the other hand, if a POI already exists only some information can be updated. The data which can be updated are: (i–vii).
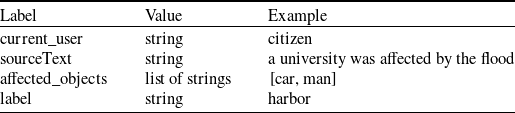
We also analyze the information from a textual message that is passed to a POI when is created (see Table 3) or updated (see Table 4).
Table 1. Information passed from a visual message to a POI when created
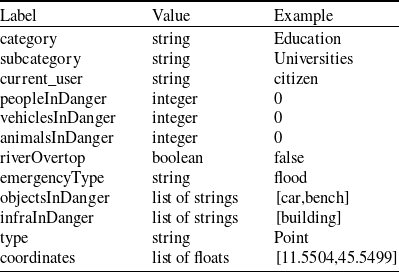
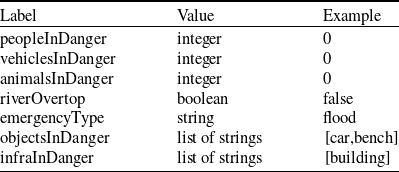
Table 2. Information passed from a visual message to a POI when updated
Similarly when a POI is created the information passed from the textual analysis messages are: (i) which are the affected objects, (ii) an auxiliary label that characterizes the location, and (iii) the source text of the textual message. The aforementioned data can be dynamic, meaning that even if some are missing the POI will still be created. The necessary data is the current_user, the category, the subcategory, and the coordinates. On the other hand, if a POI already exists only some information can be updated. The data which can be updated are: (i-iii).
Table 3. Information passed from a textual message to a POI when created
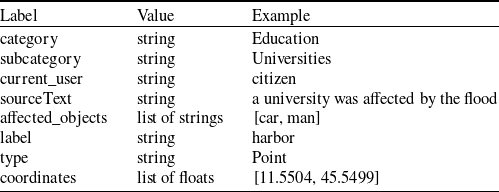
Table 4. Information passed from a textual message to a POI when updated
3.4. Decision support system
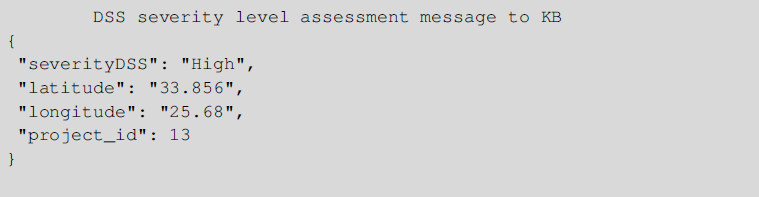
One of the main goals of the DSS is to generate the severity level (SL) of a POI by fusing the information that is available to the KG, either via the Textual or the Visual Analysis outcomes. The severity score is then used from the KG to create or update the situational picture of a danger zone containing that POI. A ML approach was used in order to assess the current severity of a situation, with slight differences depending on the type of message that the DSS receives from the KB, namely Visual (2), Textual (3), simultaneously or independently.
For the Visual Analysis messages, a ML approach was developed in order to assess the weights of every category that was detected from the Visual module in an intelligent way. Using the results produced by the analysis of example frames of videos with flood scenarios by the Visual Analysis module we created an annotated dataset with 96 entries. The dataset was provided by the Alto Adriatico Water Authority (AAWA)Footnote 8, which provided us with water level measurements, from various locations along the length of the Bacchiglione river in Vicenza. That dataset was then used to train and test four well-known ML algorithms, namely the Ridge Regression Classifier (RRC), the Support Vector Machine (SVM), the Random Forest (RF) Classifier and the Decision Tree (DT) Classifier looking for the best possible accuracy score. Then, the best performing model was integrated into the DSS framework and by its interaction with the KG, the updated values of the SL of a POI can be inferred (Figure 7), see also the Accuracy Score of each model in Section 4.3. When a Visual Analysis message is generated, the KG sends the vital information the DSS needs to assess the SL of the event in real time. An example message can be seen below.
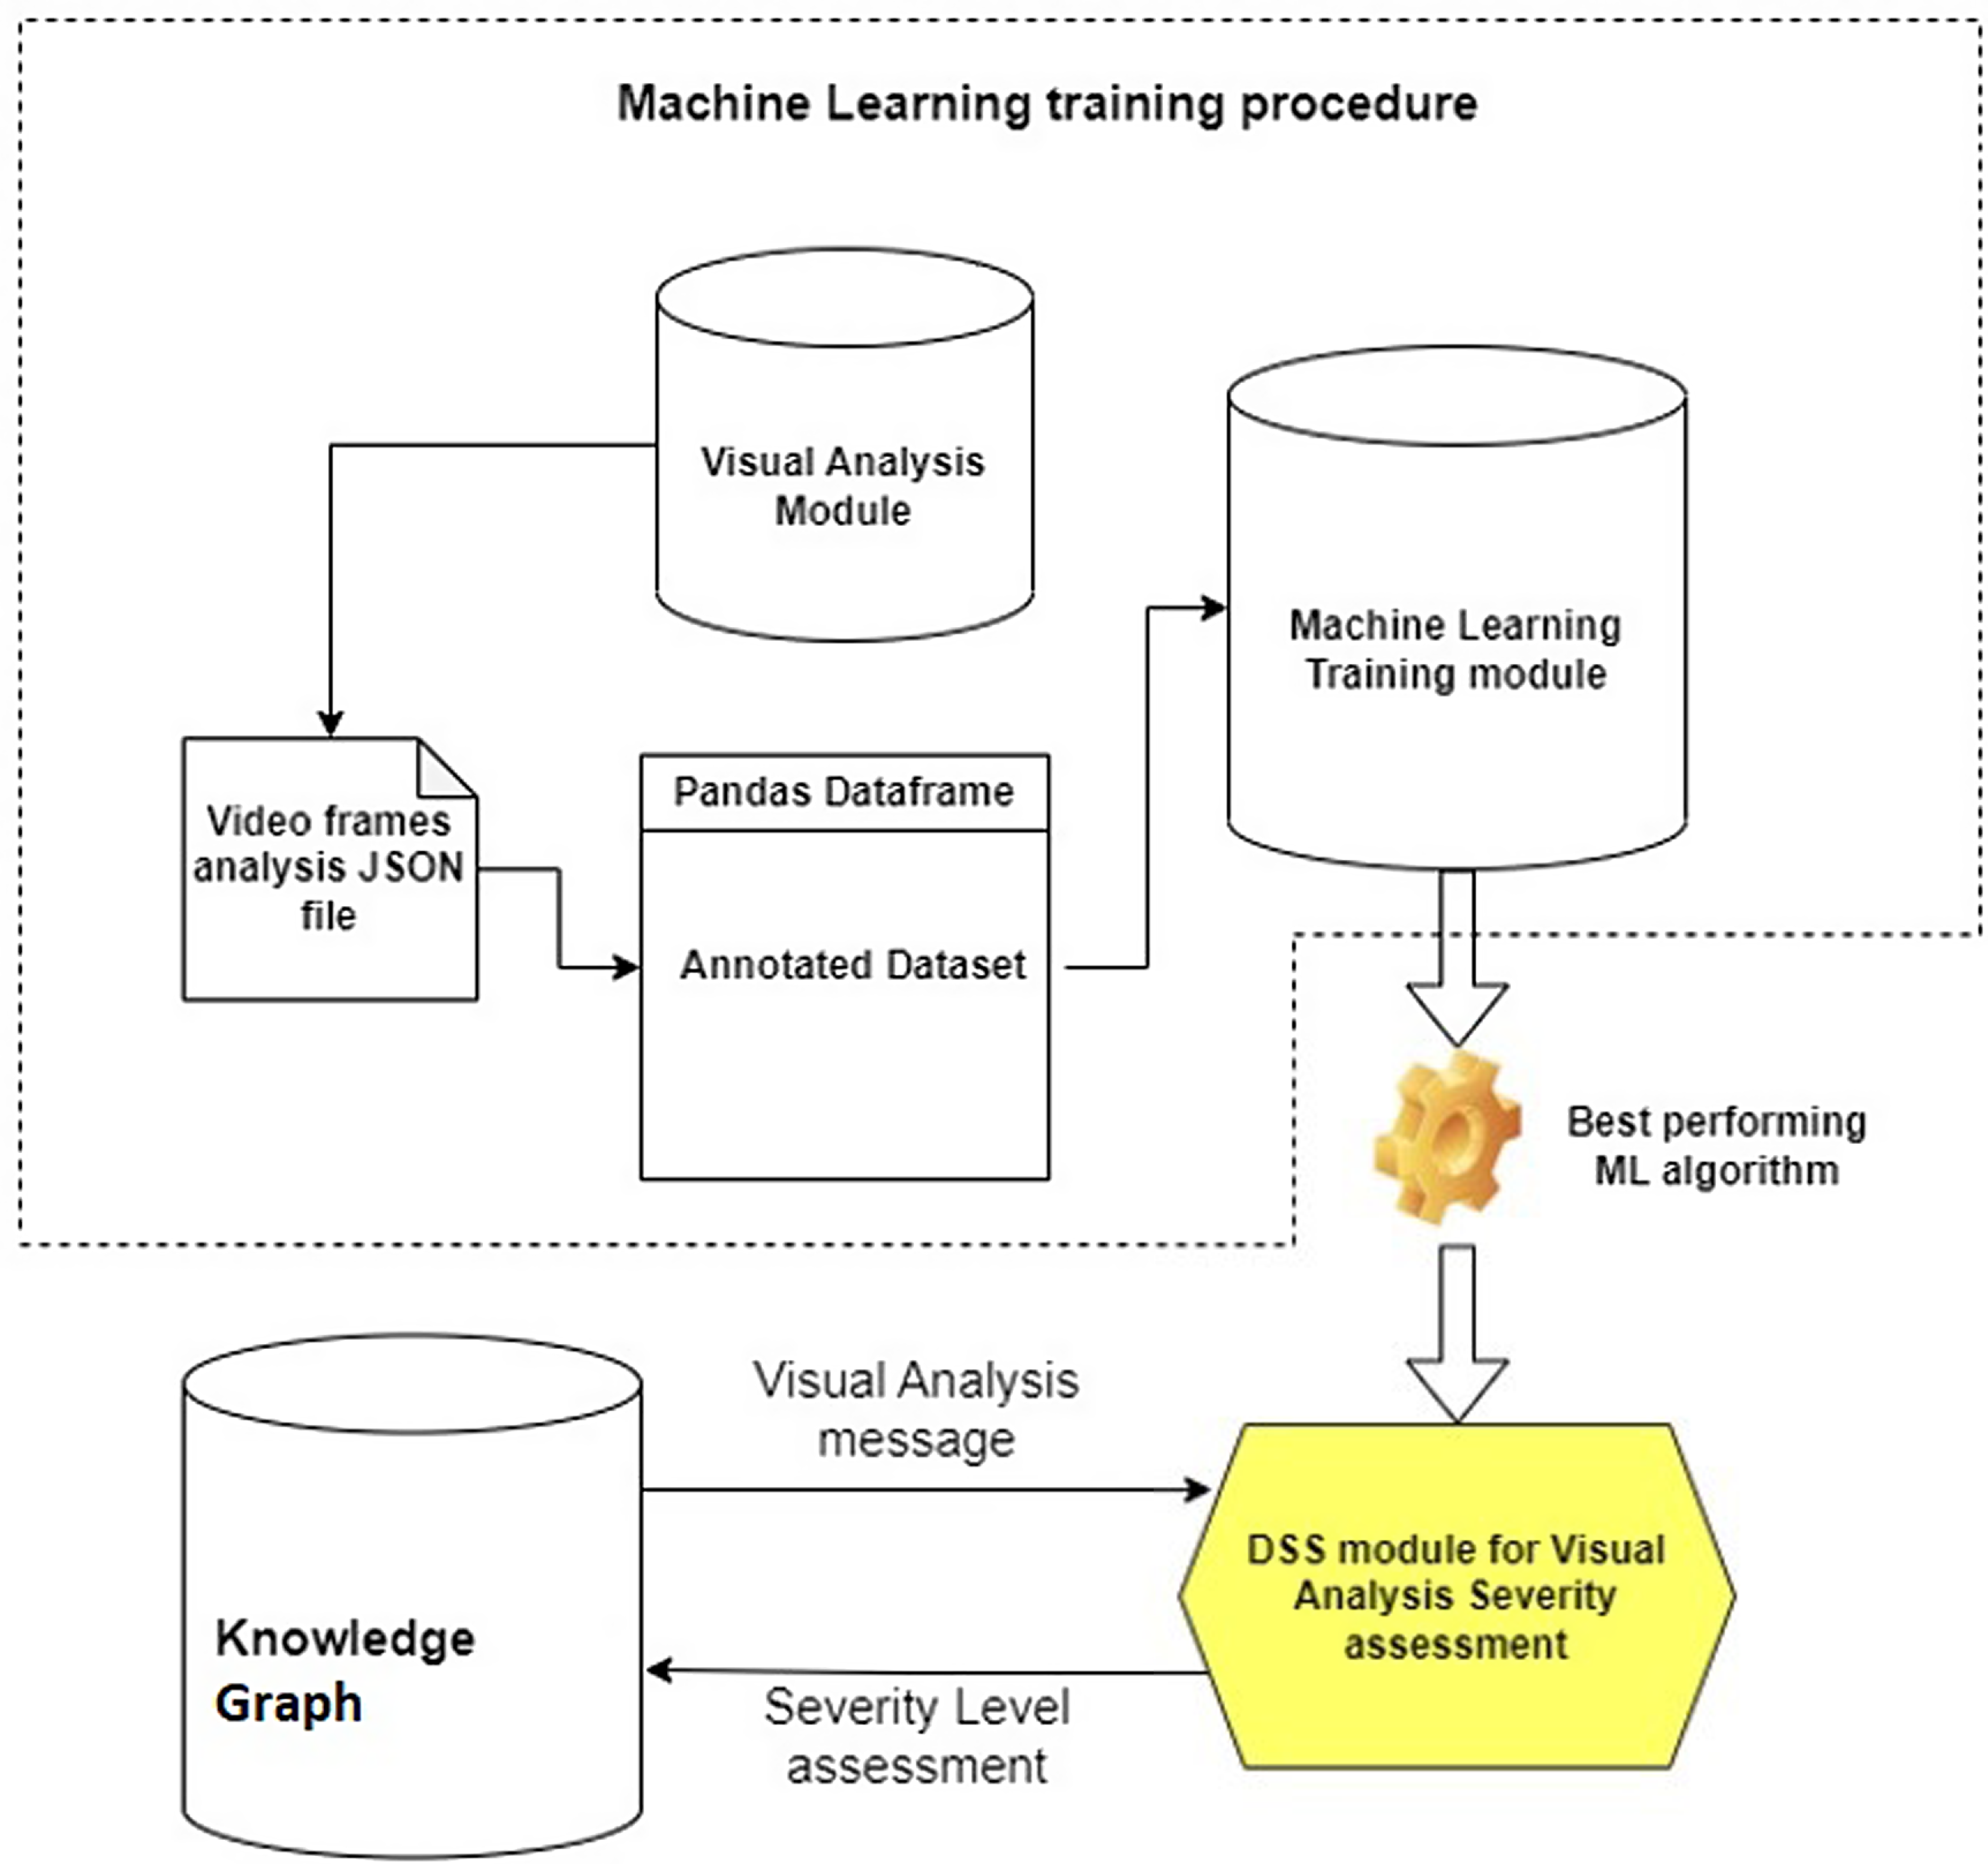
Figure 7. Machine Learning module development and KG interactions.
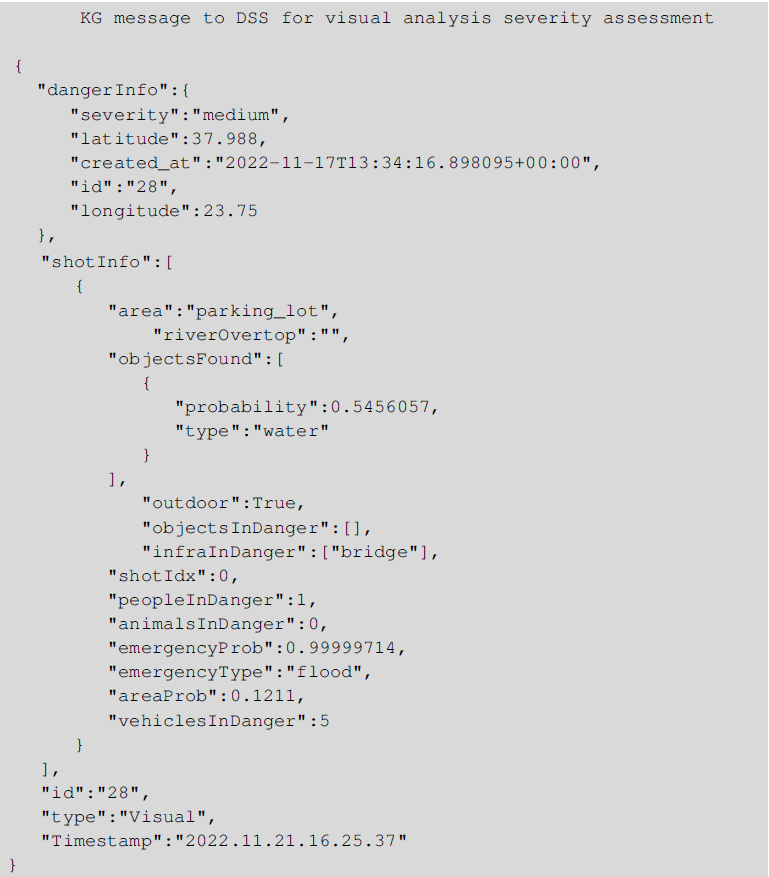
Using the information contained in that message, DSS is able to use the pretrained ML model in order to predict the SL of the current situation. Then, DSS generates a message for the KG with the total SL (‘Low’, ‘Medium’, ‘High’, ‘Very High’), the geolocation and the id of the current POI, as can be seen by the following example.
For the Textual Analysis messages, a similar approach was followed. Specifically, a ML method that takes into account the specific type of data sent by the KG to the DSS module has been developed as well. When a textual message is generated, KG communicates that information to DSS in real time. The following message is an example of such a textual message.
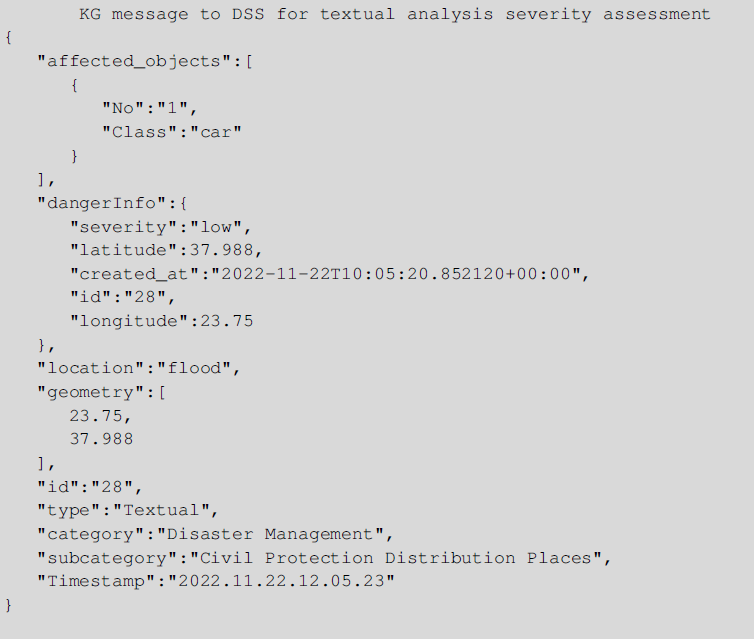
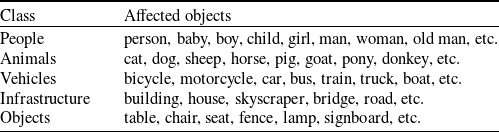
In order to train a ML model able to predict the SL of an ongoing situation given the above information, a dataset was created with random possible flood or no flood scenarios. In those scenarios, random affected objects representing real-life crisis situations were present, along with the number of each type. In order to train the ML algorithm each affected object was categorized into five greater classes: People, Animals, Vehicles, Objects, and Infrastructure (Table 5). These are the classes that are used during the prediction phase of the module, too. The event that is categorized as a “flood” or not, or the previous “severity” level of the current POI (if existing) are parameters taken into consideration in the final assessment of the situational picture too. The same four ML algorithms as in the Visual Analysis DSS module (LR, SVM, RF, DT) were used for the training procedure. The model with the best accuracy score was then integrated into the DSS framework, in order to be able to interact and update the values of the SL of the Knowledge Base. Figure 7 represents the same procedure followed in the development of the Textual Analysis DSS sub-module, too, just using a different annotated dataset during the training process.
Table 5. General Classes for affected objects
When a Textual Analysis message is generated, the available data are communicated by the KG to the DSS module. Then DSS, after classifying each affected object and taking account of the whole situational picture, generates the predicted SL of the current situation. A message is then sent to the KG using the same format and the same SL classification categories as in the visual analysis.
3.5. Danger zone creation or update
In this section we present how the danger zones are updated or created based on the severity score received from the DSS. There are three different scenarios, which we analyze in detail, that the XR4DRAMA framework considers when it receives a severity score from the DSS. The message received from the DSS, in all scenarios, has the following form.
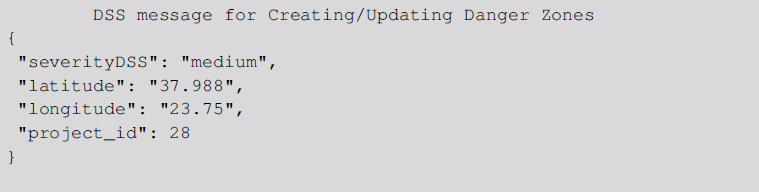
The label severityDSS can take four discrete values which indicate the SL level of a location (‘Low’, ‘Medium’, ‘High’, ‘Very High’). The latitude and longitude indicate the location that the severity score refers to, and the project_id is a unique identifier for the broader area that the location in the messages belongs into. In the first scenario no danger zones exist in the area surrounding the point (i.e., latitude-longitude) that is contained in the message. In this case a new danger zone will be created that will be assigned the severity which is contained in the message. The danger zone is a bounding box which is created based on the latitude and longitude that exist in the DSS message, based on the following function: (latitude - 0.001 longitude - 0.001 latitude + 0.001 longitude + 0.001).
In the second scenario, a danger zone already exists in the area. If the severity score is ‘Low’ then we do not make any changes in the old danger zone.
In the third scenario, a danger zone already exists in the area. If the severity score is ‘Medium’, ‘High’, or ‘Very High’ then we apply some changes to the old danger zone following the next rules. If the new danger zone is totally contained in the old, then the area remains as it is, but if the new danger zone is not totally contained in the old danger zone, we will merge the area of the two danger zones (see Figure 8).
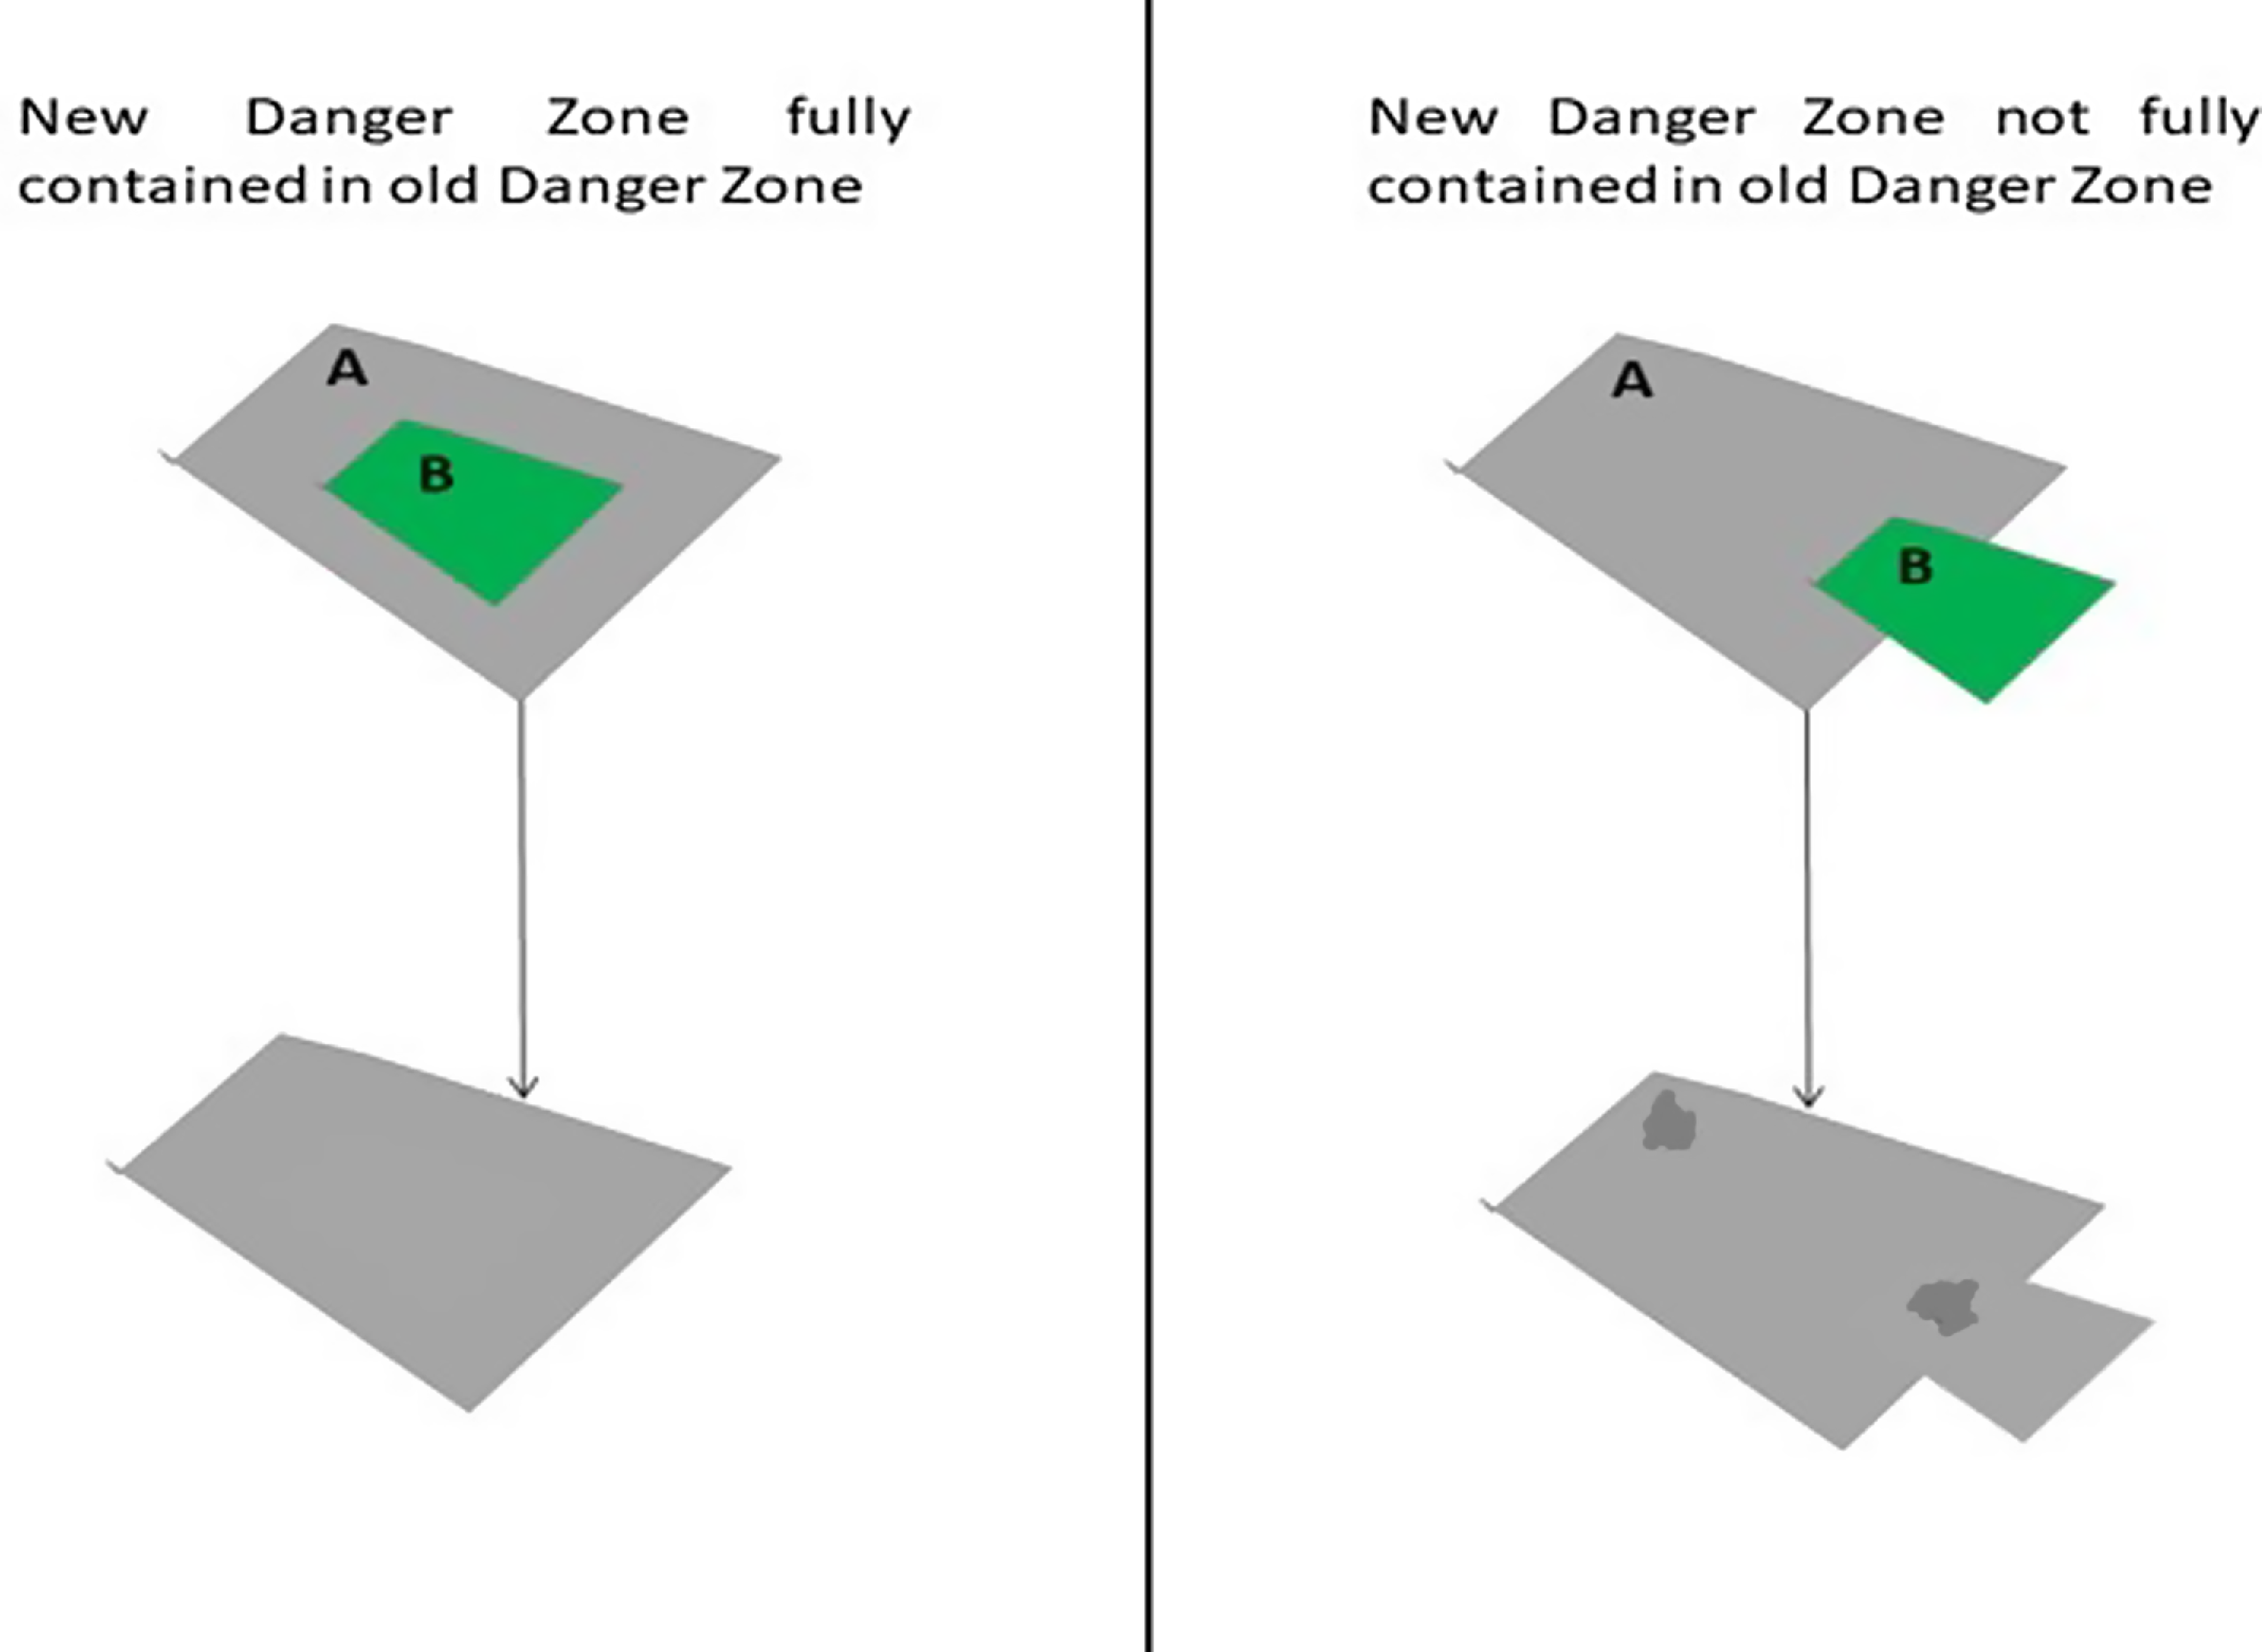
Figure 8. Update of Danger Zones.
3.6. Task creation mechanism
The task creation list is another function which is a result of the communication between the XR4DRAMA framework and the DSS. In this case, the DSS will recommend to the XR4DRAMA framework to attach a set of tasks to POIs, that need to be performed by the first responders for the disaster to be tackled. The use case for this service was based on a flooding scenario, in which external sensors would measure the water level of the river Bacchiglione which passes through Vicenza, and if the water level would overcome a threshold, then the DSS would recommend various tasks that need to be performed on different locations. The location of the sensor as well as the thresholds were placed and defined by the civil protection authorities of the area. Therefore, the task would be attached to POIs for the first responders to see and perform them, to have the best possible outcome in a disaster management scenario.
We provide a message as it comes from the DSS, which the XR4DRAMA framework must map in the various POIs existing on the map. Notice that where the task will be mapped is subject to the coordinates it contains.
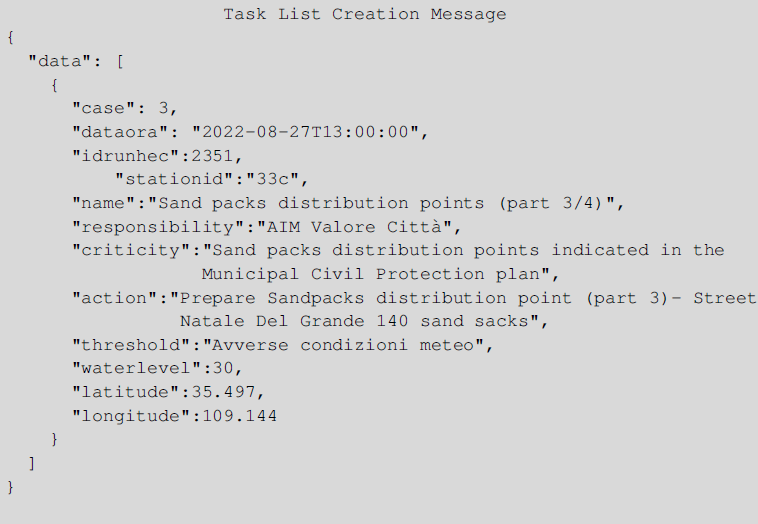
The most crucial information in the previous message is contained in the labels: (i) name which is the title of the task that needs to be performed, (ii) the responsibility which indicates who oversees performing the task, (iii) the criticality which shows how important is the task to be performed, and (iv) the action which contains a detailed description of the task. Apart from the important information, the water level, the coordinates, and the threshold for the water level are also contained in the message.
3.7. General information-emergency contacts-legal documents
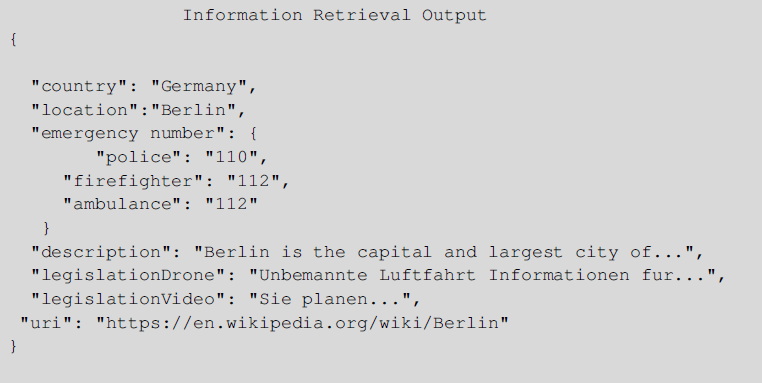
This section refers to the crucial information that accompanies a project. A project is a set of observations, where each observation corresponds to a visual, textual or stress level analysis message. More intuitively, a project is a set of observations which are clustered based on locality. For instance, a project may refer to all observations for the urban area of Vicenza. The XR4DRAMA framework is capable of attaching important information that are related to a project, such as the emergency numbers of the country and the area, the general description of the area, and the legal documents concerning drone operation and recording in public places. The general information refers to a general description of the area that the project refers to. In more detail, each time a new project is created the KG will extract from Wikipedia initially, and if it does not find any information from WikipediaFootnote 9 it will search in DBpedia (Auer et al., Reference Auer, Bizer, Kobilarov, Lehmann, Cyganiak and Ives2007), the abstract that refers to the location of the project.
The emergency data are the emergency numbers that can be used for each project, the emergency numbers are subject to the country, and sometimes region of the country. These numbers are the numbers from which one calls the police, ambulances, and/or firefighters.
The legal documents refer to the legislation concerning recording in public places for each country (and region of country in some cases), and legislation about operating drones in public spaces.
A detailed message of what the aforementioned information looks like to the user is given below, where we extract all of the previous information for the capital of Germany, Berlin.
4. Evaluation
In this Section we present the evaluation of the KG, the POI management mechanism, the DSS, the Task Creation Mechanism, and the Danger Zone Mechanism.
4.1. Knowledge graph evaluation
The completeness of the KG was evaluated through a set of CQs assembled during the formation of the official ontology requirements specification document (ORSD) (Suárez-Figueroa et al., Reference Suárez-Figueroa, Gómez-Pérez and Villazón-Terrazas2009). For this reason, before constructing the KG, we asked from users to define a set of questions that they would like to be answered by the KG of the XR4DRAMA framework. The users were authority workers from Autorita’ di bacino distrettuale delle alpi orientali Footnote 10 and journalists from Deutsche Welle Footnote 11. In total a number of 32 CQs was collected, and in Figure 9 we present a sample of 10 CQs, the complete list of CQs can be found hereFootnote 3.
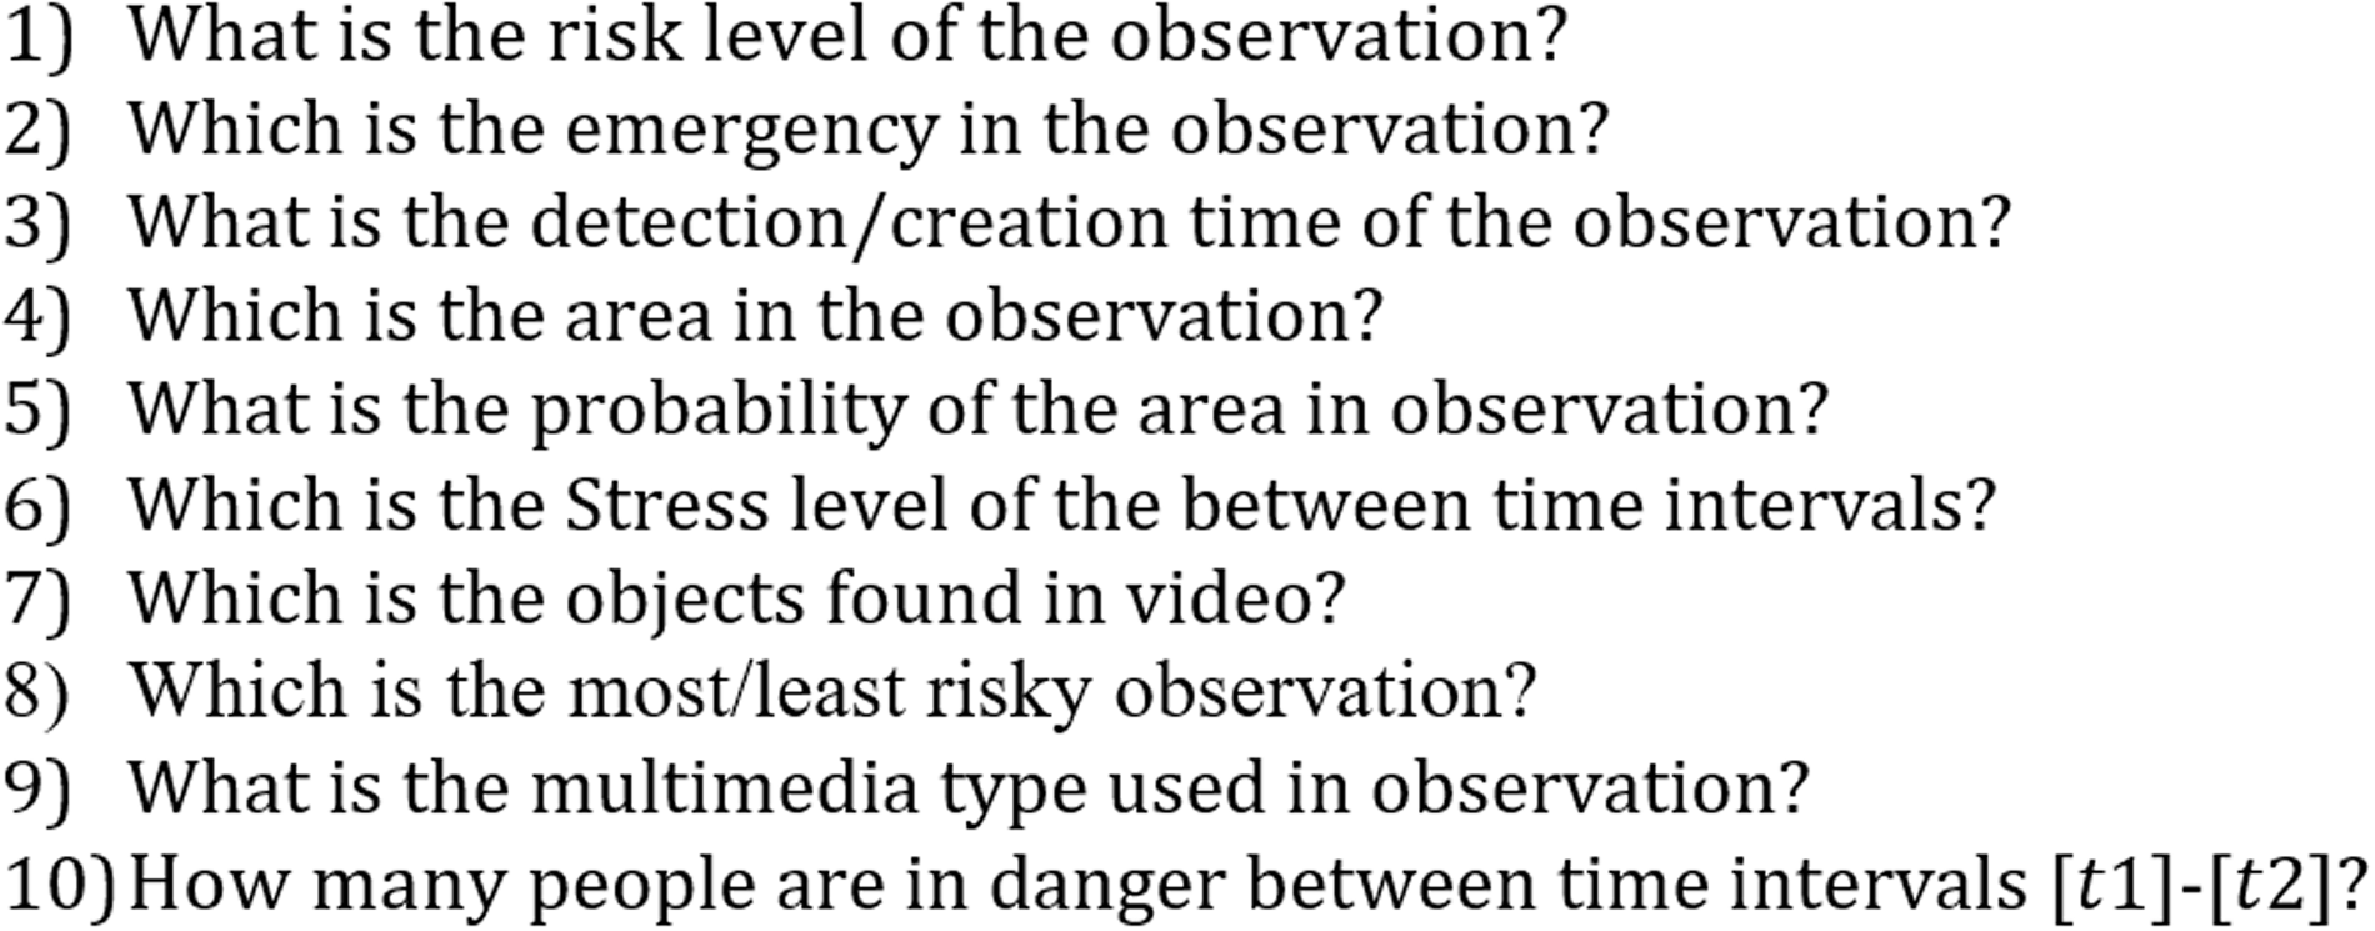
Figure 9. Sample of competency questions.
The completeness of the KG was found adequate, as each CQ when translated into a SPARQL counterpart returned the desired information. For instance, the second CQ from Figure 9 when translated into a SPARQL query (see Example 1), for the observation VisualMetadata_2c60537511c240c9add7fb2eb4e7459e_0 returned flood. Notice the name of the observation is the result of the text VisualMetadata_, if it is a visual observation (otherwise is TextualMetadata_ or StressMetadata_) plus a unique sigmoid value.
Example 1 SELECT DISTINCT ?o WHERE
 $\{$
$\{$
xr:VisualMetadata_2c60537511c240c9add7fb2eb4e7459e_0 xr:hasEmergency ?o.
 $\}$
$\}$
Additionally to the CQs, we performed a validation procedure in order to inspect the syntactic and structural quality of the metadata in the KG and to check the consistency of them. Abiding by the closed-world criteria, custom SHACL consistency checking rules and native ontology consistency checking, such as OWL 2 DL reasoning, were utilized. By using the first, one can discover constraint breaches such as cardinality contradictions or imperfect/missing information. By using the latter, the semantics at the terminological level, known as TBox, are taken into consideration as validation like in the occasion of class disjointness. An exemplary shapes constraint is shown below which unfolds a constraint which dictates that all targeted instances of the class ‘InformationOfInterest’ will always have exactly one string value in their datatype property ‘:hasType’.
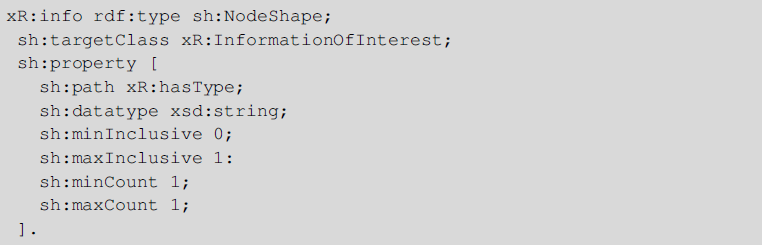
The consistency of the KG was found adequate, as out of 56 SHACL rules, from which 21 referred to object type properties and 35 to data type properties, none of them returned any invalidation of the rule. Moreover, we checked if there exist instances which belong to intersection of classes, as we did not desire such a case, and there were not any.
4.2. Points of interest management mechanism evaluation
The evaluation of the POI management mechanism was performed using the usual precision, recall, and F1-score used for information extraction systems (Equations 1, 2, and 3), for the creation or update of POIs from visual and textual messages. We followed this direction as the POI management mechanism can be regarded as an information extraction mechanism, where a query is received (a message from the textual, visual, or stress analysis components), and some information is extracted from the KG (a POI is created or updated).
 \begin{equation} precision = \frac{|\{Relevant Instance\}\cap\{Retrieved Instance\}|}{|\{Retrieved Instance\}|}\end{equation}
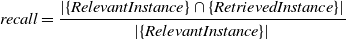 \begin{equation} recall = \frac{|\{Relevant Instance\}\cap\{Retrieved Instance\}|}{|\{Relevant Instance\}|}\end{equation}
 \begin{equation} F1 = 2*\frac{recall*precision}{recall + precision}\end{equation}
Retrieved Instances are considered all the visual (or textual) messages for which the POI management mechanism, did not return an error when we casted a message in order to create or update a POI.
Relevant Instances are considered all the visual (or textual) messages for which the POI management mechanism, managed to create or update a POI, when we casted a message with them.
We denote by
 $Retrieved_t$
and
$Retrieved_t$
and
 $Retrieved_v$
the number of retrieved textual and visual messages, respectively.
$Retrieved_v$
the number of retrieved textual and visual messages, respectively.
 $Relevant_t$
and
$Relevant_t$
and
 $Relevant_v$
are the numbers of relevant textual and visual messages, respectively. Next,
$Relevant_v$
are the numbers of relevant textual and visual messages, respectively. Next,
 $precision_t$
and
$precision_t$
and
 $precision_v$
are the precision scores for the textual and visual messages,
$precision_v$
are the precision scores for the textual and visual messages,
 $recall_t$
and
$recall_t$
and
 $recall_v$
are the recall scores for the textual and visual messages, and
$recall_v$
are the recall scores for the textual and visual messages, and
 $F1_t$
and
$F1_t$
and
 $F1_v$
are the F1 scores for the textual and visual messages, respectively.
$F1_v$
are the F1 scores for the textual and visual messages, respectively.
The dataset on which we evaluated our POI management mechanism contains a set of 1201 textual messages and 600 visual messages, and can be found here footnote 1. Notice that in order to tackle potential biases, the value of each label in each message was randomly collected from a gold standard dataset created from domain experts. Interestingly, all the messages (either textual or visual) were considered Retrieved, meaning that our POI management mechanism did not return any error, for any given message both for textual and visual. Thus,
 $Retrieved_t = 1201$
and
$Retrieved_t = 1201$
and
 $ Retrieved_v = 600$
. The same does not hold for the relevant messages, for either textual or visual, as for textual the
$ Retrieved_v = 600$
. The same does not hold for the relevant messages, for either textual or visual, as for textual the
 $Relevant_t$
messages were 1057, and for visual the
$Relevant_t$
messages were 1057, and for visual the
 $Relevant_v$
messages were 534.
$Relevant_v$
messages were 534.
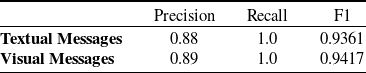
Based on the aforementioned numbers the precision, recall, and F1-scores for both textual and visual messages can be found in Table 6. Notice, the results are rounded to four decimals.
Table 6. Precision, Recall, and F1-scores for textual and visual messages
4.3. Decision support system
In order to validate the Visual and Textual Analysis message severity assessment of the DSS, standard metrics like precision, recall, F1-score, and Accuracy score were used. The annotated dataset for the Visual DSS module was split at 76 entries for training and 20 entries for testing using cross validation (10-folds). In order for the accuracy scores and the rest of the metrics to be comparable among the two different sub-models of DSS, in the testing part of the Textual DSS we used 20 entries as well. The four different ML algorithms were tested after hyperparameter tunning for each one. In the following Table 7, we can see the results for each one of the models according to their best achieved accuracy score.
Table 7. Machine Learning algorithms performance according to Accuracy score

The best performing algorithm for the Visual Analysis module is DT Classifier with
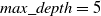 $max\_depth = 5$
(the maximum depth of the tree),
$max\_depth = 5$
(the maximum depth of the tree),
 $max\_leaf\_nodes = 10$
(the maximum amount of nodes that can be used when growing a tree in best-first fashion) and
$max\_leaf\_nodes = 10$
(the maximum amount of nodes that can be used when growing a tree in best-first fashion) and
 $random\_state = 42$
(controls the randomness of the estimator – if the
$random\_state = 42$
(controls the randomness of the estimator – if the
 $random\_state$
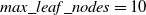
is an integer a deterministic behavior during fitting is obtained). In the following Table 8, we can see more analytically the validation metrics for DT (see Figure 10).
$random\_state$
is an integer a deterministic behavior during fitting is obtained). In the following Table 8, we can see more analytically the validation metrics for DT (see Figure 10).
In the following figure, there is the confusion matrix of the testing phase of DT algorithm, with the best performing parameters.
Table 8. Precision, Recall, F1-score for DT algorithm
The best performing algorithm for Textual Analysis DSS is SVM with
 $C=10$
(Regularization parameter),
$C=10$
(Regularization parameter),
 $gamma=0.1$
(Kernel coefficient for ‘rbf’, ‘poly’, and ‘sigmoid’), and
$gamma=0.1$
(Kernel coefficient for ‘rbf’, ‘poly’, and ‘sigmoid’), and
 $random\_state=42$
. In the following Table 9, we can see more analytically the validation metrics for SVM. Following there is the confusion matrix of the testing phase of the SVM algorithm with the best performing parameters (see Figure 11).
$random\_state=42$
. In the following Table 9, we can see more analytically the validation metrics for SVM. Following there is the confusion matrix of the testing phase of the SVM algorithm with the best performing parameters (see Figure 11).
Table 9. Precision, Recall, F1-score for SVM algorithm

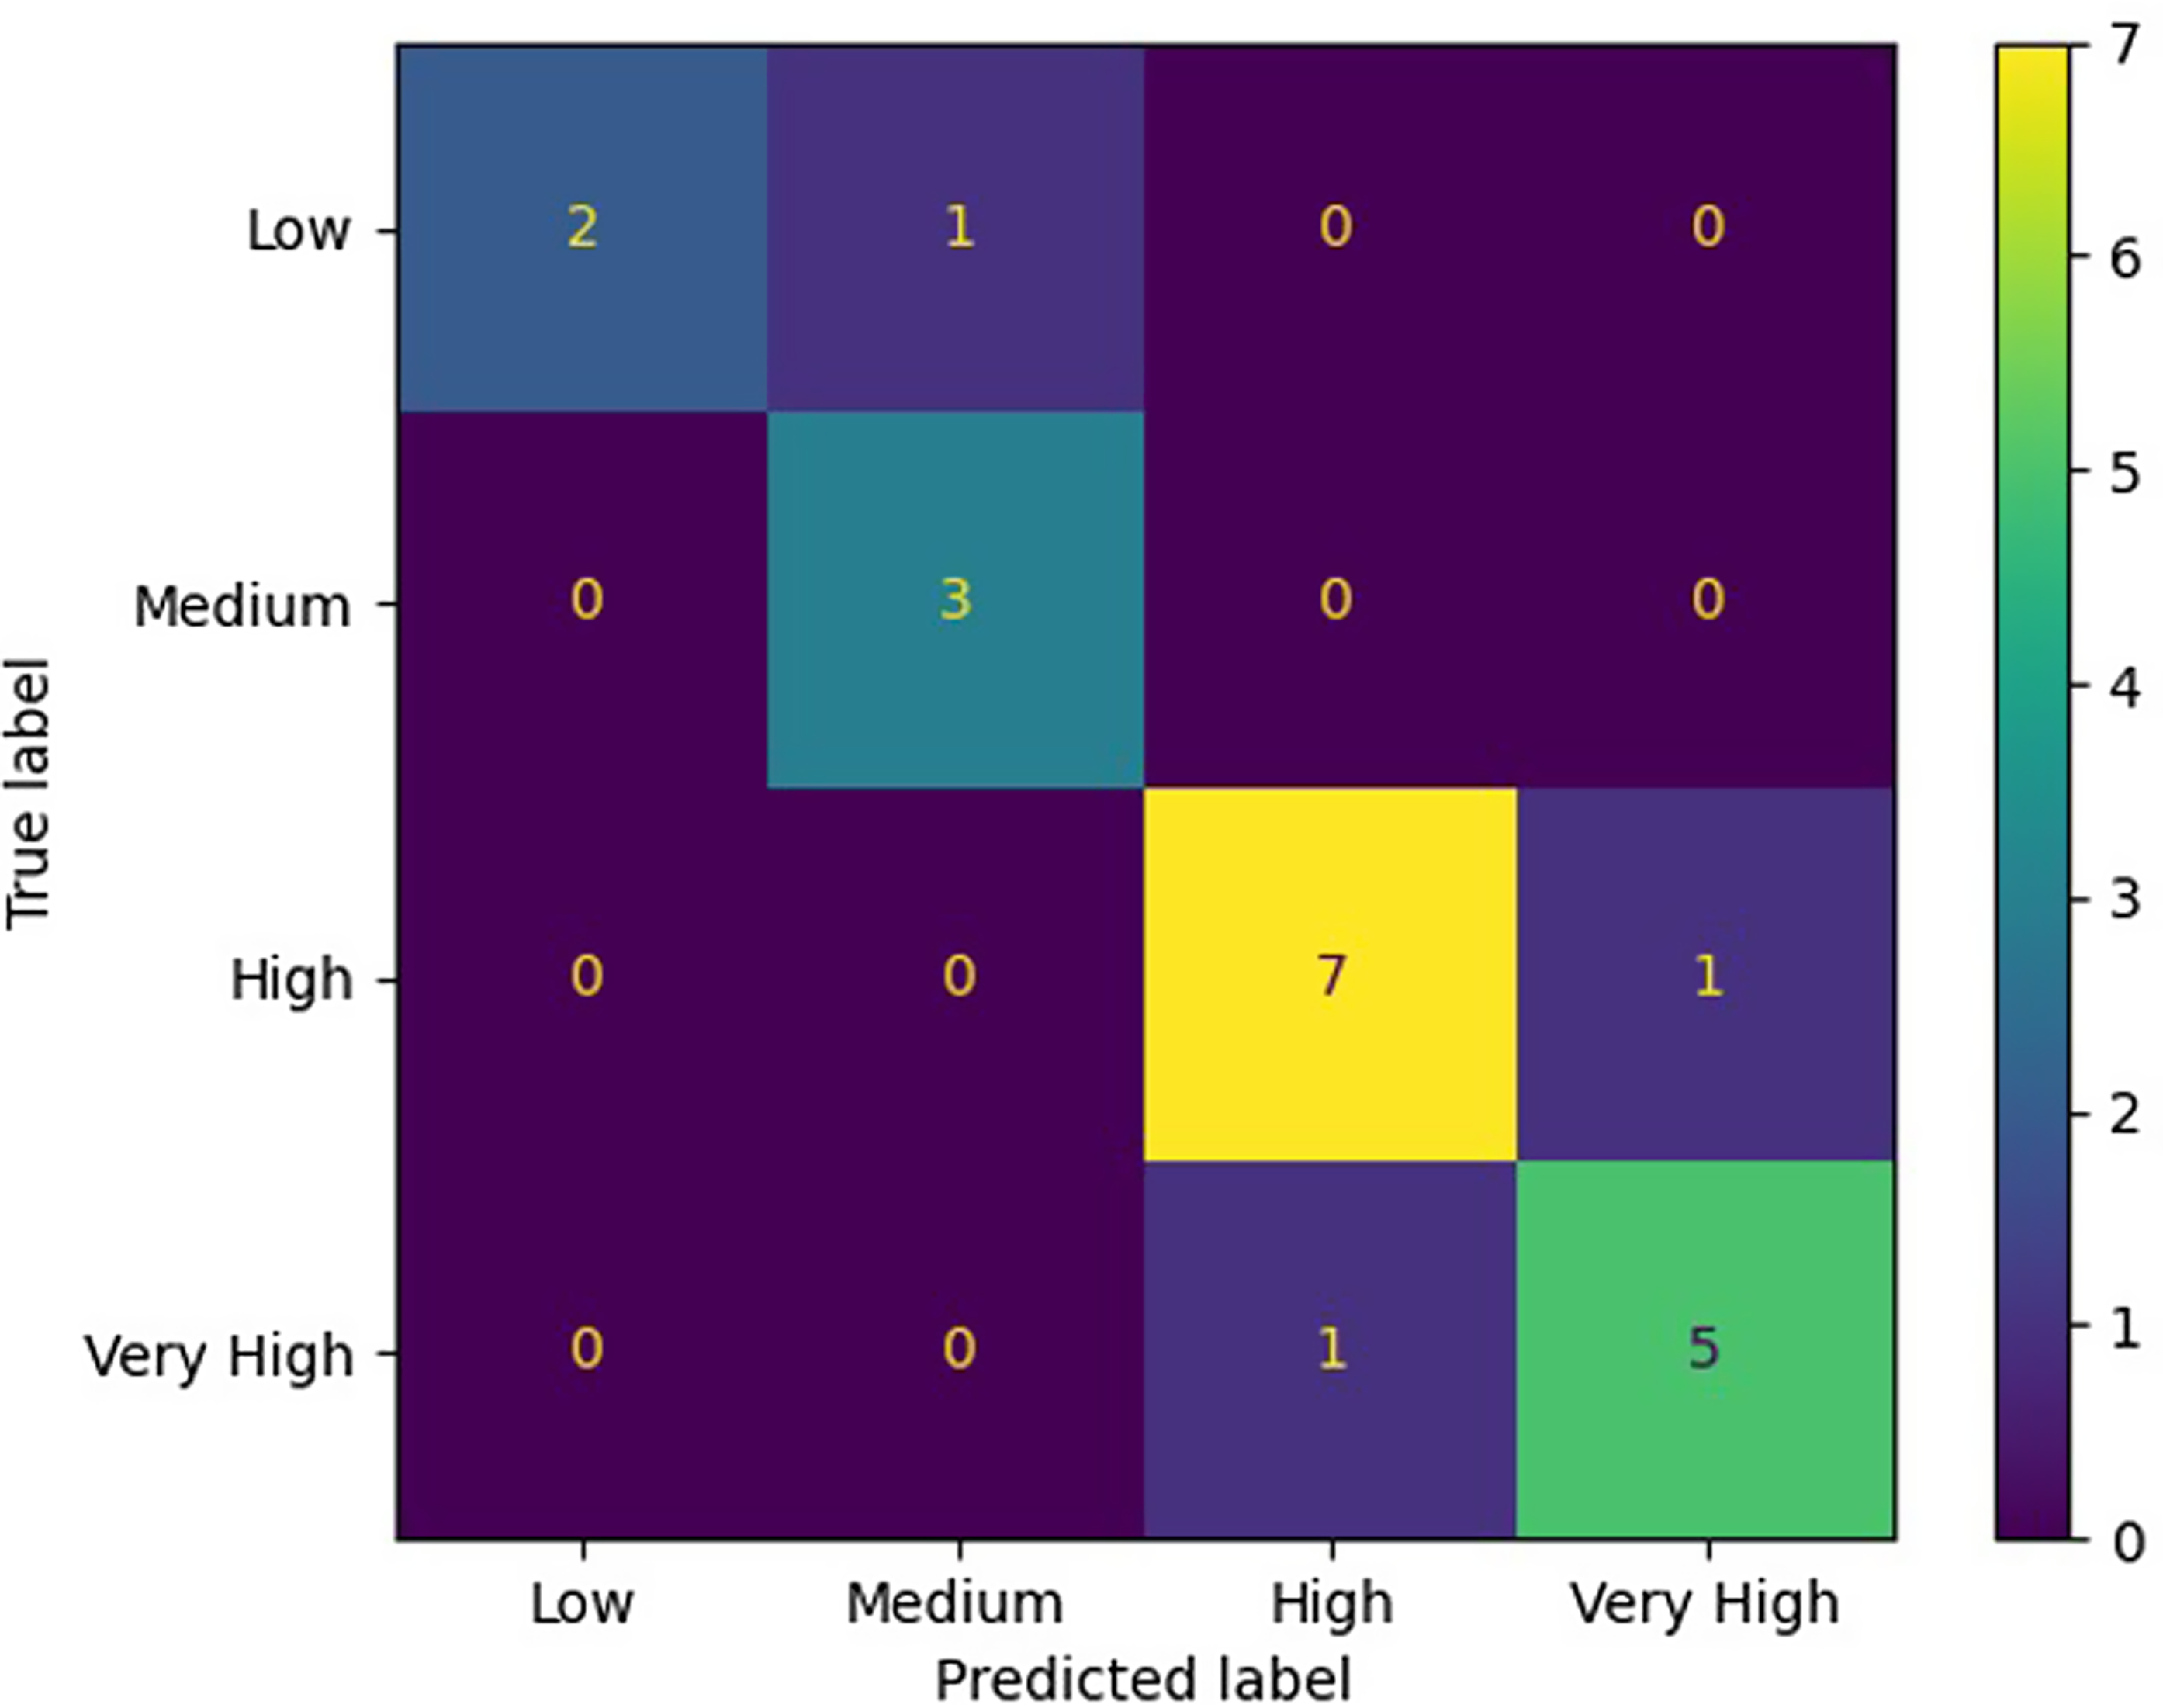
Figure 10. Confusion matrix of DT algorithm.
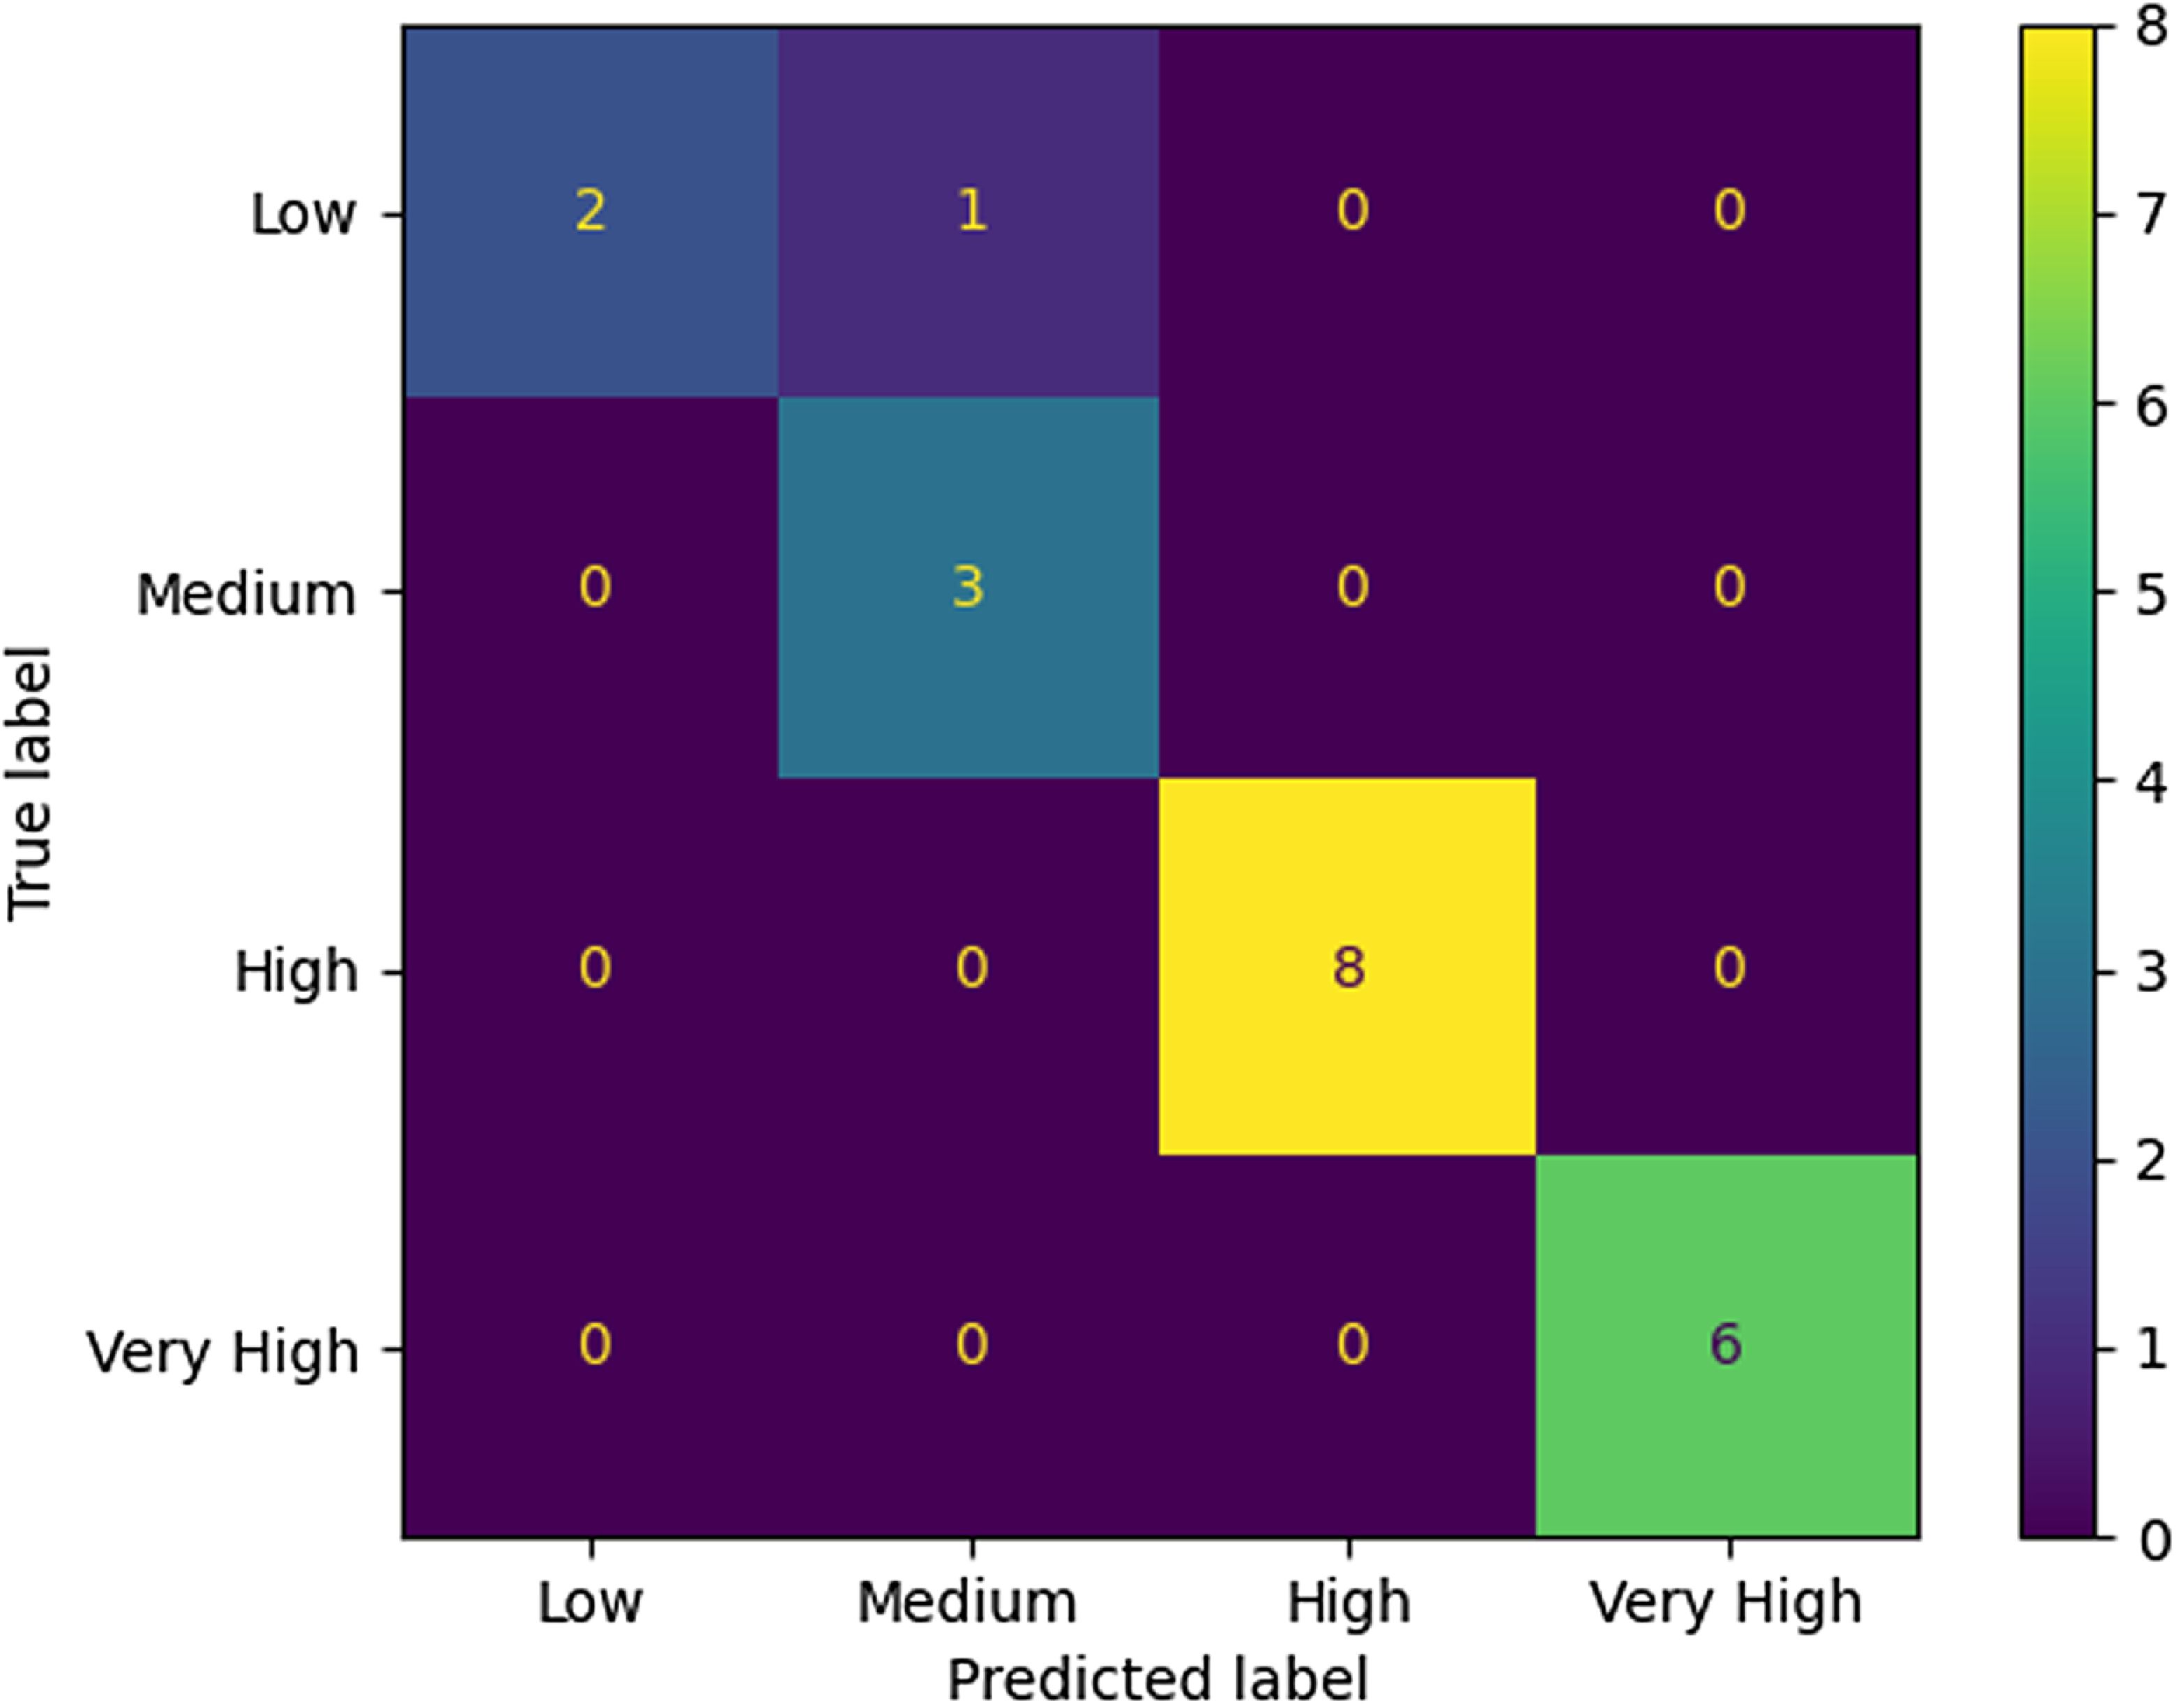
Figure 11. Confusion matrix of SVM algorithm.
4.4. Task creation mechanism evaluation
The task creation mechanism was evaluated through a use case scenario. More specifically, we took data from AAWA8, for the water levels of the river Bacchiglione in the urban area of Vicenza. AAWA has installed across the river 41 different sensors that measure the water level of the river, and if the water level exceeds a threshold then a warning message is triggered. The threshold varies from sensor to sensor as the geography of each area around the sensor is different, and a water level that is allowed for one sensor might not be allowed for another.
Based on this setup, we took data of water level measures concerning a period of more than a decade, from 2010 till 2022. In this dataset, there were
 $\sim$
50 violations of the thresholds across all sensors. For these violations, our DSS mechanism correctly created a message for tasks that need to be performed, and with the help of the XR4DRAMA framework these tasks were attached to POIs.
$\sim$
50 violations of the thresholds across all sensors. For these violations, our DSS mechanism correctly created a message for tasks that need to be performed, and with the help of the XR4DRAMA framework these tasks were attached to POIs.
4.5. Danger zone mechanism evaluation
For the evaluation of the danger zone management mechanism, we followed a direction similar to the evaluation of the POI management mechanism (see Section 4.2). The evaluation of the danger zone was performed using the usual precision, recall, and F1-score used in information retrieval systems (Equations 1, 2, and 3), for the creation or update of danger zones from DSS messages. We followed this direction, as the danger zone management mechanism can be regarded as an information retrieval mechanism, where a query is received (a message from the DSS), and some information is retrieved from the KG (a danger zone is created or updated).
Retrieved Instances are considered all the DSS messages for which the danger zone management mechanism, did not return an error when we casted a message in order to create or update a danger zone.
Relevant Instances are considered all the DSS messages for which the danger zone management mechanism, managed to create or update a danger zone, when we casted a message with them.
We denote by
 $Retrieved_{DSS}$
the number of retrieved DSS messages.
$Retrieved_{DSS}$
the number of retrieved DSS messages.
 $Relevant_{DSS}$
are the numbers of relevant DSS messages. Next,
$Relevant_{DSS}$
are the numbers of relevant DSS messages. Next,
 $precision_{DSS}$
are the precision scores for the DSS,
$precision_{DSS}$
are the precision scores for the DSS,
 $recall_{DSS}$
are the recall scores for the DSS messages, and
$recall_{DSS}$
are the recall scores for the DSS messages, and
 $F1_{DSS}$
are the F1 scores for the DSS messages.
$F1_{DSS}$
are the F1 scores for the DSS messages.
The dataset on which we evaluated our danger zone management mechanism contains a set of 2400 DSS messages and can be found here footnote 3. Notice that in order to tackle potential biases, the value of each label in each message was randomly collected from a gold standard dataset created from domain experts. The
 $Retrieved_{DSS}$
messages were 2344 and the
$Retrieved_{DSS}$
messages were 2344 and the
 $Retrieved_{DSS}$
were 2068.
$Retrieved_{DSS}$
were 2068.
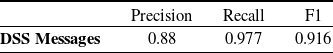
Based on the aforementioned numbers the precision, recall, and F1-scores for both textual and visual messages can be found in Table 10. Notice that the results are rounded to four decimals.
5. Discussion and conclusion
The XR4DRAMA framework was developed with the goal of assisting journalists in managing and disseminating information regarding the condition of a location, so that they may provide the best coverage possible for events that took place there. The KG of the XR4DRAMA framework was constructed in order to work as a KG that would assist journalists in media planning and first responders in disaster management scenarios. Moreover, the XR4DRAMA framework can represent knowledge for disaster management, for example, information such as: (a) Observations and Events, (b) Spatio-temporal data, and (c) Mitigation and response plans in crisis. Additionally, the XR4DRAMA framework through its POI management mechanism offers an innovative mechanism that can create or update POIs. In addition, the XR4DRAMA framework provides an innovative mechanism, the POI management mechanism that can create or update POIs, which contain vital geographical data required by journalists and first responders, in order to have a clear view of the area and plan appropriately for the coverage of an event and how to tackle the disaster that occurred.
The task creation mechanism with which the XR4DRAMA framework is equipped assigns tasks to POIs and is based on a data-driven DSS. First responders and citizens, in addition to a POI which contains information about a specific point in the map, are also interested to know what region has been affected by a disaster and what is the level of severity for that specific area. Therefore, we also provide a mechanism that creates or updates danger zones and assigns to them severity scores indicating the level of severity. Similarly, to the task creation mechanism the danger zone mechanism gets the severity score from a DSS.
Table 10. Precision, Recall, and F1-scores for DSS messages for danger zone creation or update
Regarding the evaluation, our goal was to examine the POI management mechanism using the precision recall-F1 metrics for information retrieval systems, as well as the completeness and consistency of the XR4DRAMA framework. CQs, which were gathered by experts, were used to assess the KG’s completeness. More specifically, we converted each CQ into a SPARQL equivalent, and we anticipated that each one would return results. This is evidence that our KG may deliver significant information in a broader media planning scenario. A series of SHACL restrict rules and rules which check if instances belonged to the intersection of the classes, were used to test the consistency of the KG; none of them resulted in the rule being invalidated. This demonstrates the coherence of our KG, proving that it is free of noise and contradicting information.
Our POI management mechanism received strong F1 scores for both the visual (93.1%) and textual (95.6%) message, demonstrating that it can be utilized independently to create/update POIs in a broad media planning scenario. Additionally, we can comment that this occurred when updating POIs, which means that new information could not be added to POIs that already existed in the area, and were missing relevant instances for both textual and visual messages. The updated messages were straying outside of the bounding boxes of all existing POIs because each POI has a box around it. Notice that the POIs’ bounding boxes are part of a broader bounding box that encompasses the area that requires news coverage. It seems reasonable to take into account a bounding box for the POIs and the area that requires news coverage; otherwise, we risk adding POIs to the area that is situated in completely other areas of the map.
The high Recall scores–100% for both the visual and textual messages—can also be worth mentioning. This essentially indicates that there were no textual or visual messages that indicated an error. If we examine the two scenarios in which an error may be returned, the reason for not doing so is pretty clear: (i) The message’s coordinates do not fall within a bounding box that designates the location where an event has occurred, or (ii) The user will identify a non-matching category-subcategory tuple. It is difficult for the user to choose the incorrect selection in both cases since the user sends messages using a mobile application (which is now private) that displays the permissible category-subcategory tuples, and the bounding box with a blue hue over an area.
Regarding the task-creation mechanism, it seemed more natural to evaluate the mechanism through a use case and consider the accuracy of how many tasks were assigned to POIs and how many of them were accepted by first responders or citizens. In this way, we would understand if the task-creation mechanism gives rational advice to human users and helps them go through a disaster management or media planning scenario.
The danger zone management mechanism was evaluated as the POI management mechanism as they do the same function more or less, that is, they receive a message and they have to retrieve some information to the application. For this reason, we evaluated the danger zone management mechanism as an information retrieval mechanism. On the other hand, the DSS mechanism was evaluated with data-driven methods in order to conclude with the best possible model for our DSS.
The presented framework, of course, is not perfect as one can argue over a variety of potential limitations. But we will stand on the most important ones, the first one is that our system was tested over disasters about floods, therefore other types of disasters might require some minor changes in the software. By extension, the DSS would require further training in order to be able to provide recommendations in new scenarios, as well as the danger zone component might require tuning in order to project accurately the danger zones in new scenarios. Another limitation is that currently the framework supports only two use cases, that of disaster management and the media planning, and more could be added, such as a use case for meta-disaster management planning. Finally, an important know limitation which is also a future work goal, is the absence of explainability capabilities of the system, meaning that the system is not currently able to explain its decisions and answers.
As for future work, the intention is to add more explainability to our system, meaning that the XR4DRAMA framework will be able to explain its decisions and the answers it provides to users. Moreover, we will add knowledge from external knowledge bases about geography and other general knowledge for a location from Semantic Web KGs, such as ConceptNet (Speer et al., Reference Speer, Chin and Havasi2017), DBpedia (Auer et al., Reference Auer, Bizer, Kobilarov, Lehmann, Cyganiak and Ives2007), and WordNet (Fellbaum, Reference Fellbaum2010). Another, potential future work task would be to align our ontology with other external ontologies such as the Semantic Sensor NetworkFootnote 12. Also, extra evaluation on the KG can be performed with consistency checking tools such as OntOlogy Pitfall Scanner (OOPS)Footnote 13.
Acknowledgement
This work has been funded by XR4DRAMA Horizon 2020 project, grant agreement number 952133. The publication of the article in OA mode was financially supported in part by HEAL-Link.


 Open access