


The promotion of healthy dietary patterns that help to protect individuals and populations from developing chronic diseases such as hypertension and CVD is a public health priority. The question of whether healthier diets are more expensive than less health-promoting eating patterns remains contentious. Cross-sectional studies across a number of countries have modelled the cost of healthier dietary patterns and consistently found them to be more expensive( Reference Townsend, Aaron and Monsivais 1 – Reference Lopez, Martinez-Gonzalez and Sanchez-Villegas 6 ). Specifically in the UK, analysis from the Women’s Cohort Study found that the amount of money spent was predictive of healthier eating( Reference Carter and Little 7 ) and healthier dietary patterns were found to cost twice as much as less healthy dietary patterns( Reference Morris, Hulme and Clarke 8 ). Further, data from the UK National Diet and Nutrition Survey (NDNS) showed energy intake to be strongly correlated with dietary cost and lower food costs for some subgroups of the population including people in low-income categories and those who consumed less than recommended quantities of fruit and vegetables( Reference Timmins, Hulme and Cade 9 ). Pooling data from the published studies, a meta-analysis was recently published which concluded that healthier foods and dietary patterns are more expensive than less healthy foods and patterns( Reference Rao, Afshin and Singh 10 ).
Despite this finding across multiple studies and countries, intervention studies that cost changes in actual food intake do not consistently show higher costs associated with higher-quality diets. A number of studies, including an analysis from the Finnish Diabetes Prevention Study( Reference Ottelin, Lindström and Peltonen 11 ) demonstrated no change in costs( Reference Cleary, Casey and Hofsteede 12 , Reference Goulet, Lamarche and Lemieux 13 ), while some have shown decreased( Reference Burney and Haughton 14 ) or increased spending( Reference Rydén, Sydner and Hagfors 15 ) when dietary quality is improved. However, there has been no costing of UK intervention studies published to date. There is a need to assess the financial impact of changing habitual food intake to reflect a healthier dietary pattern in a UK context. The present study aimed to determine if a cardioprotective dietary intervention based on UK dietary guidelines was more expensive than a conventional UK diet; and to explore the change in food group costs when altering habitual intake.
Methods
Study design and participants
The study design was a retrospective analysis of food records completed by participants who completed CRESSIDA (Cardiovascular Disease risk REduction Study; http://www.isrctn.com ISRCTN no. 92382106), a 12-week dietary intervention study. A description of the original study methods and results has been published elsewhere( Reference Reidlinger, Darzi and Hall 16 ). Briefly, 162 healthy participants aged 40–70 years were randomized to either a cardioprotective diet (n 80; based on current UK dietary guidelines( 17 ): salt restricted to less than 6 g/d, SFA less than 10 % of energy, increased whole grains to greater than 50 % of cereal intake, five portions fruit and vegetables per day and increased fish intake to two portions per week, one of which should be oily) or a control diet (n 82) reflecting a dietary pattern representative of one eaten by many people in this age group in the UK( Reference Sadler, Nicholson and Steer 18 ) (nutritionally balanced diet containing mostly refined cereals, meat (meat products, poultry, non-oily fish), full-fat dairy products, potatoes and at least one portion of fruit and two portions of vegetables per day). Individualized dietary advice was provided by a research dietitian to each participant. However, specific advice was not provided on how to shop cost effectively for the interventions allocated; instead the focus of advice was on aherence to the dietary intervention that the participant was allocated.
For the current study, a feasible sample of forty participants (n 20 from each arm) from the total CRESSIDA sample (n 162) was randomly selected using a computerized random number generator. Equal numbers of male and female participants, and of those allocated to the intervention and control groups, were included in the sample.
Development of a food cost database
Each participant completed a 4 d estimated food diary at baseline and after 12 weeks. A food cost database was constructed by compiling a full list of food codes from the sample, de-duplicating repeat codes and decoupling codes that incorporated more than one ingredient (e.g. potatoes mashed with butter was separated into the code for potatoes and a code for butter, and a formula to include 50 g of butter per 1 kg of potatoes purchased was applied to the original code for costing purposes). Where ingredients as purchased required home processing, the edible portion of the whole food was used as a multiplication factor of the food weight.
Food prices were obtained from two online supermarkets (one identified as ‘budget’ and the other a mid-priced ‘regular’ supermarket) between January and March 2013 for all foods recorded. Prices were also obtained from two additional online supermarkets for all foods recorded by a smaller number of participants (n 12; distributed equally across both groups) to obtain a multiplication factor for another ‘regular’ supermarket as well as a higher priced ‘quality’ supermarket. Foods were priced using own brand products where available or the brand available at the majority of the four supermarkets. The cost of the food was based on medium sized packages and where possible comparable package sizes were priced across supermarkets. The cost per gram of the food was obtained by dividing the purchase price by the edible portion weight of the food. Sale or multi-buy prices were disregarded and the usual selling price of the food item was used for the database. Several food items were provided to participants in both arms, as part of the dietary intervention to aid compliance( Reference Reidlinger, Darzi and Hall 16 ); for these foods, prices were obtained for the actual brand and package size provided.
Calculation of dietary cost
A list of foods and portion weights was generated from the diaries. For each participant at each time point, edible portion food costs were calculated by multiplying the weight of each food item by the unit cost in the food cost database (in £ sterling). Total costs of all foods and beverages consumed over the four days were then averaged to derive a mean daily cost. Foods were categorized into food groups according to the categorization used in the UK food composition tables( 19 ) to assess changes in the weight and cost of each food group during the intervention. The cost of home-cooked dishes was obtained by using the recipe provided by the participant; if no recipe was provided a standard recipe was sourced from the UK food tables( 19 ), a UK food industry recipe book( Reference Campbell, Foskett and Ceserani 20 ) or the BBC Good Food website( 21 ). Costing of recipes, as for individual food items, was based on the edible portion of the food.
Statistical analysis
All statistical analyses were performed using the statistical software package IBM SPSS Statistics Version 20.0. Distributional checks for normality were undertaken using Q–Q plots. Paired t tests were used to compare mean baseline and end-point costs within each group. Independent-samples t tests were calculated to assess differences between groups for mean change in costs from baseline to end point, mean change in weight and daily cost by food group, and mean cost at end point by food group. The differences in amounts of foods and costs according to food group categories between the groups at end point were analysed using ANCOVA, with baseline cost as a covariate. Mean difference was presented as the difference between cardioprotective group costs and control group costs.
Results
Baseline characteristics
Food and beverage intakes from 4 d food diaries were costed for forty participants (cardioprotective n 20, control n 20) of the CRESSIDA randomized controlled trial at baseline and post-intervention (12 weeks later). The baseline characteristics of the participants are shown in Table 1 and compared with those of all participants completing the CRESSIDA (n 162); the costed sample was comparable to the whole cohort apart from Na intake, which was higher in the costed sample.
Table 1 Baseline characteristics of participants in the costed sample and all participants who completed the CRESSIDA study
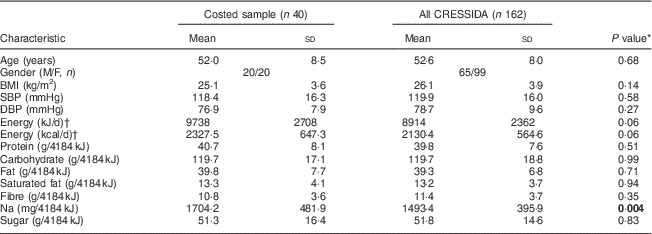
M, male; F, female; SBP, systolic blood pressure; DBP, diastolic blood pressure.
* P value for between-group difference at baseline using the independent-samples t test; significant P values are shown in bold.
† Energy between groups is approaching significance, likely due to the higher proportion of males in the costed sample (50 %) compared with the overall CRESSIDA sample (about 33 % male). Therefore the remaining nutrient data are presented as grams (or milligrams) per 4184 kJ (1000 kcal).
Change in diet cost during intervention
At baseline, the mean daily food cost for all participants was £6·12 (sd £1·83), ranging from £5·22 (sd £1·57) in the budget supermarket to £7·78 (sd £2·43) in the quality supermarket. There was no difference in diet cost between the cardioprotective and control groups for any supermarket. Following the intervention, there was no significant change in diet cost between groups (Table 2).
Table 2 Daily cost and mean difference in cost of diet for cardioprotective and control groups by supermarket; CRESSIDA study
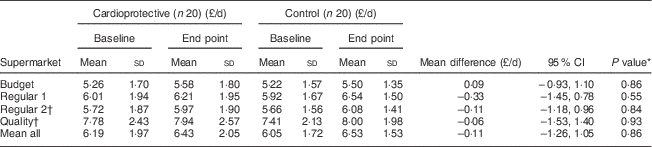
* P value for between-group difference at end point using the independent-samples t test.
† Factored costs.
Baseline dietary intake categorized into food groups indicated higher costs (P<0·005) at baseline in the cardioprotective group for dairy (£0·22/d) and fruit (£0·41/d), reflecting higher intakes, and possibly higher-cost choices for these foods, at the start of the intervention. However, the change from baseline in consumption of foods (by weight) in each food group was not different between groups (Table 3). There was a significant difference in costs at end point between groups for dairy and non-alcoholic drinks, which were higher for the control group, and fish, sugar and snack foods, which were higher for the cardioprotective group. The difference in costs was due to the foods chosen within the food groups, rather than a change in the amount of foods consumed within food groups. For example, for the dairy group, the mean difference at end point (after accounting for baseline intakes) was 30 g/d with the cardioprotective group consuming about two dessertspoons more dairy at end point (P=0·66) compared with the control group, but spending £0·33 less per day (P=0·012). Similarly, mean fish intake at end point was about 10 g/d less in the cardioprotective group compared with the control group (P=0·67), but the mean daily spend on fish was £0·58 more (P=0·038; Table 3).
Table 3 Baseline, end point and mean difference in daily amount and cost of food groups for participants in the cardioprotective and control diet; CRESSIDA study
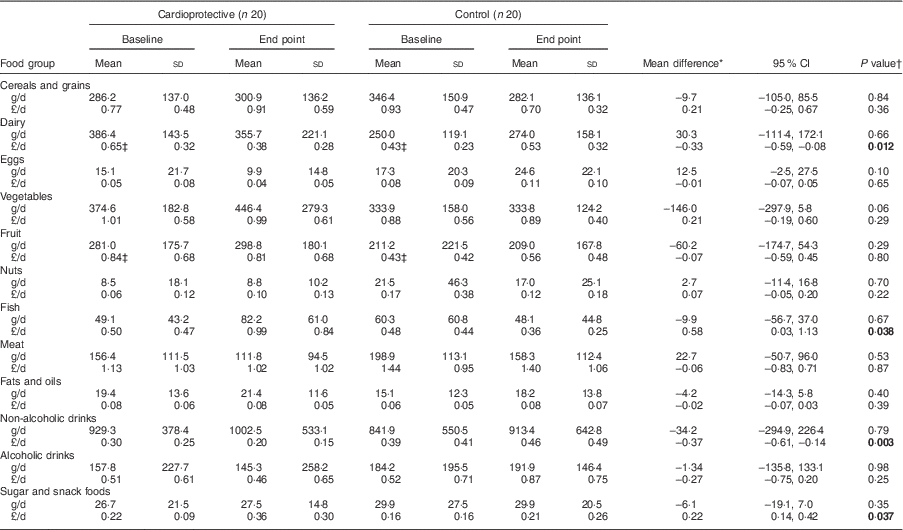
* Mean difference is the difference between the cardioprotective group diet cost and the control diet cost at end point adjusted for baseline intake (mean cardioprotective cost minus mean control cost).
† P value for between-group difference at end point using ANCOVA with Bonferroni adjustment for multiple comparisons; significant P values are shown in bold.
‡ Between-group difference at baseline P<0·05, using the independent-samples t test.
The ranking of food groups by cost at end point demonstrated similar rankings for four of the top five most expensive food groups across both intervention arms. The exceptions were the fish food group (included in the top five for cost for the cardioprotective group but not the control group) and alcohol food group (included in the top five food groups for cost in the control diet group but not for the cardioprotective group; Table 4).
Table 4 Mean cost at end point by food groupFootnote * for cardioprotective and control diet groups; CRESSIDA study
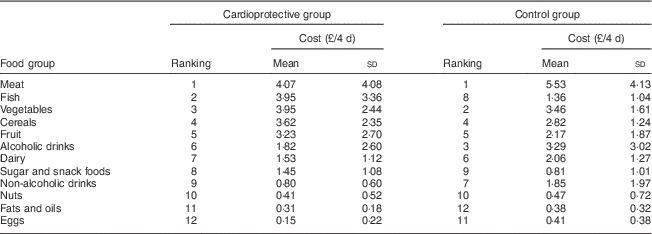
* End-point costs for 4 d intake as recorded in estimated food diaries.
Discussion
The key finding of the present study is that a cardioprotective dietary pattern based on UK dietary guidelines was not more expensive than a control diet representative of the habitual intake of similarly aged people in the UK. While overall the cardioprotective diet was not more expensive we did find increased spending in certain food groups; however, total food expenditure did not change, suggesting that any increased costs were balanced by savings in other food groups. These results suggest that cost may not be a barrier to modifying habitual intake to reflect a more cardioprotective dietary pattern.
The finding of no overall difference in cost is in agreement with evidence from other intervention studies( Reference Ottelin, Lindström and Peltonen 11 – Reference Burney and Haughton 14 , Reference Raynor 22 ); however, it contradicts the body of evidence from observational studies( Reference Morris, Hulme and Clarke 8 , Reference Cade, Upmeier and Calvert 23 – Reference Drewnowski and Eichelsdoerfer 26 ) and a recent meta-analysis of cross-sectional studies, which concluded healthier dietary patterns to be more expensive than less healthy patterns( Reference Rao, Afshin and Singh 10 ). Our study is the first analysis of an intervention study based on UK food prices, which differ from those of the rest of Europe; for example, food prices rose by 32 % in the UK between 2007 and 2012, but by only 13 % in the same time period in France and Germany( 27 ). Around the world different countries operate under unique market conditions, with international variation in price, taxation, balance of imports and exports, manufacturing and distribution costs affecting food costs. Thus comparisons are made more difficult when data are across countries and at different time points, notwithstanding the methodological rigour adopted by Rao et al. in standardizing to a common-year US dollar( Reference Rao, Afshin and Singh 10 ). There are a number of additional factors that may explain the conflicting evidence. The methods used to calculate food costs vary, including per energy unit (e.g. cost per 4184 kJ/1000 kcal), by weight (e.g. cost per 100 g) or – less frequently due to the practicalities in determining an average quantity – per portion (i.e. cost per single portion). Such methodological differences are the subject of much academic debate( Reference Carlson and Frazāo 28 ). Whereas there is good evidence of an inverse relationship between dietary energy density and nutrient intakes( Reference Andrieu, Darmon and Drewnowski 4 , Reference Monsivais and Drewnowski 29 , Reference Ledikwe, Blanck and Khan 30 ), the usefulness of pricing foods per energy unit when costing higher-quality diets has been questioned( Reference Rao, Afshin and Singh 10 ). Foods lower in dietary energy for weight, such as fruit and vegetables, have a higher price when measured per energy unit( Reference Carlson and Frazāo 28 ) rather than by weight; however, they are generally also of a higher nutrient density (in the form of vitamins, minerals and dietary fibre, for example) than foods that have higher energy for weight( Reference Darmon, Darmon and Maillot 31 ). Furthermore, in cross-sectional studies food selection and cost may be more greatly impacted by additional influences on food purchasing behaviour such as nutrition and food knowledge and the ability to shop, which are likely be somewhat ameliorated in a dietary intervention study with individualized advice.
The results of the present study highlight the variable amounts spent proportionately on food groups with different dietary patterns, which is in agreement with previous work( Reference Rao, Afshin and Singh 10 ). Although cost was different between the two dietary patterns for some food groups, actual consumption (by weight) did not change significantly for any food group, suggesting that individual food choices within the food groups were driving the cost differences. In the cardioprotective group, total daily costs were significantly higher for fish (due to the encouragement of regular oily fish intake as part of the intervention) and for sugar and snack foods (reflecting the provision of wholegrain cereal nut bars, a considerably more expensive choice than the biscuits and cakes they were intended to replace); but lower for non-alcoholic drinks and eggs. Given that biomarkers of intake in the original study( Reference Reidlinger, Darzi and Hall 16 ) supported compliance to increased whole grains and oily fish intakes, and reduced added sugars intake in the cardioprotective group, it is likely that the changes to costs reflected improvements in the quality of the diet (rather than quantity) for the cardioprotective diet group. Greater spending on wholegrain cereals has been noted with more health-promoting diets( Reference Bernstein, Bloom and Rosner 3 ) and in the current study there was a slightly greater (about £0·80/d), but not statistically significant, daily spend on cereals in the cardioprotective group. Similarly, the results support a trend for spending more on meat with less healthier diets( Reference Bernstein, Bloom and Rosner 3 ), but it did not reach statistical significance. Despite these differences in costs across food groups, there was little difference in actual rankings of food groups at end point, with the aggregated top five food groups by cost in both groups remarkably similar. Only one food group difference was evident in the top five: fish, which ranked second for participants in the cardioprotective group but only eighth in the control group; and alcohol, which ranked third in the control group and sixth in the cardioprotective diet group. There was no significant difference between groups in the amount and cost of alcohol consumed after 12 weeks of following the dietary advice; however, there was a significantly lower cost of non-alcoholic drinks for the cardioprotective group. Both groups were given the same advice about alcohol: that it could be consumed in moderation, with a recommendation of no more than 3 units of alcohol per day (and a maximum of 21 units in a week) for men and no more than 2 units of alcohol per day (maximum 14 units in a week) for women. Specific advice to avoid sugar-sweetened beverages was provided to the cardioprotective group; however, advice to the control group aligned with the EatWell plate which grouped these beverages (with advice provided to moderate intake) together with other discretionary foods such as cakes, biscuits and crisps.
The perception that healthier foods are less affordable is frequently cited as a barrier to improving dietary habits( Reference Haynes-Maslow, Parsons and Wheeler 32 , Reference Williams, Abbott and Thornton 33 ); however, the current study suggests this is not the case when manipulating habitual intake under tightly controlled trial conditions and costing foods as consumed. Implementing similar dietary changes in priority groups (i.e. those on lower incomes with poorer health outcomes) could, however, be challenging for a number of reasons. People on lower incomes spend a greater proportion of their income on food overall( 34 ), making them more vulnerable to rising food costs, and there is evidence that those with less money to spend on food are more likely to purchase energy-dense foods with a higher proportion of refined grains, added sugars and fats as an economic strategy to save money( Reference Drewnowski, Monsivais and Maillot 35 ). While the cost of changing to foods that are more consistent with dietary guidelines may not be greater for people with more elastic food budgets, the same may not be the case for those with less flexibility. For those with families particularly, there is the inherent risk that purchasing different foods will be more expensive if the new food is not popular with children, resulting in more acceptable alternatives having to be purchased( Reference Kennedy, Hunt and Hodgson 36 ) – thus increasing overall household food costs. These barriers may be amenable to intervention through programmes directly targeting lower-income families; a recent evaluation of a sustained programme for disadvantaged families in Australia suggested that interventions focused on food budgeting skills may be promising. Key concepts on cost included in that programme were meal and food purchase planning based on the proportion of food budget to be spent on different food groups and price per kilogram principles for comparing individual food items( Reference Pettigrew, Moore and Pratt 37 ). However, it is acknowledged that for many individuals, sociocultural barriers to the adoption of healthier food habits (such as family norms, financial insecurity, lack of choice in where food is purchased from) may be more important than food purchasing knowledge or skills per se ( Reference Kennedy, Hunt and Hodgson 36 , Reference Hardcastle and Blake 38 ). Other factors may influence consumers’ perceptions of the relative cost of food. For example, rather than just considering the cost of food at the point of sale, consumers may factor in other attributes they perceive as contributing to expense but not directly related to cost. These include the shelf-life of individual food items, potential for spoilage during transport and storage, and changes to the quality of different food items over time( Reference Haynes-Maslow, Parsons and Wheeler 32 ). In this way, fresh fruit may be viewed by consumers as more ‘expensive’ than canned fruit as they may spoil during transport or storage, whereas the canned counterparts by contrast are perceived to retain their quality indefinitely.
A key strength of the present study is the robustness of the dietary data, taken from 4 d food diaries with detailed information about actual foods consumed, which is not possible to obtain from FFQ. The dietary data correlated well with objective biomarkers of dietary intake( Reference Reidlinger, Darzi and Hall 16 ) and the food price data reflect the cost of diets as actually consumed by the individual participants. The baseline food expenditure (equivalent to £42·84 per week) was comparable to estimates of household expenditure on foods and non-alcoholic drinks in England (a mean of £53·30 per week)( 39 ), which gives us confidence in our analysis methods. We acknowledge that spending was much greater than in a recent study using similar methods to estimate the dietary cost of foods as consumed by people participating in the NDNS, which reported a mean cost of £2·84 per day (equivalent to £19·88 per week) for those aged 40–49 years( Reference Timmins, Hulme and Cade 9 ). However, this discrepancy is likely to be due to the use of the DANTE food price database, based on 2004 food prices( Reference Timmins, Hulme and Cade 9 ), and not directly comparable with the current study which used 2013 prices. Food intake pre- and post-intervention was compared, providing valuable insight into how advice to improve overall dietary pattern affects the food purchasing patterns of individuals. Several limitations should also be acknowledged. Assumptions made in the costing of food products including package size, brand and availability at each of the supermarkets may not reflect the characteristics of the foods actually consumed by individuals as recorded in diet diaries. Food costs were calculated from 4 d food diaries recorded by participants recruited from multiple cohorts over a 2-year period and there may have been price, food supply and social changes (such as employment and wider economic measures) impacting on food purchase decisions by individuals recruited to the study. Participants were provided with some food pantry items to assist with compliance to the allocated dietary intervention and this may have affected other food purchasing decisions – although both dietary interventions were provided with similar food items and quantities so any such influence should have affected both groups equally. Detailed data were not collected on other factors known to affect intake such as with whom and where food was eaten, level and confidence in cooking skills, availability of adequate storage facilities and kitchen equipment, as well as factors such as proximity to shops and car ownership. Such data would be important considerations for future studies, particularly in the analysis of cohort or survey diets.
Conclusion
The current study suggests that modifying habitual intake to achieve a cardioprotective diet, using the actual cost of foods as consumed, is not more expensive than baseline or conventional UK dietary food costs. The identification of specific food groups (specifically fish and snack foods) that may be a cost concern for people modifying their food intake is potentially useful for nutritionists and dietitians tailoring nutritional interventions for CVD prevention for individuals and populations. The use of theoretical models of dietary patterns and costs may not reflect the actual food choices made by individuals provided with advice to improve the quality of their existing diet. Further research focused on actual costs of adopting cardioprotective dietary advice by people with lower incomes, families and those from less advantaged backgrounds is warranted.
Acknowledgements
Acknowledgements: The authors thank the participants from the CRESSIDA study, and the CRESSIDA study investigators (Wendy Hall, Julia Darzi, Virginia Govoni, Sarah Berry, Zoe Maniou) for their support in conducting the CRESSIDA study, from which the dietary data for the present study were obtained. Financial support: This research received no specific grant from any funding agency in the public, commercial or not-for-profit sectors. The CRESSIDA study (from which the dietary data analysed in this research were obtained) was supported by funding from the UK Food Standards Agency, Department of Health and Public Health England. Several food companies also donated food products to the CRESSIDA study to aid compliance to the intervention. Funders and donor companies had no role in the design, analysis or writing of this article. Conflict of interest: D.P.R. reports no conflict of interest. L.M.G. is a recipient of research support in the form of two Diabetes UK project grants (grant numbers BDA 12/0004473 and BDA 14/0004967). T.A.B.S. is the scientific governor of the British Nutrition Foundation and honorary nutritional director of HEART UK. Authorship: All authors were involved in the design of the study including methods for data collection and data analysis. D.P.R. undertook all data collection, data analysis and wrote the manuscript. All authors commented critically on the manuscript and approved it for submission. Ethics of human subject participation: This study was conducted according to the guidelines laid down in the Declaration of Helsinki and all procedures involving human subjects/patients were approved by the South London Research Ethics Committee (reference 10/H0802/24). Written informed consent was obtained from all participants.


