


By the end of 2016, 40·3 million people were internally displaced due to conflict and violence worldwide – the second highest figure ever reported and twice the number of refugees( 1 ). At the same time, the highest number of internally displaced persons returning was also recorded (6·5 million)( 1 ). While the immediate health impacts of war and displacement are well established( Reference Young, Borrel and Holland 2 – Reference Feikin, Adazu and Obor 5 ), less is known about the population’s health status in post-conflict areas( Reference Devakumar, Birch and Osrin 6 ). Not only armed conflict, but also the early state of peace may create harsh conditions, such as forced migration and collapsed infrastructure( Reference Whyte, Babiiha and Mukyala 7 ). In northern Uganda, a 20-year long (1986–2006) armed conflict forced ~1·8 million people (90 % of the population) into camps for internally displaced persons( 8 ). From 2008 to 2011, the Ugandan Government conducted a resettling programme for people to move from camps to their ancestors’ homes in rural areas. New public health challenges compared with living in camps followed, including higher food insecurity and reduced access to health services, schools and trading markets( 9 ). In the post-conflict period, the global acute malnutrition rates among children aged 6–59 months were higher( 10 ) than reported during the insurgency( Reference Olwedo, Mworozi and Bachou 11 ). Additionally, the prevalence of adult underweight was higher in the post-conflict area compared with national rural estimates in 2011( Reference Schramm, Kaducu and Smedemark 12 ). Previous nutrition studies in post-conflict settings have focused primarily on children <5 years of age and individual-level risk factors( Reference Colombatti, Coin and Bestagini 13 – Reference Paul, Doocy and Tappis 18 ). Moreover, food security and health programmes by humanitarian organizations often focus on conventional target groups such as female-headed households, pregnant women, children and disease-specific groups( Reference Al Gasseer, Dresden and Keeney 19 , 20 ). However, household-level factors may play an important role in alleviating and preventing malnutrition in post-conflict settings( Reference Paul, Doocy and Tappis 18 ). In sub-Saharan Africa non-conflict settings, inconsistent associations between household-level factors and child underweight have been reported, including polygamous marriages and household size( Reference Sellen 21 – Reference Ickes, Heymsfield and Wright 24 ) and headship( Reference Haidar and Kogi-Makau 25 , Reference Onyango, Tucker and Eisemon 26 ). Vella et al. found that child crowding, distance to health centre, latrine ownership and household wealth were important factors for child nutritional status in south-west Uganda (non-conflict setting)( Reference Vella, Tomkins and Nviku 27 ). In northern Uganda, the conflict and post-conflict situation have affected various aspects of the traditional household structures and characteristics, such as household size, headship and location. For example, excess mortality among men during the war and changes in marital conducts have led to more female-headed households( 8 , Reference Dolan 28 – Reference Whyte, Babiiha and Mukyala 30 ). Traditionally in northern Uganda, men are the economic providers for the household and women have limited rights to own land( Reference Whyte, Babiiha and Mukyala 7 ). Thus, female-headed households may be associated with lower socio-economic status (SES), food insecurity and poorer nutritional outcomes( Reference Haidar and Kogi-Makau 25 ). To our knowledge, the influence of household-level factors on nutritional status has not previously been studied among groups other than children, neither in general nor in a post-conflict setting with markedly changing gender roles and household structures. The aim of present study was to examine associations between household-level characteristics and underweight among all age groups in the post-conflict area of northern Uganda.
Methods
Study setting and population
The current cross-sectional study was conducted in 2011–2013 at the Gulu Health and Demographic Surveillance Site (HDSS) in northern Uganda( Reference Schramm, Kaducu and Smedemark 12 ). The Gulu HDSS covers a rural area of 250 km2 named Awach sub-county of Gulu District, 30 km from Gulu Municipality. The population are mainly peasants relying on small-scale subsidized farming. All registered residents of the Gulu HDSS were eligible to participate (n 16 523 in 2012). Trained field assistants visited the households and interviewed residents aged ≥15 years, and caregivers were interviewed about residents aged 0–15 years. In cases where household members were not present, the household was revisited up to three times. Overall, household non-response was 11·2 % (n 353) and the individual non-response was 28·5 % (n 4730). Among non-responding individuals, 45·9 % were female, the median age was 15·1 (interquartile range 7·2–26·8) years and 31·9 % were school-aged children aged 5–14 years.
Anthropometry
Weight and height were measured with participants wearing light clothes and without shoes. Weight was measured to the nearest 0·5 kg using a mechanical flat scale (Seca model 762, Germany). Height was measured to the nearest 0·1 cm using wooden measuring boards with fixed foot-pieces and mobile head-pieces (Gulu District Health Office). For children aged 0–24 months, weight was measured with a mechanical circular dial scale to the nearest 0·1 kg (Seca model 310) and recumbent length was measured with the child lying on a measuring board with an upright headboard and a sliding foot-piece (UNICEF, SO114530, portable baby/child L-hgt mea.syst/SET-2).
In the study we focused on one type of undernutrition as our outcome: underweight. Underweight was chosen because it reflects the current nutritional status in the post-conflict setting, whereas stunting reflects chronic malnutrition over a long period and may capture conflict exposures. Additionally, underweight was the most common form of malnutrition across all age groups (Gulu HDSS, unpublished results).
For participants aged >19 years, underweight was classified using the WHO cut-off for BMI of <18·5 kg/m2. For individuals aged 0–19 years, the WHO AnthroPlus software( 31 ) was used to generate Z-scores for anthropometric indices. Underweight was defined as BMI-for-age below –2sd of the median BMI-for-age of the National Center for Health Statistics (NCHS)/WHO reference population for individuals aged 5–19 years and as weight-for-age below –2sd of the median weight-for-age of the WHO growth standards for individuals aged <5 years. We excluded pregnant women (n 296), individuals with missing/implausible values (<−5sd and >5sd) in anthropometric measurements (n 95), physically disabled (n 47), drunken individuals (n 2) and one dwarf. The study sample consisted of 11 312 individuals.
Household-level variables
Household and household memberships were defined according to the criteria of the INDEPTH Network( 32 ). Household size was included as a categorical variable, with the average household size of seven members as the reference group. Gender of household head and polygamy were included as binary variables. Child crowding, defined as the number of children <5 years of age per room in the household, was included as a binary variable, with 0–1 child/room as the reference group. We also constructed a child-to-adult ratio as the number of children (<15 years of age) to the number of adults in the household. SES was assessed based on principal component analysis( Reference Vyas and Kumaranayake 33 ) as most of the study population are subsistence farmers with no stable income. For the SES variable we used the first component with the eigenvalue of 1·91309, with the following information on household assets and living standards (corresponding loading values): type of housing (0·1390), water source (0·2085), type of garbage disposal (0·2027), ownership of farm land (−0·0448), livestock (0·0175), domestic animals (0·3576), cattle (0·3400), households assets (kerosene lamp, bicycle, phone, charcoal stove, watch and radio) (0·5312), member of a community savings group (0·3196) and had a bank account (0·4089) (see online supplementary material, Supplemental Table 1).
We included two variables for the nutritional status of the household: (i) living with an adult member who was overweight, coded as 1 if at least one adult person (>19 years) in the household was overweight (BMI≥25·0 kg/m2); and (ii) living with a person who was stunted, coded as 1 if at least one person in the household was stunted (length/height-for-age<−2sd), besides the participant him/herself. Stunting was defined as being below −2sd of the median height-for-age of the NCHS/WHO reference population for individuals aged 5–19 years and as being below −2sd of the median length/height-for-age of the WHO growth standards for individuals aged <5 years. For stunting among adults (short stature), values of the NCHS/WHO reference population for 19 years of age were applied with the same cut-off (height-for-age<−2sd). Deprived area was defined as extremely remote areas in terms of distance and/or poor accessibility. Such areas were identified by qualitative focus group discussions with local field assistants. When the deprived areas had been identified, households were coded to be in a deprived area or a non-deprived area using household identification numbers and their GPS (Global Positioning System) coordinates, which were available from the HDSS system. Lastly, we included distance to the nearest health centre (in kilometres), calculated using ArcGIS® version 10.3 software by Esri, as a straight line from households to the nearest health centre using GPS coordinates.
Covariates
Age in years was calculated from date of birth to the date of interview. If no official documentation of date of birth was available, self-reported age would be obtained. A historical event calendar with both national and local events and landmarks was used to estimate age. Season was included as a binary variable, where 1 represented individuals who were measured during the ‘hungry season’ (May–July)( Reference Schramm, Kaducu and Smedemark 12 ).
Statistical analysis
Characteristics of the study population were summarized using descriptive statistics: medians and interquartile ranges for skewed continuous variables, and frequencies and percentages for categorical variables. Given that all household members were included in the study, the nutritional status was not statistically independent. Therefore, we used multilevel logistic regression models with random effects and unstructured covariance. In addition, polygamy is common in northern Uganda and seventy-one male participants headed and lived in more than one household. Information for these seventy-one men was collected in the field once, but included in the data set for all households that they were registered in (available from the Gulu HDSS). To account for the seventy-one men appearing more than once in the analytical sample, we used four-level multilevel logistic regression models, adding the individual identification numbers (observations) as a cluster for males. Hence, observations represented level 1 (n 11 388), individuals represented level 2 (n 11 312), households represented level 3 (n 2799) and villages represented level 4 (n 66). An intercept-only model was used to estimate intraclass correlation coefficients to assess the degree of correlation between individuals in the same household and the same village.
Crude and adjusted multilevel models examined associations between household-level characteristics and underweight. Model 1 included the variables household size, gender of household head, polygamy, child-to-adult ratio, living with someone who was stunted, living with someone who was overweight, deprived area, age and hungry season.
Due to high numbers of missing values for SES (37·0 %), child crowding (31·1 %) and distance to the nearest health centre (23·0 %), it was not possible to perform imputations including these variables. Consequently, model 2 included complete cases only (n 6188), to include these variables in addition to variables in model 1. We examined statistical significance of the interaction between household-level variables and gender, as well as household-level variables and age. The P value for the interaction term tested for statistical significance of multiplicative interaction. A two-sided α level of 0·05 was applied for statistical significance and 0·1 for marginal significance. All analyses were performed using the statistical software package Stata version 14 (2015).
Results
Overall, 54·3 % of the participants were girls/women and median age was 12·7 (interquartile range 5·7–30·0) years. In an average household, 17·6 % of members were <5 years old and 46·2 % members were <15 years old. Fourteen per cent of the participants lived in polygamous households, 20·9 % in female-headed households and 13·3 % in deprived areas (Table 1). Overall, more boys/men than girls/women were underweight (16·9 v. 13·9 %, respectively, P<0·01). The prevalence of underweight also differed by age group. For boys/men and girls/women respectively, the prevalence of underweight was 16·6 v. 15·8 % among children aged <5 years (P>0·05); 11·2 v. 9·7 % among children aged 5–12 years (P>0·05); 16·1 v. 8·6 % among adolescents aged 13–19 years (P<0·05); and 23·3 v. 18·3 % among adults aged ≥20 years (P<0·05; Fig. 1). The overall intraclass correlation coefficient for level 3 (household) was 0·195 and for level 4 (village) was 0·041. Hence, ~20 % of the residual variance in underweight in this study population could be explained by common household factors and ~4 % by common village-level factors.
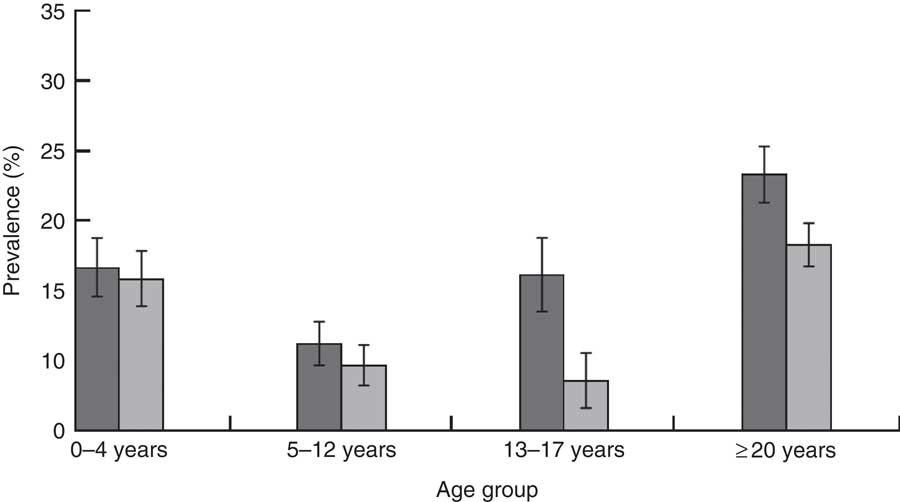
Fig. 1 Prevalence of underweight by age group and gender (
![]() , boys/men;
, boys/men;
![]() , girls/women), with 95 % CI represented by vertical bars, among the study participants (n 11 312), former internally displaced persons living in a rural post-conflict area of northern Uganda, 2011–2013
, girls/women), with 95 % CI represented by vertical bars, among the study participants (n 11 312), former internally displaced persons living in a rural post-conflict area of northern Uganda, 2011–2013
Table 1 Individual and household-level characteristics of the study participants (n 11 312), former internally displaced persons living in a rural post-conflict area of northern Uganda, 2011–2013
IQR, interquartile range; SES, socio-economic status; NCHS, National Center for Health Statistics.
Median and IQR (25th–75th percentile) are presented for continuous variables not normally distributed. Categorical variables are expressed as absolute frequency (n) and percentage (%).
Individuals belonging to more than one household are represented once only.
‡ Underweight defined as BMI<18·5 kg/m2 for individuals >19 years of age, as BMI-for-age below –2sd of the median BMI-for-age of the NCHS/WHO reference population for individuals aged 5–19 years and as weight-for-age below –2sd of the median weight-for-age of the WHO reference population for individuals <5 years of age.
§ 31·1 % (n 3520) missing values for child crowding.
║ In total, 380 households lived in deprived areas.
¶ 23·0 % (n 2600) missing values for distance to the nearest health centre.
** 37·0 % (n 4181) missing values for SES.
Table 2 shows the overall crude and adjusted associations between household-level variables and underweight. In the crude model, living alone or in a small household (2–4 members) was associated with higher odds for underweight compared with living in an average-size household (OR=3·53; 95 % CI 2·47, 5·06 and OR=1·23; 95 % CI 0·99, 1·53, respectively). However, after adjustment in model 1, only living alone remained associated with underweight (OR=1·64; 95 % CI 1·10, 2·46; overall P>0·1). Living in a female-headed v. male-headed household was positively associated with underweight in the crude model, but the association fully attenuated in model 1 (OR=1·01; 95 % CI 0·86, 1·18). Living in the same household as a person who was stunted and living in a deprived area were positively associated with underweight (OR=1·19; 95 % CI 1·04, 1·36 and OR=1·37; 95 % CI 0·97, 1·94; P<0·1). Household factors associated with lower odds of underweight included polygamous v. monogamous households (OR=0·79; 95 % CI 0·65, 0·97) and overweight v. non-overweight households (OR=0·65; 95 % CI 0·49, 0·87). For model 2 (including additional variables with missing observations), increasing distance to the nearest health centre was associated with higher odds for underweight (OR=1·41–1·60), although the association attenuated slightly for the highest quartile (P-trend<0·05). Child crowding was positively associated with underweight (OR=1·23; 95 % CI 0·96, 1·57). No association was found between SES and underweight (Table 2).
Table 2 Associations between household-level characteristics and underweight by multilevel logistic regression among all study participants (n 11 388), former internally displaced persons living in a rural post-conflict area of northern Uganda, 2011–2013
n, number of observations (individuals included in each model); SES, socio-economic status; Ref., reference category.
OR and corresponding 95 % CI presented by four-level multilevel logistic regression models, where level 1 represents observations, level 2 represents individuals, level 3 represents households and level 4 represents villages.
Model 1 adjusted for age, sex, season when the anthropometric measurements were taken, sex of household head, polygamy, household size, child-to-adult ratio, living with ≥1 stunted person, living with ≥1 overweight person and deprived area.
Model 2 adjusted for age, sex, season when the anthropometric measurements were taken, sex of household head, polygamy, household size, child-to-adult ratio, living with ≥1 stunted person, living with ≥1 overweight person, deprived area, child crowding, distance to health centre and household SES.
Entries in bold mark statistically significant associations. Significance level: *P<0·10 and †P<0·05 by testparm (Stata version 14).
We found statistically significant interactions between gender and headship, gender and polygamy, age and headship, and age and living with someone who was stunted (all P<0·05), as well as a marginally significant three-way interaction between headship, gender and age (P<0·1). Therefore, we repeated model 1 stratified by gender and age groups (0–4, 5–12, 13–19 and ≥20 years). Tables 3 and 4 show the gender- and age-stratified models for boys/men and girls/women, respectively. In stratified models, higher odds for underweight when living alone were only seen among adult men (≥20 years: OR=3·23; 95 % CI 1·22, 8·59). The association between headship and underweight differed across gender and age group: living in a female-headed v. male-headed household was associated with statistically significant higher odds of underweight among adult men aged ≥20 years (OR=2·18; 95 % CI 1·11, 4·27) and among girls aged 0–4 years (OR=1·51; 95 % CI 0·97, 2·34), and statistically significant lower odds among adolescent women aged 13–19 years (OR=0·46; 95 % CI 0·22, 0·97). Living in a polygamous v. monogamous household was associated with statistically significant lower odds for underweight among adult men (≥20 years: OR=0·46; 95 % CI 0·25, 0·82) and adolescent women (13–19 years: OR=0·44; 95 % CI 0·18, 1·08), but no associations was seen in the other age groups. Girls aged 0–4 years who lived in a household with the highest child-to-adult ratio had lower odds of being underweight compared with their counterparts living in households with the lowest ratio (OR=0·50; 95 % CI 0·30, 0·85; overall P<0·1; Tables 3 and 4).
Table 3 Age-stratified associations between household-level characteristics and underweight by multilevel logistic regression among boys and men (n 5248), former internally displaced persons living in a rural post-conflict area of northern Uganda, 2011–2013
n, number of observations (individuals included in each model); SES, socio-economic status; Ref., reference category.
OR and corresponding 95 % CI are presented by four-level multilevel logistic regression models, where level 1 represents observations, level 2 represents individuals, level 3 represents households and level 4 represents villages.
All OR adjusted for age, sex, season when the anthropometric measurements were taken, sex of household head, polygamy, household size, child-to-adult ratio, living with ≥1 stunted person, living with ≥1 overweight person and deprived area.
Entries in bold mark statistically significant associations. Significance level: *P<0·10 and †P<0·05 by testparm (Stata version 14).
Table 4 Age-stratified associations between household-level characteristics and underweight by multilevel logistic regression among girls and women (n 6140), former internally displaced persons living in a rural post-conflict area of northern Uganda, 2011–2013
n, number of observations (individuals included in each model); SES, socio-economic status; Ref., reference category.
OR and corresponding 95 % CI are presented by four-level multilevel logistic regression models, where level 1 represents observations, level 2 represents individuals, level 3 represents households and level 4 represents villages.
All OR adjusted for age, sex, season when the anthropometric measurements were taken, sex of household head, polygamy, household size, child-to-adult ratio, living with ≥1 stunted person, living with ≥1 overweight person and deprived area.
Entries in bold mark statistically significant associations. Significance level: *P<0·10 and †P<0·05 by testparm (Stata version 14).
Discussion
In the present study among former internally displaced persons living in a rural post-conflict area of northern Uganda, we found that the associations between household-level factors and underweight differed across gender and age. Living in a female-headed v. male-headed household was associated with higher odds for underweight among adult men and girls aged <5 years, but lower odds among adolescent women. Living alone, especially among adult men, living in a household with a stunted member, living in a deprived area or further away from a health centre were all associated with higher odds of underweight. In contrast, living in a polygamous household, higher child-to-adult ratio and living in a household with an overweight member were associated with lower odds for underweight.
We are not aware of other studies comparing adult underweight and household headship. However, in a previous study examining individual-level risk factors for adult underweight, divorced men, but not divorced or widowed women, had a higher odds for being underweight( Reference Schramm, Kaducu and Smedemark 12 ). This gender discrepancy may be explained by the social changes in northern Uganda described by Dolan as collapsing masculinities and the proliferation of small men( Reference Dolan 28 ), which may apply particularly to men living in female-headed households. Further adjustment of previously identified individual-level risk factors for underweight (marital status, alcohol, smoking)( Reference Schramm, Kaducu and Smedemark 12 ) did not change the estimates in the present study (data not shown). Findings from previous studies among children aged <5 years have been inconsistent; a study from Ethiopia supports our finding of a higher prevalence of childhood underweight among female-headed households( Reference Haidar and Kogi-Makau 25 ). However, in Kenya no difference in childhood underweight according to headship was found( Reference Onyango, Tucker and Eisemon 26 ). Both studies used small study samples (n<200) and no statistical tests with adjustment for confounding factors were performed( Reference Haidar and Kogi-Makau 25 , Reference Onyango, Tucker and Eisemon 26 ). Shell-Duncan and Obungu Obiero( Reference Shell‐Duncan and Obungu Obiero 34 ) found interaction between headship and SES in Kenya, whereby children of poor female-headed households had a higher risk of undernutrition (measured by wasting and stunting), but children of economically sufficient female-headed households had a lower risk of undernutrition, compared with children in male-headed households in general. We did not find such an interaction (data not shown). Instead, the discrepancy may be explained by differences in the nature of female-headed households, age of the household head and cultural practices. In Kenya( Reference Onyango, Tucker and Eisemon 26 , Reference Shell‐Duncan and Obungu Obiero 34 ) female headship was mainly due to migrant labour of the husband who may still support the household economically, whereas in our study setting women of female headship had the main provider responsibility. We conducted further descriptive analyses and found that individuals living in female-headed households were on average older, 40 % were widows, more girls/women than boys/men lived in female-headed households, the households were smaller in size, fewer lived in deprived areas, there was less child crowding, household stunting and overweight, and the female-headed households had lower SES (see online supplementary material, Supplemental Table 2).
In contrast to our findings, a qualitative study from another area of Uganda reported polygamy to be an important risk factor for childhood malnutrition( Reference Ickes, Heymsfield and Wright 24 ). Dilution of resources was hypothesized as the cause for the negative impact of polygamy on nutritional status( Reference Hadley 23 , Reference Ickes, Heymsfield and Wright 24 ). In line with our findings, previous quantitative studies from other sub-Saharan African countries found no association between polygamy and underweight among children( Reference Sellen 21 , Reference Hadley 23 , Reference Shell‐Duncan and Obungu Obiero 34 , Reference Lawson, James and Ngadaya 35 ). In northern Uganda, polygamy is likely to be a sign of wealth, due to bridal price and increased financial responsibilities for men with more wives( Reference Ickes, Heymsfield and Wright 24 ). However, this explanation is not supported by an association between SES and underweight in the present study. Instead, it may be that social capital is a stronger predictor for nutritional status than SES, which has been found in studies with child mortality in Ethiopia( Reference Fantahun, Berhane and Wall 36 ) and Guinea-Bissau( Reference Sodemann, Rodrigues and Nielsen 37 ). In Uganda, households are key units where resources are pooled together and connected to wider networks( Reference Adelman 29 , Reference Obaa and Mazur 38 ). Social capital and social networks may contribute to improved health and nutritional status by sharing household responsibilities, including food/cooking and caring for children, greater trust and ability to borrow money in case of emergencies, as well as providing/accessing information, advice and guidance( Reference Adelman 29 , Reference Obaa and Mazur 38 , Reference Waterston, Alperstein and Brown 39 ). Thus, small households and living in deprived areas may be a marker for low social capital, whereas polygamy and a high child-to-adult ratio may be markers for high social capital. Adelman found that increasing social network size, particularly membership of farmers’ groups, was significantly positively associated with increased height-for-age Z-score among children in internally displaced persons’ camps during the insurgency in Uganda( Reference Adelman 29 ). In line with our findings, Adelman( Reference Adelman 29 ) and Johnecheck and Holland( Reference Johnecheck and Holland 17 ) also reported no variation in child height-for-age Z-score by SES.
We found a positive association between deprived areas and underweight. Likewise, increasing odds for underweight were seen with increasing distance to the nearest health centre. This is in line with a previous study from south-west Uganda( Reference Vella, Tomkins and Nviku 27 ). Yet, the question of whether poor and unhealthier people live in deprived areas or living in a deprived area causes underweight is unanswered. Still these findings indicate that even in this post-conflict rural area there are geographical variations in underweight, which needs further investigation.
Strengths and limitations
To our knowledge, the current study is the first examining associations between nutritional status and household-level factors among all age groups in the same population. Additionally, these associations have not previously been investigated in post-conflict settings. The application of the multilevel models is a strength compared with previous studies examining household factors. It is plausible that unmeasured confounders confused the observed associations. Potential unmeasured confounders could be HIV/AIDS or other disease. The estimated HIV prevalence in 2011 for mid-northern Uganda was 10·1 % among women and 6·3 % among men( 40 ). HIV is highly stigmatized in northern Uganda, thus it was not possible to obtain reliable information without compromising the community-based study design( Reference Schramm, Kaducu and Smedemark 12 ). Educational attainment of mothers and household heads has been found to mitigate malnutrition issues in various settings( Reference Leroy, Habicht and González de Cossío 41 ). We did not include information on education since it was highly correlated with age because universal primary education was not introduced in Uganda until 1997. A major limitation of the study is the high numbers of missing values for SES, child crowding and distance to health centre. The high number of missing data is due to data being collected at different time points. We assumed data were missing at random (not dependent on SES itself). However, we found significant differences in the outcome variable and household-level factors between observations with missing and with complete information (see online supplementary material, Supplemental Table 3). This may explain why the estimates in models 1 and 2 (Table 2) are different. Finally, the study’s conclusions may be limited to post-conflict populations with similar socio-economic and cultural characteristics where the gender roles are similar.
Conclusion
In summary, we found gender- and age-specific associations between household-level factors and underweight. Associations between household-level characteristics and underweight are likely to reflect local social capital structures. International and local organizations should understand and adapt to these local social capital structures before implementing conventional health and nutritional interventions.
Acknowledgements
Acknowledgements: The authors are very grateful to all residents in Awach for their willingness to participate in the study and the Gulu HDSS field assistants for their determined hard work. The authors wish to thank: the Gulu District Health Office for its overall support and collaboration; the data management team at the Post-conflict Primary Health Care project at Gulu University and the team of the ENRECA project; Siri Aas Smedemark for her assistance in field supervision and data cleaning; and Professor Nadine Schuurman and her students Rebecca Gunderson and Kendra Munn from the Simon Fraser University for assisting with the spatial data calculations. Financial support: The study was supported by DANIDA (DFC project codes 54-08-AAU and 12-057-SDU), DANIDA Fellowship Centre (S.S., grant number R272-A14195) and the Lundbeck Foundation (S.S. and M.S., grant number R94-A7993). The Gulu District Health Office in Uganda supported the study by supplying wooden measuring boards for children and adults. DANIDA, the Lundbeck Foundation and the Gulu District Health Office had no role in the design, analysis or writing of this article. Conflict of interest: None. Authorship: S.S., J.N., F.O.K. and M.S. formulated the research question. S.S., F.O.K., E.O. and M.S. designed and initiated the study. S.S., C.L.O. and F.O.K. trained field assistants and supervised data collection. S.S. and C.L.O. performed data cleaning and data management procedures. S.S., J.N. and M.S. analysed the data. S.S. and J.N. wrote the article with major contributions from F.O.K, C.L.O., E.O. and M.S. All authors reviewed and approved the manuscript. Ethics of human subject participation: This study was conducted according to the guidelines laid down in the Declaration of Helsinki and all procedures involving human subjects were approved by the Research and Ethics Committees of Gulu University and the Uganda National Council for Science and Technology (reference SS 2363). Written informed consent was obtained from all subjects and additional written consent was obtained from caregivers for participants aged <18 years.
Supplementary material
To view supplementary material for this article, please visit https://doi.org/10.1017/S1368980018001581


