


1. Introduction
Social games in humans and agents provide insight into underpinnings of networked behaviours, where interactions from one partner can influence subsequent experiences with others. By augmenting game-playing algorithms, such as reinforcement learners with abstracted models of human processes, we can attempt to both orchestrate specific outcomes for our functional networks (such as encouraging more cooperative, higher-scoring play when partners do not appear to be exploitative) and emulate systems of people, that our models might be made more robust. We have seen that in some contexts, adding humaniform traits to task-oriented learners can produce benefits—such as increasing their proficiency through goal-directed search (Belkaid et al., Reference Belkaid, Cuperlier and Gaussier2017)—making their usage also valuable to those concerned with measures of efficiency. Additionally, researching human traits in this manner facilitates more rigorous and replicable testing of domains within psychology that have practical limitations and roadblocks to replication. Experimental studies into networked interactions such as Rand et al. (Reference Rand, Arbesman and Christakis2011) and Melamed et al. (Reference Melamed, Harrell and Simpson2018) for example, are classed as ‘large-scale’ empirical behaviour analyses that leverage online technologies to connect players, and yet the networks they examine have a mean node degree of $\sim20$
players. This contrasts heavily with artificial models, in which even smaller-scale play networks can maintain node degrees of over 100 (Collenette et al., Reference Collenette2018b). With the assistance of computational modelling, we can attempt to extend this research at much greater scale and speed whilst combining it with alternative methodologies.
$\sim20$
players. This contrasts heavily with artificial models, in which even smaller-scale play networks can maintain node degrees of over 100 (Collenette et al., Reference Collenette2018b). With the assistance of computational modelling, we can attempt to extend this research at much greater scale and speed whilst combining it with alternative methodologies.
In social dilemmas such as the iterated prisoner dilemma (IPD), we see increased proportions of cooperative behaviours when using altered algorithms over their base counterparts (Collenette et al., Reference Collenette2017b, Reference Collenette2018b; Feehan & Fatima, Reference Feehan and Fatima2022). This increased proportion is commonly observed in human players also; in fact, it is a widely touted trait in literature that people are generously cooperative in single-round and short-term IPD games (Rand et al., Reference Rand, Arbesman and Christakis2011; Melamed et al., Reference Melamed, Harrell and Simpson2018)—despite the mathematical irrationality of such choices. Whilst there is evidence that this generosity either decays (Gallo, Reference Gallo2022; Hauk & Nagel, Reference Hauk and Nagel2001), or certainly fluctuates (Wilson & Wu, Reference Wilson and Wu2017), over time in longer repeated games, its presence as a proportion of play behaviours is often 50% or greater. This human cooperation can then, in its own right, be manipulated further; as one example, the underlying structure of game elements can cause changes in player choices when altered beyond intuitive perception (Wrightsman et al., Reference Wrightsman, O’Connor and Baker1972; Colmanet al., 2018). This finding in particular has been replicated in such augmented agents (Feehan & Fatima, Reference Feehan and Fatima2022), even given the seemingly simplistic nature of their representations of human mechanisms. This leaves open the scope for more research into the extent of the replicability of human trends with such models, and if this is an isolated comparable context, or a key framework that easily shifts agent modelling that little more humanwards.
Can we take human research conclusions and reverse-engineer embedded human factors into our agents using these simple mechanisms, or are more complex frameworks required? From what breadth of psychological research do we select data to build our theoretical architectures on? Naturally, the facet this research presents is a small alteration in the grand scale of augmenting learners to behave more humanlike; incorporating the mood states of others into agent observations, altering perceptions of payoffs and driving behavioural selection from a moody standpoint. These avenues of investigation may provide the groundwork, however, for more detailed advancement in future explorations of such systems; such as combining the mood model with a personality model, for example. If the reliability of the more simplistic, core processes can be established, development of complex mechanisms (integrated with greater systems of emotion, in one instance) will be more easily facilitated.
We wish to deepen the literature available on the behavioural reactivity of such algorithms by using multi-agent simulations to provide a greater breadth of data on their nature. We also seek conditions in which these algorithms may replicate human trends of behaviour.
In this piece of research, we expand on this by introducing the ability to terminate ongoing partnerships to a dynamic network containing moody agents, in comparison with both unaltered reinforcement learner counterparts and an even broader selection of strategies for playing the Iterated Prisoner’s Dilemma. By introducing this aspect, we take the first step towards testing more complex partner evaluation decisions, whilst expanding on the dynamic network testing that has already revealed these moody agents’ contributions to changing graph behaviour (Collenette et al., Reference Collenette2018b). Link termination, a form of unilateral partner judgement (Hauk & Nagel, Reference Hauk and Nagel2001), is just one element of potentially complex and nuanced network judgementsFootnote 1. Both network dynamism and mutable interaction relationships have been examined previously in depth in evolutionary networks (Perc & Szolnoki, Reference Perc and Szolnoki2010), but never with this choice of algorithm. By building in this initial probe atop existing literature, we can begin to make comparisons to human-based social research such as Rand et al. (Reference Rand, Arbesman and Christakis2011) and Gallo (Reference Gallo2022) in this unique context.
Additionally, we can compare and contrast how far simplistic deployments of human constructs go in modelling human trends and also evaluate any pragmatic applications of the resultant behaviours. The primary contribution this paper seeks to establish is an elucidation on whether link termination techniques and varied levels of dynamic networks interact with the moody algorithm—either to aid or to hinder cooperative behaviour. Secondarily, it seeks to provide reinforcement of previous conclusions with the moody algorithm through some degree of replication of past work. Where previous research has evaluated dynamic networks (Rand et al., Reference Rand, Arbesman and Christakis2011; Melamed et al., Reference Melamed, Harrell and Simpson2018) and decision-based link termination (Hauk & Nagel, Reference Hauk and Nagel2001; Wang et al., Reference Wang, Suri and Watts2012) separately to moody reinforcement learning (Collenette et al., Reference Collenette2017b, Reference Collenette2018b; Feehan & Fatima, Reference Feehan and Fatima2022), our paper brings these together for the first time.
Interestingly, we discovered that there is only one decision mechanism (out of the four tested) that facilitates consistent increased cooperation and connectivity for more human learners over their traditional counterparts—mimicking the trends seen in human players in Rand et al. (Reference Rand, Arbesman and Christakis2011) and to some extent Gallo (Reference Gallo2022). The best condition for encouraging this behaviour selected partners based on an agent’s own score against said partner, with a threshold generous enough to allow for mistake-making. In other conditions, we found these moody agents performed just as poorly as other reinforcement learners in terms of cooperationFootnote 2, and regardless of condition, simple strategies such as Tit-for-Tat (TFT) outperformed others in metrics of cooperation and connectivity. This last finding agrees with past research (Collenette et al., Reference Collenette2018b). We also found that, in novel ground for the research literature, mood interacts in a complex, inconsistent nature with partner decision processes that warrants more detailed further study.
Initially, in Section 2, we outline the key theoretical and practical background knowledge necessary for understanding how manipulation of the structure and nature of interaction within dynamic networks may lead to different behavioural outcomes. We describe the dilemma itself, how reinforcement learning has been used previously in this problem space, the past research utilizing these behavioural augmentations and how voluntary interaction and dynamic networks have been studied in relation to the IPD until this point. In Section 3, we present the experimental design of our simulations, structured to evaluate two key previously untested independent variables for this context, with these algorithms. Section 4 details the data gathered from such experiments, with Section 5 being the analysis and evaluation of each experimental condition’s results. Finally, we propose some connecting conclusions between human and agent-based research and suggest some avenues of further work.
Table 1. Traditional payoff matrix for the two-player Prisoner’s Dilemma game (Wooldridge, Reference Wooldridge2013).

2. Background
2.1. Iterated prisoner’s dilemma
The iterated prisoner’s dilemma is a well-examined behavioural paradigm within artificial and human contexts alike, being a social risk-taking game in which players typically select their behaviours without nuanced communication. In the basic version of the dilemma, two players choose either a cooperative or a non-cooperative behaviour and submit it to their opponent, without conversing or forming prior agreement. This selection of behaviours results in a variety of rewards (or lack thereof) for either player, depending on the combination (see Table 1 for the classic payoff matrix, as used in our own research). Overall, there are four primary outcomes; Temptation (betraying your opponent by defecting when they cooperate), Reward (mutual cooperation between parties), Punishment (mutual defection between parties) and Sucker (when an agent finds themselves betrayed by a partner).
In the single-round version of the dilemma, the Nash Equilibrium is to defect (Wooldridge, Reference Wooldridge2013), thus protecting oneself from exploitation and possibly exploiting the opponent should they be so generous as to cooperate. The lack of sustained interaction means establishing trustworthiness, communicating implicit desires for mutual behaviour and long-term social punishments are not factors prioritized in behavioural selection. However, when play is iterated over many rounds, these become greater priorities for players. Here, the dilemma presents more of an interest in maximal gain for both partners as opposed to simply mitigating risks; there is the potential for mutual optimization of rewards over mere self-protection, and the necessity of establishing oneself as a generous player if this cooperative outcome is to be maintained.
Axelrod (Reference Axelrod1984), a seminal text on cooperation in the Prisoner’s Dilemma, outlines a host of simplistic strategies for playing the game, alongside demonstrating the capacity of TFT to perform well in PD round-robin tournaments. It functions on the basic principle of Cooperate first, and then in each round thereafter repeat the previous-round behaviour of the partner player—thereby returning unfair plays of defection, but forgiving quickly, and retaining the ability to establish mutual cooperation when it is offered. This strategy is used frequently as a comparator in modern research and still performs well despite lack of complexity—even against machine learning techniques (Collenette et al., Reference Collenette2018b). Over the years, one alternative named Win-Stay Lose-Shift (WSLS) has also become a prominent simple strategy, and has frequently been pitted in competition with TFT. Sometimes framed as a rudimentary form of reinforcement learning, WSLS operates on the principle of maintaining the current behavioural choice if it is satisfied in the outcome (i.e. ‘winning outcomes’ such as T or R) and changes behavioural choice if it is dissatisfied (i.e. receiving P or S). Both of these strategies exhibit traits of Axelrod’s key tenets for strategic success in the IPD: the capacity to be nice, or in plain terms, to never defect first. Naturally, this is more true of TFT than it is for WSLS—though certain literature would suggest that this provides WSLS with an advantage (Nowak & Sigmund, Reference Nowak and Sigmund1993; Imhof & Nowak, Reference Imhof, Fudenberg and Nowak2007). These are just two of innumerable IPD schema used in research since Axelrod’s day and are two that will be used as comparators for our own purposes.
Critically for a modern analysis, Axelrod discusses the dilemma primarily in its fundamental form, not inclusive of factors such as the ability to walk away from an interaction—which is the subject of this very paper, and of dozens like it (Stanley et al., Reference Stanley, Ashlock and Tesfatsion1993; Hauk, Reference Hauk2001; Hauk & Nagel, Reference Hauk and Nagel2001; Rand et al., Reference Rand, Arbesman and Christakis2011; Wilson & Wu, Reference Wilson and Wu2017). Before we delve into this extension of the IPD, however, we will first elaborate on the main strategies under evaluation in this work; a reinforcement learning strategy and its recently augmented counterpart equipped with a model of mood.
2.2. SARSA
State-action-reward-state-action, or SARSA, is an on-policy reinforcement learning algorithm that estimates the value of the policy being followed whilst exploring. It is named such as, on any given learning time step, it takes the current state (in our instance, the bounded move history of each partner, of length 7), in which it takes an action (in our instance, either C or D), to a new state, in which it observes its reward (see Table 1). It updates its state-action value function through the choice of its next action following the same current policy. Actions are selected in SARSA (and the variant of SARSA introduced in Section 2.3) using $\epsilon$
-greedy behavioural selection.
$\epsilon$
-greedy behavioural selection.
More thorough detail for SARSA can be found in Sutton and Barto (Reference Sutton and Barto2018). In this paper, the experimental setup for SARSA is identical to in Feehan and Fatima (Reference Feehan and Fatima2022). The equation for updating Q (the learned value) for each state-action combination is given below as it is pertinent for comparison with the mood-augmented version detailed later in the paper. Let s represent the state, t denote the current time step of a learning epoch, a the action taken in that state, where $\alpha$
is the learning rate (typically 0.1),
$\alpha$
is the learning rate (typically 0.1), $\gamma$
is the discount factor (typically 0.95), and r is the reward received:
$\gamma$
is the discount factor (typically 0.95), and r is the reward received:
 \begin{align} \begin{array}{l} Q(s_{t}, a_{t}) = Q(s_{t}, a_{t})+ \alpha[r_{t+1}+\gamma Q(s_{t+1}, a_{t+1}) - Q(s_{t},a_{t})] \end{array}\end{align}
Reinforcement learning has previously been used to explain human conditional cooperation behaviours in the context of the repeated Prisoner’s Dilemma (Horita et al., Reference Horita2017) and other games (Erev & Roth, Reference Erev and Roth1998). SARSA was chosen for this particular research as it forms the basis of the augmented learning algorithm Moody SARSA (Collenette et al., Reference Collenette2017b, Reference Collenette2018b), which has shown promise in social dilemma contexts for a variety of reasons that are discussed in the following section. Outside of this, SARSA has been used across both IPD literature (Gao, Reference Gao2012; Lin et al., Reference Lin2019) and human behavioural modelling (Shteingart & Loewenstein, Reference Shteingart and Loewenstein2014)—with our ongoing research serving to expand knowledge in both of these domains.
2.3. Moody SARSA
In recent years, alterations to SARSA have been implemented with the aim of improving its cooperativeness in a variety of multi-agent scenarios. One simplistic and yet effective augmentation has been the addition of an influential mood parameter, with a single-variable model embedded at different points in processing that alters the behaviour of the foundational architecture. This new algorithm has shown to not only to have greater cooperation rates over SARSA naturally (Collenette et al., Reference Collenette2017b), but to also react similarly to humans when the structure of the IPD is experimentally manipulated (Feehan & Fatima, Reference Feehan and Fatima2022) and increase cooperation in networks of mixed players also (Collenette et al., Reference Collenette2018b). Crucially, the extension of the learning process in this instance utilizes a conceptualization of mood as opposed to emotions, as in previous work with the IPD such as Bazzan and Bordini (Reference Bazzan and Bordini2001), where models such as the Reference Ortony, Clore and CollinsOrtony, Clore and Collins framework (Ortony et al., Reference Ortony, Clore and Collins1988; Clore & Ortony, Reference Clore and Ortony2013) are used instead. Mood as a simpler mechanism stands both on its own, as previously discussed, but can work in combination with these more complex frameworks also (Collenette et al., Reference Collenette2017a, Reference Collenette2018a). For these reason, it holds promise in being a viable candidate for an initial test of two further layers to the IPD—one, a different structural manipulation that has also shown to influence human play, and the other being basic, intuitive models of partner evaluation with supporting literary evidence.
First, however, we list the relevant equations and details for the implementation and analysis of a moody agent’s responses. Then, we elaborate on recent data involving the algorithm in literature before situating in the current behavioural experiment.
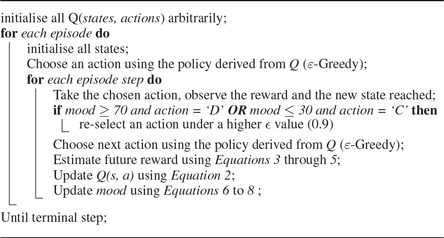
Moody SARSA (henceforth referred to as mSARSA) embodies mood as a real number between 1 and 100, with values above 70 characterized as high mood and below 30 as low mood (Collenette et al., Reference Collenette2017b). High moods are codified by the authors as more risky and cooperative, and lower moods as more rational and defective. This then interacts with SARSA processing at multiple junctures; primarily, in action selection (including action re-selection at low/high mood states), reward estimation (through constraint of the memory space averaged in calculations) and state space (with the inclusion of others’ perceived moods into state-action pairs). Mood is updated based on how an agent perceives its current payoff relative to the average payoff previously attained, adjusted using the Homo Egualis model, valuing both agent and partner equally (Fehr & Schmidt, Reference Fehr and Schmidt1999). If an agent perceives itself to be doing poorly currently in comparison with its past, its mood should decrease. This process was updated in Collenette et al. (Reference Collenette2018b) from a previous iteration, adjusted to facilitate higher moods decreasing more readily. The mood-altered equation for updating Q for each state-action pair is provided below, reproduced from Collenette et al. (Reference Collenette2017b).
 \begin{align} Q(s_{t}, a_{t}) = Q(s_{t}, a_{t})+\alpha[r_{t+1}+\gamma \Psi - Q(s_{t},a_{t})]\end{align}
The rule for the estimation of future rewards ( $\Psi$
) is encapsulated in Equations (3) through (5), reproduced from Collenette et al. (Reference Collenette2017b), where
$\Psi$
) is encapsulated in Equations (3) through (5), reproduced from Collenette et al. (Reference Collenette2017b), where $\textit{m}_i^t$
is the mood of a given agent i at time step t (a
$\textit{m}_i^t$
is the mood of a given agent i at time step t (a $\mathbb{R}$
between 0 and 100).
$\mathbb{R}$
between 0 and 100). $\textit{Mem}_i^a$
is the vector of the set of rewards previously obtained by that agent when using action a, and
$\textit{Mem}_i^a$
is the vector of the set of rewards previously obtained by that agent when using action a, and $|\textit{Mem}_i^a|$
is at maximum 20.
$|\textit{Mem}_i^a|$
is at maximum 20. $\textit{Mem}_i^a(0)$
returns the most recent reward.
$\textit{Mem}_i^a(0)$
returns the most recent reward.
 \begin{align} \alpha_i^t = ( 100 - \textit{m}_i^t ) /100\end{align}
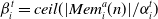 \begin{align} \beta_i^t = \textit{ceil} ( | Mem_i^a(n) | / \alpha_i^t )\end{align}
 \begin{align} \Psi = (n\sum_{0}^{\beta}Mem_i^a(n))/\beta_i^t\end{align}
Mood constrains the depth (denoted with n) of memory consulted to calculate average past reward, but also controls the value $\epsilon$
in
$\epsilon$
in $\epsilon$
-greedy exploration. When an agent’s mood is below 30 and they cooperate, or above 70 and they defect,
$\epsilon$
-greedy exploration. When an agent’s mood is below 30 and they cooperate, or above 70 and they defect, $\epsilon$
increases to 0.9 for that turn and a move is re-selected. Mood is updated and maintained through Equations (6) through (8), reproduced from Collenette et al. (Reference Collenette2017b) and Collenette et al. (Reference Collenette2018b). Let t denote the current time step of a learning epoch,
$\epsilon$
increases to 0.9 for that turn and a move is re-selected. Mood is updated and maintained through Equations (6) through (8), reproduced from Collenette et al. (Reference Collenette2017b) and Collenette et al. (Reference Collenette2018b). Let t denote the current time step of a learning epoch, $p_i^t$
return the payoff of agent i in that time step,
$p_i^t$
return the payoff of agent i in that time step, $\mu_i^t$
denote their average payoff over the elements in
$\mu_i^t$
denote their average payoff over the elements in $\textit{Mem}_i^a$
, and
$\textit{Mem}_i^a$
, and $m_i^t$
denote their mood. Let j denote agent i’s opponent, and let
$m_i^t$
denote their mood. Let j denote agent i’s opponent, and let $\alpha$
=
$\alpha$
= $\beta$
, as in the original model):
$\beta$
, as in the original model):
 \begin{align} \alpha_i^t = (100 - m_i^t{^-{^1}} ) / 100\end{align}
 \begin{align} \begin{array}{l} \Omega_i{_,}{_j{^t}} = \mu_i{^t} - \alpha_i{^t} \cdot max (\mu_j{^t} - \mu_i{^t}, 0) - \beta_i{^t} \cdot max (\mu_i{^t} - \mu_j{^t}, 0) \end{array}\end{align}
 \begin{align} m{_i}{^t} = m{_i}{^t{^-{^1}}} + (p{_i{^t{^-{^1}}}} - \Omega_i{_,}{_j}{^t{^-{^1}}})\end{align}
Algorithm 1: mSARSA Pseudocode, taken from Feehan & Fatima (Reference Feehan and Fatima2022) and originally adopted from Collenette et al. (Reference Collenette2018b).
The result of these alterations is an algorithm that, in comparison with SARSA, cooperates much more frequently in multi-agent network IPD games (Collenette et al., Reference Collenette2017b; Feehan & Fatima, Reference Feehan and Fatima2022). Earlier versions of the algorithm cooperated too frequently, in fact; in Feehan and Fatima (Reference Feehan and Fatima2022) where the strategy was deployed in static networks, the high frequency of interaction combined with the earlier version of the mood update function led mSARSA to be heavily exploited when in direct competition with highly uncooperative SARSA agents. It did, however, exhibit key traits that SARSA did not. When the values of the payoff matrix were varied (whilst maintaining the hierarchy necessary for the dilemma) so as to alter a summary of the matrixFootnote 3, mSARSA exhibited a trend seen in human research. As Wrightsman et al. (Reference Wrightsman, O’Connor and Baker1972) summarizes, when the value of the index increases, humans cooperate more, despite the payoffs they receive maintaining the structure of the dilemma; this was also observed in mSARSA, but not SARSA.
In the past, where the mood model has been combined with computational frameworks of emotion, the addition of mood increases cooperation rates over all but one condition of the emotive model alone—in addition, moody agents’ cooperation increases with number of interactions, as opposed to persistent levels observed without it (Collenette et al., Reference Collenette2017a). Though it is important to delineate that this example is of mood atop emotional agents, rather than learning ones, moody conditions all attained rates of over 80% mutual cooperation. In other studies, Moody SARSA at play in mixed environments of agents aids networks to sustain mutual cooperation rates of approximately 49%, though there is no direct data to suggest how mSARSA agents as individuals play (Collenette et al., Reference Collenette2018b).
With the potential for these modifications to provide greater realism in reinforcement learning models of human social behaviour, then, we seek to gain a more thorough understanding of its limitations and possible avenues of improvement. This moody augmentation of SARSA has previously been deployed in networks of mobile agents, simulated in Stage (Vaughan, Reference Vaughan2008), and equivalent non-spatial graph networks. These methodologies provide the networks therein with capacity for change, but each have their own limitations. By building on this past work, we seek to add more dynamism—the ability to remove and add partners after initializing as a random network—and begin to experiment with more layers of artificial cognition through selective play strategies.
2.4. Dynamic networks and selective play
Though Collenette et al. (Reference Collenette2018b) establishes that multi-agent play involving mSARSA in a variety of network structures can experience increased cooperation with the manipulation of their composition, the dynamics of the systems used are still bounded; node degree is fixed for each network, and mobile agent conditions have limited interaction rates. The networks also preclude all notions of realistic human social networks—as discussed in Hauk (Reference Hauk2001), mutability of relationships and partner selectivity is a key aspect of real-world interactions with interconnectivity. There is a wealth of critical data regarding both human and computational cooperation when play is voluntary, as this element emphasizes the key difference between the single-round and iterated versions of the dilemma; persistent poor behaviour may lead to cessation of engagement in real life contexts, as opposed to one-off games.
One initial clarification regards the term Conditional Dissociation as discussed in Qu et al. (Reference Qu2016), with the concept both being of interest to the research at hand but experimentally clearly delineated from our particular methods. As so in this paper, conditional dissociation involves the denial of play continuation post-interaction, facilitating the removal of relationships a player is unhappy in as opposed to the selection of a partner prior to any interaction taking place. The critical difference between conditional dissociation and the play termination we use in this paper is that Qu et al. (Reference Qu2016) clarify the former as ‘requiring little cognitive capability’ and ‘akin to irritability…[like a] basic instinct’. Conceptually, this has an interesting interaction with the mood architecture under evaluation here; increased irritability is one of a broad spectrum of symptoms of clinical depression (NHS, 2019), a condition touched upon briefly in justification of mSARSA’s design (Collenette et al., Reference Collenette2017b). However, the evaluation of a partner taking place in the current work is intended to represent an intentional use of cognitive resource. Human players are often asked definitively to consider a partner’s previous play—over a single round (Rand et al., Reference Rand, Arbesman and Christakis2011) or over many, through summary metrics (Melamed et al., Reference Melamed, Harrell and Simpson2018)—and to consider whether they would like to continue that relationship. Of course, the depth of processing involved in this decision is beyond our current scope to unpick—but we might reasonably assume that this action, in this experimental context, involves more than a gut feeling on which to base rejection, as consideration is specifically instructed. Where the decision to continue play in Qu et al. (Reference Qu2016) is modelled by a single probabilistic variable, lacking in image score metrics and no record of previous play, our model tests a selection of decision rules with summary variables (such as average score) on which judgement depends.
Still, their conclusions are valuable to us; probabilistic conditional dissociation in an evolutionary model promoted cooperation in networks of both mixed and single strategy agents. The paper reduces down the termination of play (in the form of punishment through a waiting mechanism that precludes agents from earning payoffs) to purely an investigation of self-removal. The structure of connection mutability is essential to dynamic networks and must be discussed within context of the wide variety of methodologies that have been used throughout research.
There is a dichotomy across this domain between bilateral (mutual) and unilateral (one-sided) relationship formation and cessation. Wang et al. (Reference Wang, Suri and Watts2012); Stanley et al. (Reference Stanley, Ashlock and Tesfatsion1993) rightly suggest that increased negotiation (in the form of bilateral agreements made through proposal and acceptance) appears closer to naturalistic social contexts. We have opted for unilateral link formation primarily for technical simplicity in this work, as bilaterality at either point (link formation or cessation) would require an additional layer of computation regarding the staging and evaluation of proposed link changes. This, however, should duly be noted as a limitation of both the scope of our work and the applicability of our results—agents contained therein are isolated decision-makers on whom the model imposes changes whenever they are suggested by partners. The pure exception to this is within the bounds of our periodic forgiveness mechanism (as explained in Section 3). Agents in our simulation retain information on partners they have previously rejected under their evaluation strategies until a forgiveness event clears this memory, meaning that agents automatically refuse new connections from partners they have previously dismissed as unworthy, unless they have no memory of doing so. Though this is not close to approximating bilaterality in relationship decisions, it demonstrates a grudge-based premise that prevents unworthy partners from re-invading an agent’s connections.
Interestingly, Hauk and Nagel (Reference Hauk and Nagel2001) suggests that in multiple PD supergames, not only was cooperation greater when the choice to leave was available, it was also higher in unilateral choice conditions than with bilateral agreement. Human participants played 10 supergames, each lasting 10 periods, with each game period consisting of play with 6 separate opponents. The comparability is limited for our current context as this work only concerns itself with exit options of a greater value than mutual defection, but it provides validation that addresses this weakness of the chosen methodology. Additionally, it is important to note that cooperation within play for this paper only reached a maximum of ∼60%—even with the exclusion of data in which play did not go ahead due to a bilateral agreement not being reached. This is much greater than the control baseline they opt to compare againstFootnote 4, but is not as high a proportion as some computational networks achieveFootnote 5. In other human research, proportions of cooperation (mutual or otherwise—there is a great variation in reported metrics from paper to paper) can vary between a maximum of 40% (Gallo, Reference Gallo2022) up to 100% (Melamed et al., Reference Melamed, Harrell and Simpson2018).
The relative frequency of cooperative behaviour decays over consecutive supergames in Hauk and Nagel (Reference Hauk and Nagel2001), a trend observed in other human-based research, including those with differing methodologies. In Wang et al. (Reference Wang, Suri and Watts2012), dynamic human networks of 24 players played the IPD with bilateral formation and unilateral cessation of links, varying the frequency of link updates (designated r) and the number of link updates that could be voluntarily made by a player (designated k). In this paper, authors found that cooperation was enhanced with the availability of link updating overall (over a static network) and that more frequent link updating provided a significantly greater increase in proportion of cooperative actions over the static baseline. Payoffs, too, increased similarly. Cooperators gravitated towards other cooperators in the network (positive assortativity)—with negative consequences for sustained cooperation. As games proceeded, cooperation proportions that had reached approximately 90-95%, diminished to nothingness within the final few rounds, a finding that follows theory regarding the finite horizon (as players were indeed informed that there would only be 12 rounds). Alternative payoffs were able to sustain cooperation slightly later into the game, mitigating the horizon effect, but cooperation still dissolved towards the final round.
One paper that observes a different trend for sustained cooperation to Wang et al. (Reference Wang, Suri and Watts2012), whilst maintaining their conclusions that strategic link alteration promotes cooperation in humans, is Rand et al. (Reference Rand, Arbesman and Christakis2011). In this work, as opposed to the previous, a stochastic horizon was used, where participants were informed the likelihood of another round occurring was 0.8 (thereby mitigating confounding finite horizon influences). Social networks of approximately 20 humans played the repeated game with three experimental conditions; fixed links, random link updates and strategic link updates (through player choice). In the lattermost, a percentage of total player pairs were selected (10% or 30%, depending on the experimental condition) for link restructuring. If a link already exists, the evaluation regards disconnection, with the inverse if no current link exists, and players are only informed about a partner’s single previous play behaviour. The authors confirmed conclusions of prior evolutionary game theoretic work with this methodology, demonstrating that when a greater proportion of subject pairs are selected for link evaluation (30% of total), robust cooperation was sustained through the entire experimental period. Granted, these experimental periods are not overly long (an average of 11 periods of game-playing)—it is possible that with lengthier experimental sessions, this could still decay. However, authors also found that cooperators were better connected than defectors, with cooperators much more likely to have new links established with themselves than defectors. Finally, this paper adds some validity to our choice of focusing most partner selection computation on the termination of links, with the addition of a periodic forgiveness mechanism, through its suggestion that human players are more discerning when they rescind consent to play with partners and are ‘more willing to give new players the benefit of the doubt…reminiscent of a form of forgiveness or leniency’.
Recent work that follows on from Rand et al. (Reference Rand, Arbesman and Christakis2011) both offers support and brings questions that elicit the need for further research. Whilst Gallo (Reference Gallo2022) offers weak corroborating support for Rand et al. (Reference Rand, Arbesman and Christakis2011), it demonstrates that a value of R%=50 elicits only slightly more cooperation than R%=10 in a network size of 12, whilst still noting horizon-based decay of this cooperation in both conditions (despite participants being informed of a probabilistic likelihood of a next final round occurring). A potential reason for the weak reinforcement of the previous evidence in this case could be suggested by Melamed et al. (Reference Melamed, Harrell and Simpson2018), in which the ‘standard methodology’ employed in Gallo (Reference Gallo2022) is critiqued. In the latter, players are forced to choose one behaviour for all networked partners they interact with, something the former suggests could have a suppressive effect on behavioural cooperation. Melamed et al. (Reference Melamed, Harrell and Simpson2018) also utilizes a similar restructuring method (albeit keeping node degree the same, through a one-in, one-out process), concluding that whilst reputation information is used in the process of partner selection, it is not used in the process of behavioural decision-making (and has little influence on resultant cooperation rates). Interestingly, in difference to the other two studies mentioned here, Melamed et al. (Reference Melamed, Harrell and Simpson2018) observes that when link evaluation and replacement is voluntary it occurs only 6.3% of the time.
To our knowledge, there is sparse computational research furthering investigation of the observations of human behaviour made within these collected works, and none combining it with humanlike reinforcement learning models for evaluation of said algorithms. Given recent discussion of psychology and behavioural economics’ replication crises (Jusup et al., Reference Jusup2022) in relation to these exact topics, further study is evidently necessary to aid a thorough understanding of underlying principles at work here.
2.5. Summary and current work
The IPD can be used to study the emergence of cooperation under difficult circumstances; selfishness, social judgement, risk-taking and mutuality without communication. Particular reinforcement learners have been demonstrated to be uncooperative within the dilemma, following traditionally rational behavioural patterns despite opportunities to reach altruistic self-benefit, but can be augmented with models of human processes to increase their proportions of generous behaviour (Collenette et al., Reference Collenette2017b, Reference Collenette2018b; Feehan & Fatima, Reference Feehan and Fatima2022). Mood summarizes and encapsulates the principle that experiencing social behaviour brings about altered internal states and demonstrates fluctuations in behaviour that humans also exhibit (Feehan & Fatima, Reference Feehan and Fatima2022), giving it promise for further development. Though it has been tested in dynamic networks (Collenette et al., Reference Collenette2018b), it has not been tested in conditions where node degree can fluctuate, potentially creating outcasts and other such anomalies. It has also not been tested in collocation with decision strategies within such structures, where agents can choose for themselves if they wish to keep playing against any given partner; a factor that has been well established as influential on cooperation rates. Alongside manipulations of network restructuring parameters, which also alters human cooperation behaviours in the IPD (Rand et al., Reference Rand, Arbesman and Christakis2011; Melamed et al., Reference Melamed, Harrell and Simpson2018; Gallo, Reference Gallo2022), these are all avenues of possible investigation with the aim of improving cooperation further.
The intention of the current study is to synthesize many elements of these previous works into a novel simulation, in order to progress understanding of both the moody SARSA algorithm and agent modelling of human data. Humans in dynamic network research are often treated as black-box decision-makers, where elements of the network structure are altered for effect but the cognitive components of their interaction are not conditionally tested. As a bottom-up complement to this, we wish to examine a reported trend in IPD play across networked games in people (Rand et al., Reference Rand, Arbesman and Christakis2011; Gallo, Reference Gallo2022) that confirms the predictions of evolutionary game theoretic models.
We do this via a handful of basic partner evaluation mechanisms, based in past research and theory, that go some small way towards representing humanlike processing, built atop a base platform of an algorithm demonstrably more humanlike than traditional learners (Feehan & Fatima, Reference Feehan and Fatima2022). We cannot test such agents under similar methodologies as those used with humans without expanding on their architectures beyond that of the literature thus far; hence, the justification for the novel elements of this paper. The simple suggestions for partner evaluation offered in our study serve as an initial probe into a second level of decision-making atop the processing involved in learning to play the IPD.
3. Experimental design
The simulation for the following experiments consist of a multi-agent network with the capacity for agents to remove randomly selected current partners at specific intervals (link termination), according to some specified decision mechanism. Game-playing strategies used by agents are either commonly used throughout the game theoretic literature (e.g. TFT), or have been taken from a combination of Collenette et al. (Reference Collenette2017b) and Collenette et al. (Reference Collenette2018b) (specifically, mSARSA; details of which are primarily in Section 2.3 and Section 3.2.1). Experimental values used in the restructuring of the network have been taken directly from Rand et al. (Reference Rand, Arbesman and Christakis2011) and Gallo (Reference Gallo2022) (see Section 3.2.2). Decision strategies for link termination were designed uniquely by the research team, with consideration to cited sources of previous literature (see Section 3.2.4), as with other elements of the network restructuring design (cited as appropriate). Whilst these components have all been previously independently investigated, this combination of factors has not been experimentally tested in this manner until now.
This section describes first the physical structure of the network itself, its construction and the nature of dynamic changes to agent connections throughout one iteration of an experimental run (defined in Section 3.1). It then outlines the experimental parameters used in all relevant aspects of the simulation and which sources they have been taken from (if relevant), before formally outlining the testing hypotheses for the experiments following, categorized by the dependent variable primarily used to determine that outcome.
3.1. Simulation structure
The network for all the following outlined experimentation is structured thus. Forty agents are generated in a non-spatial Erdos–Renyi network with an initial link connective likelihood of 0.2, as in Rand et al. (Reference Rand, Arbesman and Christakis2011); an example visualization of the graph structure of the network used can be seen in Figure 1. In this diagram, we see each agent in the network as a node (circular), with a bilateral partnership with another node represented by an edge, or link. Agents with links between them are considered partners for the purposes of the game.
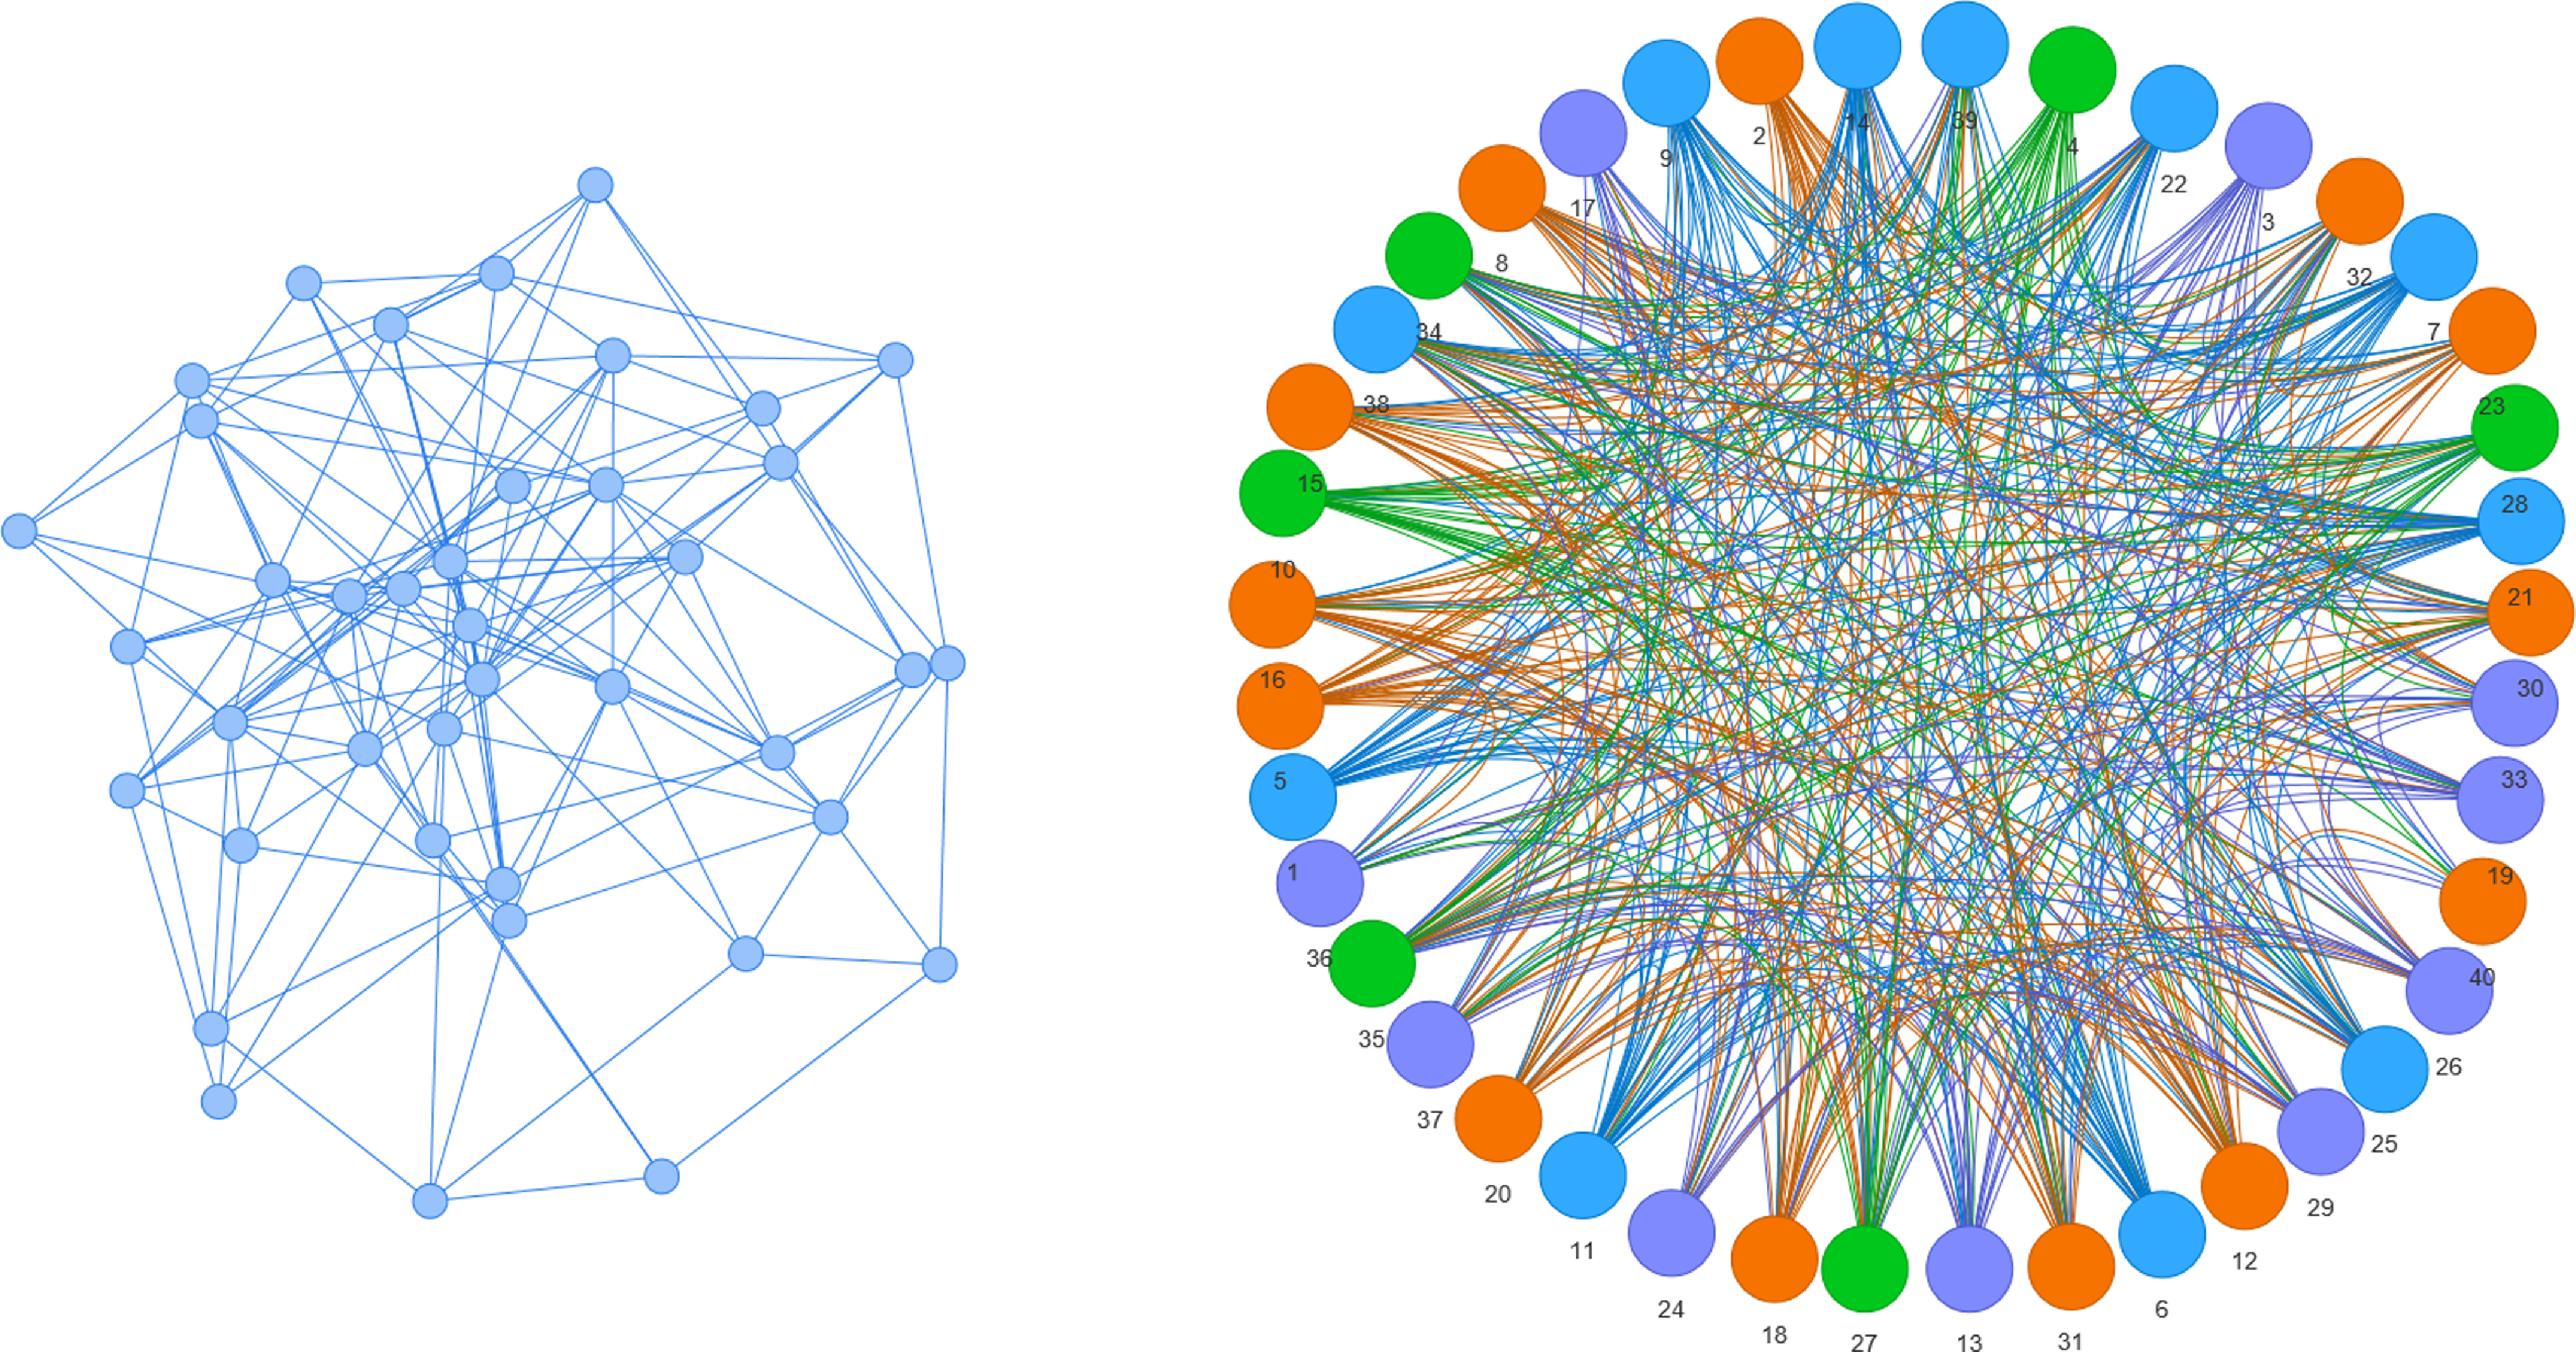
Figure 1. An example visualization of the initial random network, and the final network at the end of the experimental period, generated with the PyVis library (Perrone et al., Reference Perrone, Unpingco and Lu2020). Colours in the graph to the right indicate differing agent game-playing strategies
Each agent has a randomly selected game-playing strategy type from list of available strategies (all of equal weighting) depending on the network diversity condition; in the Single Opponent condition (with low strategy diversity), the dynamic network is constructed of only learning agents (mSARSA vs. SARSA), whereas in the Multiple Opponent condition (with higher strategy diversity), the network is made up of approximately equal distribution of four strategy types (mSARSA, SARSA, TFT and WSLS). The network is constructed in Python, utilizing the Network X (Hagberg et al., Reference Hagberg, Schult, Swart, Varoquaux, Vaught and Millman2008) and MESA (Mesa, 2021) libraries, with the code repository available on request.
At each time step of an experimental run, agents play a round of the IPD against each of their partners in order of their natural placement in an agent’s partner list, with all agent relationships being bidirectional mutual connections. Partners are defined as any other agent in the network connected to the agent in question. There are no limitations on how many partners an agent can have within a network; agent connectivity is purely a product of selection opportunity and selection decisions. Components of this method are taken from Melamed et al. (Reference Melamed, Harrell and Simpson2018), which discusses the importance of the more natural network behaviour selections for the IPD, in contrast to established dynamic network experimentation tradition of selecting a single IPD behaviour that is played against all partners unilaterally. Though research continues to use this method (Gallo, Reference Gallo2022), we agree with this refutation of the standard design.
This continues with these initialized partners until a restructuring event (R e ) occurs, during which a single round is taken to evaluate partner connections and no game-playing takes place—this follows the methodology outlined in Rand et al. (Reference Rand, Arbesman and Christakis2011). The IPD then continues as previous, until the next restructuring event; the frequency of these we designate through R f .
When an R e occurs, the network model generates a list of all possible agent pair combinations and then randomly selects a percentage of these for evaluation in the current event; this percentage is designated as the R % . With this selected list of agent pairings, the model iterates through the list and queries the first agent in each pairing as to if it wishes to alter their relationship with the second listed agent. This alteration depends on the current status between the two agents. If they have a pre-existing connection, the primary agent is queried regarding severance of that connection (involving the value judgement of the partner, as given by the Link Termination Strategy, or LTS). If there is no pre-established connection, agents check if the potential partner has previously been rejected by themselves (via a value judgement), and if not, they accept them as a new partner.
For example, if the pairing in question is (4, 32), and there is already an existing connection between these two agents, the model queries agent 4 as to if it wishes to sever its relationship with agent 32; agent 4 will evaluate this decision based on its LTS.
Every n occurrences of an R e , the network also has a forgiveness event (F e ), in which specific local and global information on play behaviour are reset. Namely, this includes the number of betrayals an agent has performed across all of their interactions, the average scores each agent has been maintaining against their opponents, and each agents memories of the partners they have rejected since the last F e . The frequency of these forgiveness events is a static parameter, designated F f . Each experiment consists of 5 learning episodes, with each of those comprising 25,000 game-playing time steps, where internal variables within agents are maintained for the course of the episode. Data presented averages over these learning episodes for each experimental condition. These values were selected as a combination of resource availability and pre-experimental parameter testing. Behaviours stabilized in the majority of experimentation after approximately 20,000 time steps, averaging at a mean runtime of 49.63 hours (SD=26.95) for 25,000.
The default parameters for both R f and F f were also chosen through extensive parameter exploration and tuning prior to this study; in detail, R f was tested using values of [5,10,15] in combination with values of [5, 100, 200, 1000] for F f , tested over 2,000 hours of computation time. Behaviour was generally consistent under different values of R f , with slight differences in performance found under changes to F f . We go one step further than Rand et al. (Reference Rand, Arbesman and Christakis2011) to test one additional larger value for R % —taken from Gallo (Reference Gallo2022)—due to the increased size and interactivity of a network of artificial agents compared with human players. The proportion of player strategy types in the Multiple Opponent condition is similar to that in Collenette et al. (Reference Collenette2018b) to facilitate similar comparison whilst keeping within resource bounds.
All of the values used for the parameters given above can be found in Table 2.
Table 2. Parameter identifiers, their meanings, and the tested values for the following experiments

3.2. Parameters
3.2.1. Moody parameters
The moody version of SARSA uses the parameters outlined as optimal for encouraging cooperation in previous literature Collenette et al. (Reference Collenette2017b, Reference Collenette2018b) and the second iteration of its mood update equation (Collenette et al., Reference Collenette2018b), designed to encourage larger mood updates from poor outcomes. These parameters include; the incorporation of mood in learning states, a value of 0.8 for the MA parameter, and a starting mood value of 50. For more details, see Collenette et al. (Reference Collenette2017b).
3.2.2. Network parameters
Table 2 outlines the experimental conditions for this piece of research and the values tested for each parameter involved in our dynamic networks.
3.2.3. Link acceptance strategy
All agents possess the default novel link acceptance behaviour of:
If a potential partner is one I have no record of rejecting previously, I will accept them as a new opponent; otherwise I will reject them outright.
3.2.4. Link termination strategies
LTSs then are enacted when existing connections are reviewed, as in Rand et al. (Reference Rand, Arbesman and Christakis2011) and were designed based on intuitively human evaluation metrics. These are described as follows:
-
Random The initial LTS makes partner decisions randomly, generating a value satisfying 0 < n < 1, that is compared to the threshold of .5. If it is above .5, partners are rejected, and so forth. This is to test for any effect purely generated by network dynamics alone, similar to Melamed et al. (Reference Melamed, Harrell and Simpson2018).
Reputation Next, there are two Reputation-Based strategies. Both function by comparing a partner’s betrayal count (the number of T outcomes they have received) against a particular threshold of acceptance—this strategy is inspired by Image-Scoring literature. Image-scoring functions by recording a single or multifaceted statistic of a player’s positive behaviour in a certain context (Wedekind & Milinski, Reference Wedekind and Milinski2000; Fu et al., Reference Fu2008); for the IPD, this could be how cooperative they are, or conversely how much they choose to defect. We have opted to select the T payoff specifically for our simulations as mutual defection can be perceived as rational and self-protective in a hostile environment—an agent that defects greatly is not necessarily a selfish player if they are utilizing that behaviour defensively. There is also substantial evidence throughout psychological research of a perception bias towards negative social information (Abdai & Miklósi, Reference Abdai and Miklósi2016), including in reference to the spread of reputation information (Kim & Shin, Reference Kim and Shin2015). The two thresholds of comparison are thus:
-
RA In the first instance, it is compared against their own betrayal count—if the opponent value is larger, they are rejected. This is intended to select based on a humanlike principle of ‘at least as good as me, or better’—though it may mean that well-behaved agents who experience very few T outcomes will have a much more limited long-term partner pool.
-
RB The second threshold compares the partner’s count against the global network average betrayal count. The partner is only retained if this is lower than this mean, promoting the retention of partners who generally do not betray their opponents, but without contextual distinction for agents that explore.
-
-
Score Finally, there are two Score-Based strategies. Both work on the principle that when a connection is reviewed, the reviewing agent examines its own total mean payoff (since the initialization of the simulation) against the current opponent under review, and if it is lower than the desired threshold, the partner is rejected. This method of evaluation is rooted more in common sense regarding play—naturally, players may use some summary count, or even intuitive average (as biased with error that may be) of their scoring against a partner to judge their suitability as a co-player. Pure score averages with tolerance levels have also been used in previous computational research (Hauk, Reference Hauk2001) with positive effects on cooperation in networks, and score or previous play information is often given to human players to facilitate whatever decision-making they are using (Rand et al., Reference Rand, Arbesman and Christakis2011; Wang et al., Reference Wang, Suri and Watts2012). The two thresholds examined in this work are:
-
SA An average score of 3 (a self-promoting absolutist threshold that selects for either partners that can be exploited or partners that mutually cooperate), and,
-
SB An average score of 2 (a softer, but still positive threshold that is also inclusive of partners migrating behaviour towards mutual cooperation, deselecting them if they move towards mutual defection).
-
3.3. Hypotheses
Hypotheses for the various experiments in this paper will be broadly separated into predictions regarding the three primary comparable dependent variables we will measure for both moody SARSA and the network at large; payoffs, cooperation levels and connectivity (measured via normalized actor degree centrality). This lattermost measure summarizes the connectedness of agents with nondirected links; values close to zero indicate isolated network members, whereas values closer to 1 indicate highly connected players (Knoke & Yang, Reference Knoke and Yang2008). Each experimental parameter combination is repeated within the Single Opponent and Multiple Opponent environment conditions.
Predictions for the influence of network diversity are conditional on how mSARSA reacts to exploitation in this implementation, as no direct data is available to make a formal intuition. If the updated version of the algorithm (Collenette et al., Reference Collenette2018b) facilitates better protection from exploitation, then the limiting factor on mSARSA performance in the Single Opponent condition will be R%; the volume of restructuring within the network. The ability to reject partners only functions to a degree under this system where forgiveness is possible; agents who are selfish (namely, SARSA) will exploit until their misdemeanours are forgotten, with this cycle repeating itself as F e occur. This cycle could potentially be more extreme under greater values of R% also, as greater network changeability allows the examination and rejection of poor quality partners at a faster rate than when only small portions of the population are permitted re-evaluation.
3.3.1. Payoffs
-
H1. In terms of specific strategies, we anticipate that score selection will lead to increased payoffs for mSARSA agents in comparison to reputation selection, if partners are more prone to cooperation also. Given that the former is more specific to agent–agent interactions, whereas the latter evaluates a potential partner’s more general, network-wide behaviour, we expect that poor partners will be cut off more frequently, leading to higher-scoring relationships between those open to sustained cooperation.
3.3.2. Cooperation
-
H2. We anticipate that the addition of strategic, dynamic link termination will increase proportions of cooperation for moody agents over instances of static connectivity (Feehan & Fatima, Reference Feehan and Fatima2022), as agents will have the opportunity to reject exploitative partners.
-
H3. We also expect stricter thresholdsFootnote 6 will create decreased proportions of cooperation for agents over softer counterparts. Under this expectation, we predict that the SB LTS will result in higher proportions of cooperation than the SA LTS. There may be some mitigation of this effect due to the forgiveness mechanic utilized, but that will not be examined in the current work.
-
H4. In the Multiple Opponent condition, we expect mSARSA to continue to exhibit more cooperation than SARSA if it follows trends of previous research (Collenette et al., Reference Collenette2018b; Feehan & Fatima, Reference Feehan and Fatima2022). These agents will create more frequent to establish patterns of cooperation with partners that are more open to reciprocation (e.g. TFT). Due to this, we anticipate mixed strategy environments to exhibit greater overall cooperation over the Single Opponent conditions.
-
H5. If we carry forward the conclusions from previous research utilizing this restructuring methodology with human players (Rand et al., Reference Rand, Arbesman and Christakis2011; Gallo, Reference Gallo2022), we anticipate that moody agents will cooperate more frequently with higher values of R%. It is entirely possible that this effect may not translate to agent-based research for a broad number of reasons that we will evaluate further, but is worth maintaining as an initial hypothesis given the response of mSARSA agents in past work to other human-influencing IPD parameters (Feehan & Fatima, Reference Feehan and Fatima2022).
-
H5.1. A third value for R%—50, which was not used in Rand et al. (Reference Rand, Arbesman and Christakis2011) but has since been tested more recently in Gallo (Reference Gallo2022)—is included due to the observation of suppressed behavioural trends seen in Feehan and Fatima (Reference Feehan and Fatima2022) and the consideration that greater parameter values may be necessary to elicit behavioural differences in a high-volume interaction environment. It is expected that if behaviour follows the pattern of increase shown in these human studies, we anticipate that cooperation will only show a slight increase in the R% = 50 condition over the R% = 10 condition. It is possible that this behaviour will not carry over from human to agent-based research, however; agents may demonstrate a more linear relationship between cooperation rates and network restructuring.
-
3.3.3. Connectivity
-
H6. The higher threshold for Score-based selection (Threshold SA) will result in lower connectivity for agents overall in comparison with the alternative threshold and with random partner evaluation. The reasoning behind this is that it holds partners to a high standard; any average score with a value below that of sustained mutual cooperation is unacceptable and results in rejection. We expect that a more lenient threshold will be more forgiving to agents who explore these behaviours (such as reinforcement learners) in the initial stages of experimentation, leading to lower systematic declination of play and potentially allow for relationship growth. Agents utilizing this softer threshold value (Threshold SB) will be more lenient on partners who prefer to defect, but only up to the critical limit—if partnerships tend towards defection progressively over multiple rounds, they will eventually be disconnected.
-
H7. We additionally anticipate that mSARSA agents will maintain a greater actor degree centrality than SARSA agents, particularly in the Single Opponent condition. This is because mSARSA agents have a greater natural propensity to cooperate, as seen in its previous literature (Collenette et al., Reference Collenette2017b; Feehan & Fatima, Reference Feehan and Fatima2022), meaning that in the less diverse environment, mSARSA agents are more likely to select for themselves under all thresholds that select for cooperators, meaning mSARSA agents will be more likely to play with partners of their own kind.
3.3.4. General
-
H8. Overall, we expect that moody agents will maintain more homogeneous personal networks than their SARSA counterparts in the Single Opponent condition, due to their greater preference and propensity for cooperation and the natural predisposition of SARSA to defect in previous testing (thereby promoting their deselection through LTS). We will examine this notion of homophily (the sociological clustering of like-minded agents) within the network by measuring the proportion of an agent’s partners with the same game-playing strategy to itself.
-
H9. Within the reputation-based system, we predict that using the self as a comparator (Threshold RA) will result in greater network heterogeneity between the simplistic and learning strategies, due to the subjectivity of the evaluator. Agents who betray very frequently (such as explorers) will be more open to connection as opposed to agents who are kind, who will be more restrictive (resulting in lower measures of centrality).
-
H10. Given that simpler strategies have also performed very well in similar research (Collenette et al., and with WSLS’ propensity to exploit where permitted, we anticipate that strategies such as TFT and WSLS will attain greater payoffs, proportions of cooperation and connectivity than either of the learning strategies, across all conditions.
4. Experimental evaluation and results
The results given below are summaries of average behaviour across the final ‘cycle’ of gameplay for each experimental condition; that is, the period of game-playing between the final forgiveness event and the end of the simulation time. Time series data is discussed throughout and is available to produce on request, but has been omitted here due to volume of data. We begin by providing graphs of three of the central dependent variables (mean payoff, mean proportion of cooperations performed and mean normalized actor degree centrality) for moody SARSA in both the Single Opponent and Multiple Opponent conditions. We then also discuss other data from the experiments in-text (namely average mood, the mean proportion of similar partners, and so on). Each parameter is presented as the grand mean across all agents in that condition, across this final game cycle. Error bars are single standard deviations from this mean; where large error bars are visible, this represents large behavioural learning curves over the course of a cycle, where behaviour post-forgiveness initially starts much higher or lower and converges on the mean value shown over time.
4.0.1. Payoffs
Payoffs in neither the Single nor Multiple Opponent conditions were able to approach that of overall mutual cooperation, regardless of LTS, but were highest whilst utilizing the RB and SB strategy thresholds. In both the Single Opponent (see Figure 2) and Multiple Opponent (see Figure 3) conditions, only the RB and SB LTS thresholds were above the static baseline level, demonstrating an improvement of the addition of selective play. Both Random and SA LTS thresholds exhibited declining mean payoff levels as R% increased (regardless of network diversity), with no consistent trend across the other LTS. Payoffs overall were slightly higher overall in the more diverse networks than in games purely against SARSA.

Figure 2. Summary graphs for Mean Payoffs attained by mSARSA agents within the final cycle of gameplay, Single Opponent condition. Data is presented as grand means across all agents within that time period, averaged over five simulative episodes, and demonstrates a promotion of payoff earning for mSARSA agents under the RB and SB strategies. Asterisks (*) indicate starting values for that variable in the initial three rounds of the whole simulative period, and the solid black horizontal line indicates the baseline average, taken from simulation with no partner switching
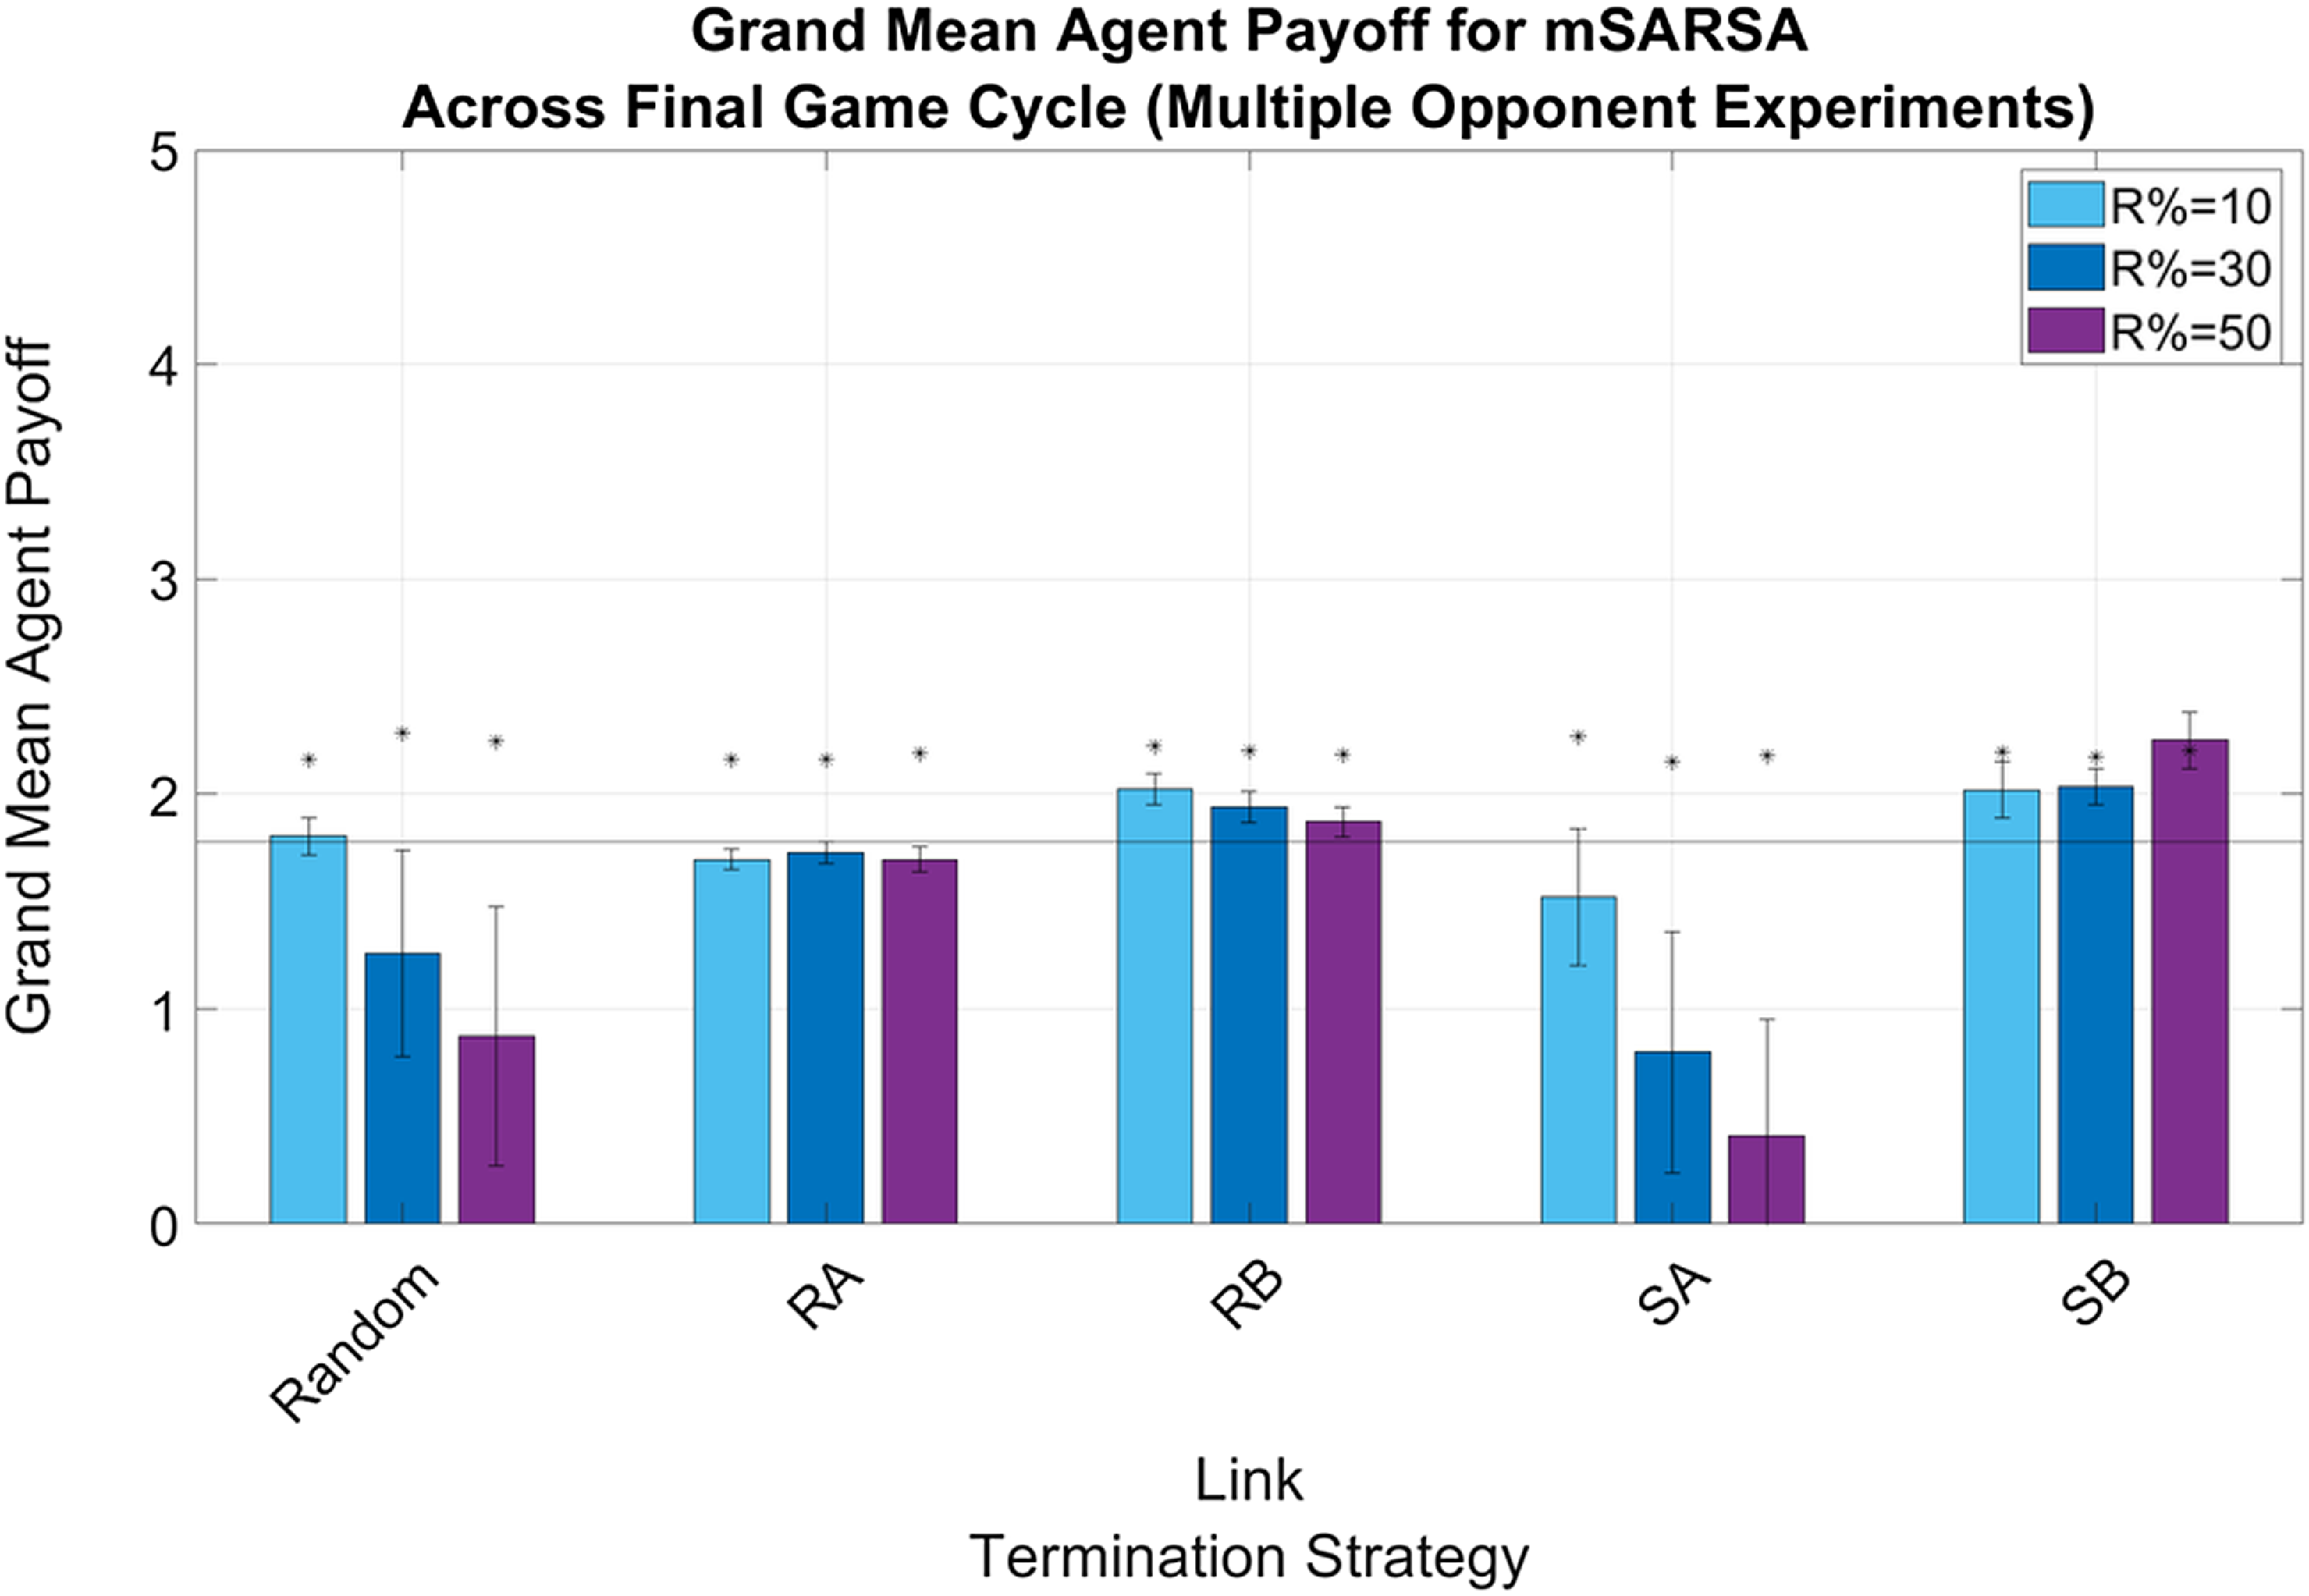
Figure 3. Summary graphs for Mean Payoffs attainted by mSARSA agents within the final cycle of gameplay, Multiple Opponent condition. Data is presented as grand means across all agents within that time period, averaged over five simulative episodes, and demonstrates a promotion of payoff earning for mSARSA agents under the RB and SB strategies. Asterisks (*) indicate starting values for that variable in the initial three rounds of the whole simulative period, and the solid black horizontal line indicates the baseline average, taken from simulation with no partner switching
4.0.2. Cooperation
The mean proportion of cooperative actions mSARSA agents took declines from initial levels across all conditions over the course of the experimental period. In the Single Opponent environment (see Figure 4), voluntary cooperation (i.e., any instance where the C action was chosen by an agent as the played move against a single partner) was higher overall than in the Multiple Opponent environment—a result we did not anticipate, given the greater proportional presence of partner strategies that reward cooperation (TFT and, in some instances, WSLS).
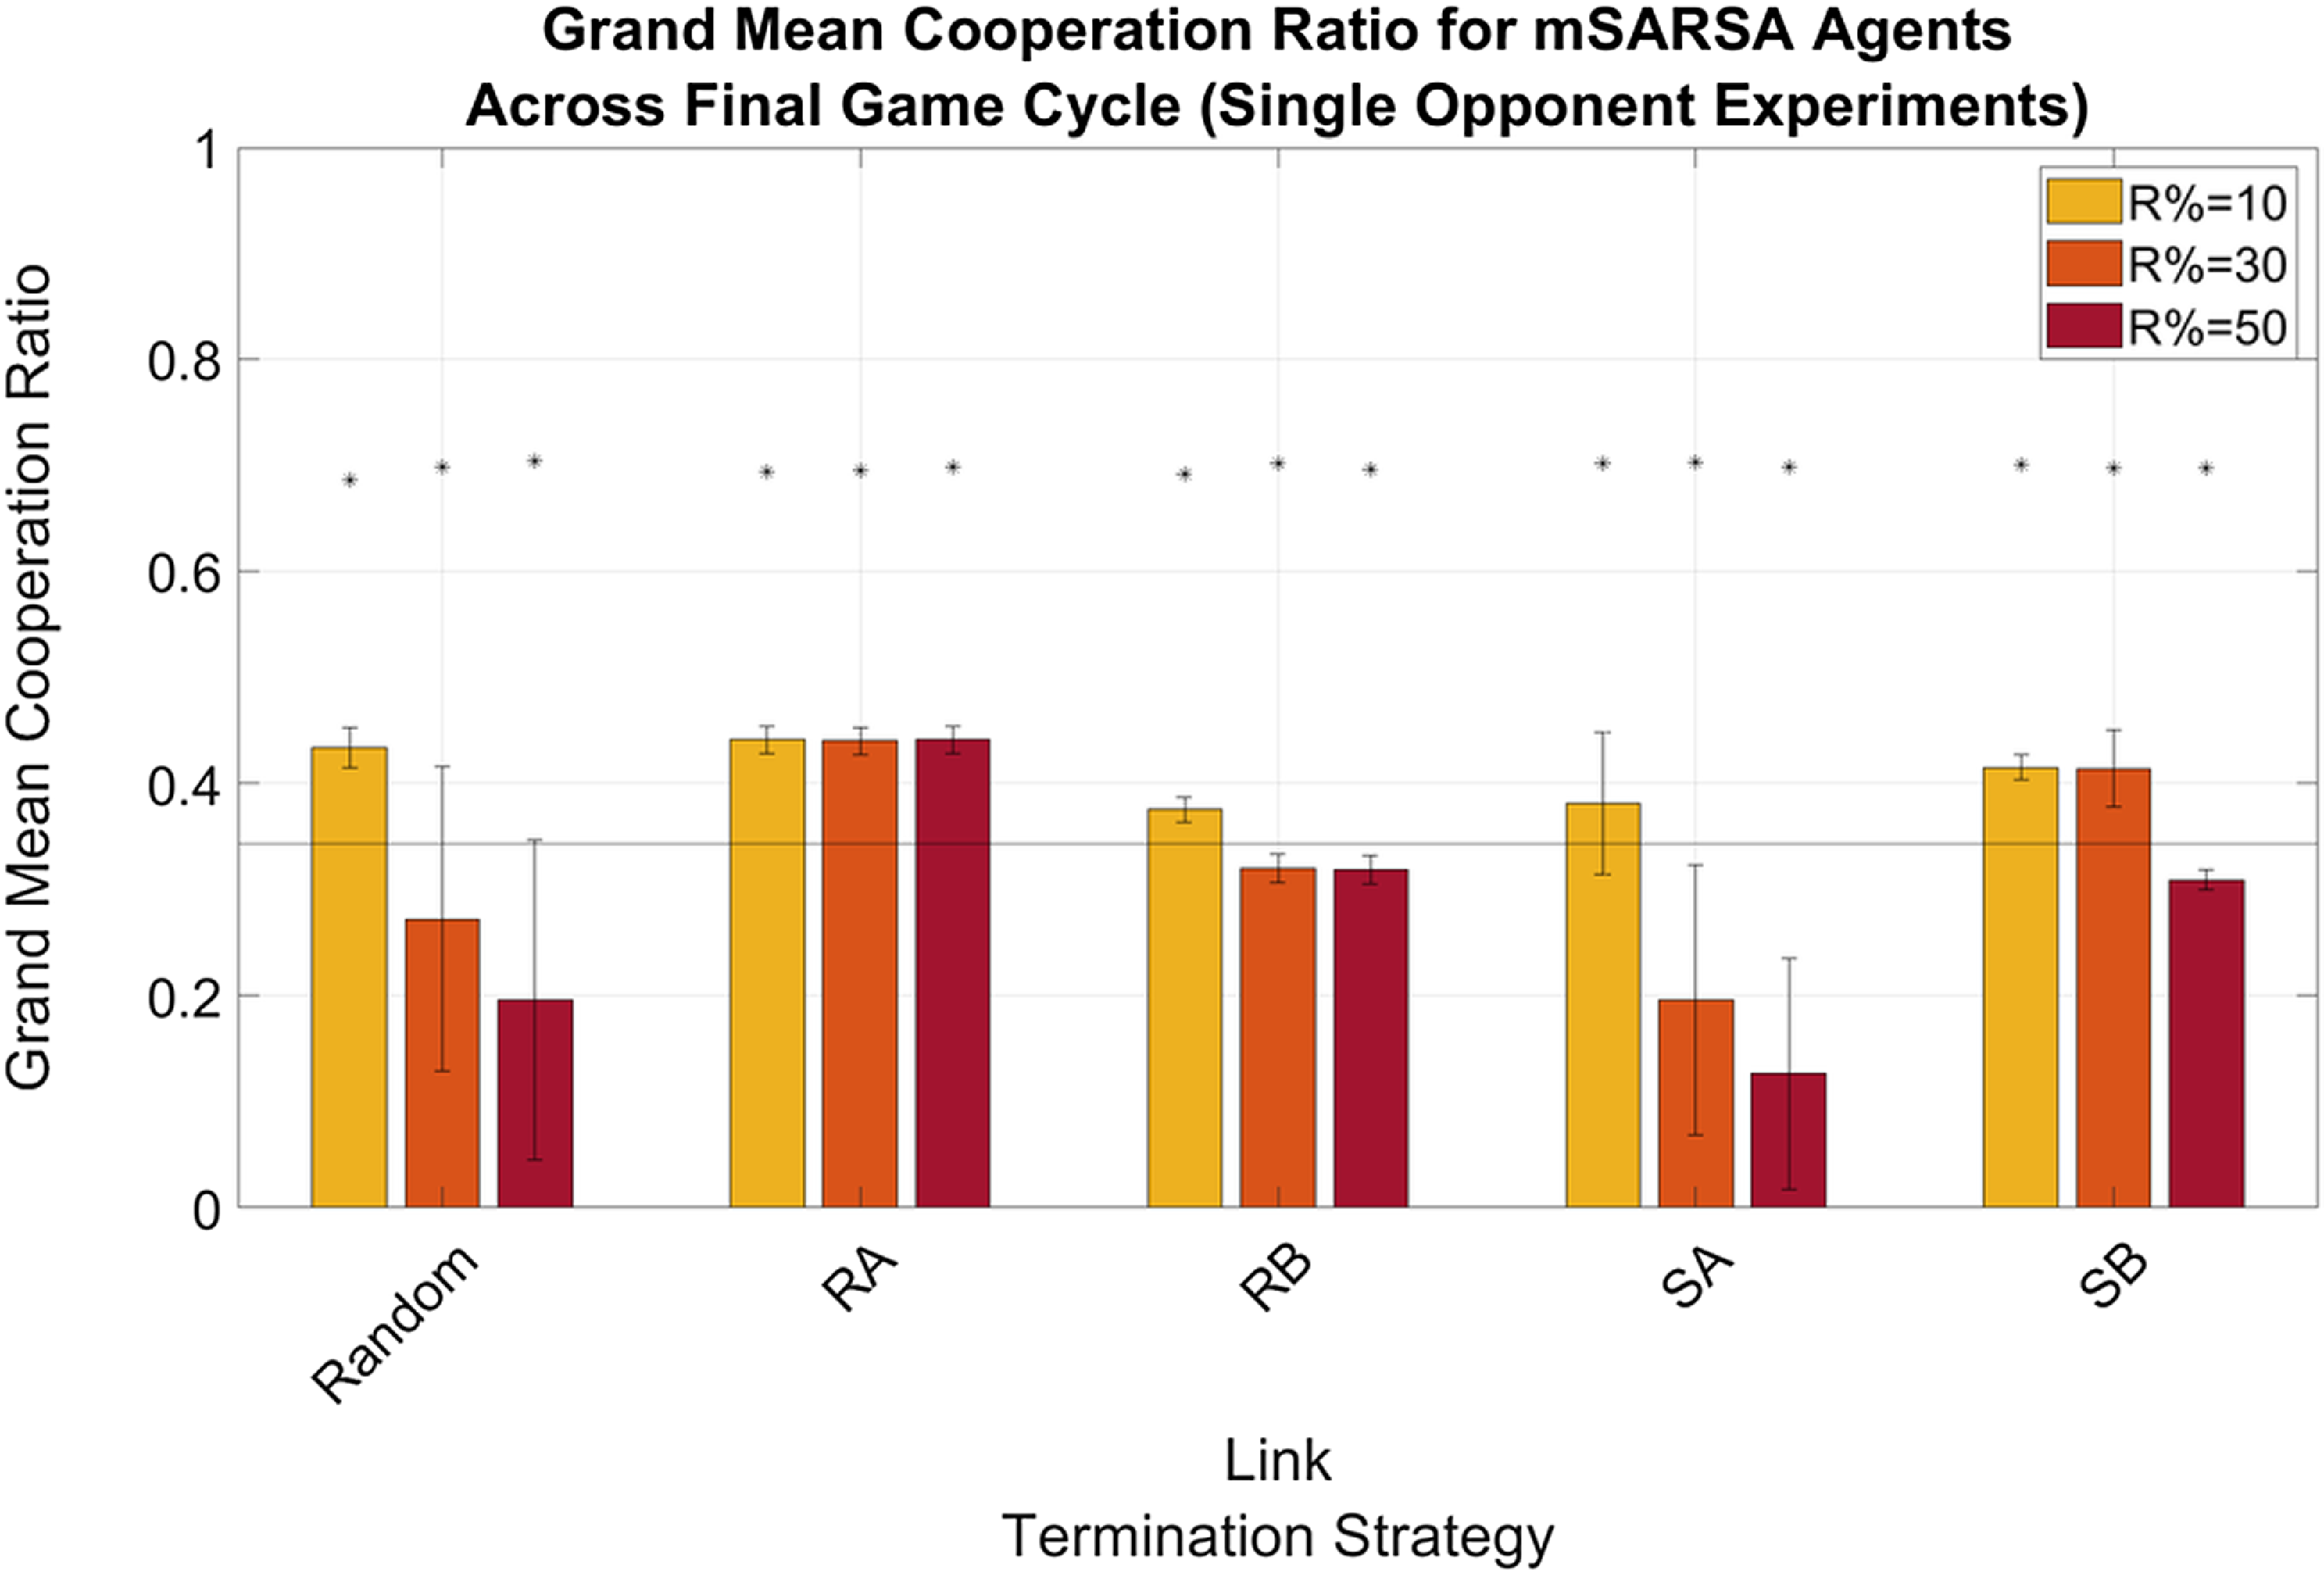
Figure 4. Summary graphs for Mean Cooperations performed (as a proportion of all actions taken) by mSARSA agents within the final cycle of gameplay, Single Opponent condition. Data is presented as grand means across all agents within that time period, averaged over five simulative episodes, and demonstrates an increase in cooperation for mSARSA agents under the RB and SB strategies. Asterisks (*) indicate starting values for that variable in the initial three rounds of the whole simulative period, and the solid black horizontal line indicates the baseline average, taken from simulation with no partner switching
In the Multiple Opponent environment (see Figure 5), cooperative actions were greatest overall for the RA and SB strategies at R%=30, and SA at R%=10. In the otherwise poorly cooperative SA strategy, in which agents seek partners that they can attain a mutually cooperative payoff or greater against, the lowest percentage of link restructuring (R%=10) appears to negate some of the strictness of this threshold. For RA and SB, the slightly more generous thresholds, R%=30 facilitates over 30% of mSARSA agent behaviours being choices of cooperation. If we exclude the strategy SA from the Multiple Opponent dataset, the trend suggested by Rand et al. (Reference Rand, Arbesman and Christakis2011) holds true for these simulations; cooperation was greater in the R%=30 than the R%=10 condition. After that, R%=50 demonstrates a decline in the proportion of cooperative actions, either similar to that of R%=10 or lower.

Figure 5. Summary graphs for Mean Cooperations performed (as a proportion of all actions taken) by mSARSA agents within the final cycle of gameplay, Multiple Opponent condition. Data is presented as grand means across all agents within that time period, averaged over five simulative episodes, and depicts a sharp decrease in cooperation for mSARSA agents under the RB strategy. Asterisks (*) indicate starting values for that variable in the initial three rounds of the whole simulative period, and the solid black horizontal line indicates the baseline average, taken from simulation with no partner switching
This is slightly different in the Single Opponent condition, where cooperation levels for RA and SB are also above the static baseline when R%=10 and also R%=30 for the former of the two. Mean proportions of mutual cooperations, not displayed here, were incredibly low throughout all conditions, never reaching above 15%. In the Multiple Opponent environment, only RA at R%=30 and SB at all three levels of R% were above baseline values, varying between ∼11% and ∼13%.
Mean proportions of mutual cooperation (not shown here) were low for mSARSA in every condition; at no point did it rise above 15% of outcomes received for moody agents. In the Multiple Opponent environment, however, the average across all strategies is much more positive due to the inclusion of other strategies. In the final cycle of game-playing, mean network proportions of mutual cooperation peaked at 43% (SD=41.08, where the standard deviation indicates the variance between strategies playing the game) under the SB LTS. This is not far from the levels observed in Collenette et al. (Reference Collenette2018b), in which whole-network mutual cooperation proportions peaked at approximately 49%. Levels under other LTS were slightly lower; between 32.61% for RA (SD=30.19) and 37% for SA (SD=30.67), with RA being the only strategy not to facilitate greater whole-network mutual cooperation proportions than our static baseline (M=32.67%, SD=29.51%). These overall proportions are much higher than for either of the learners individually due to the much higher mutual cooperation rates of both WSLS and TFT.
4.0.3. Connectivity
There were no greatly obvious differences between the normalized actor degree centrality values for mSARSA agents when in the Single- or Multiple Opponent environments, with the exception of agents being slightly more connected when utilizing the RB and SB LTS in the Single condition (see Figure 6) as opposed to the Multiple (particularly when R% was lower—see Figure 7). The obvious exception to this is when R%=10 in the Single Opponent context, RB exhibited much greater connectivity than when R% was greater and than when the network was more diverse. All agents that did not use the Random or SA LTS were more connected by the final cycle than they were in the initialized network and therefore also more connected than the static network baseline also.
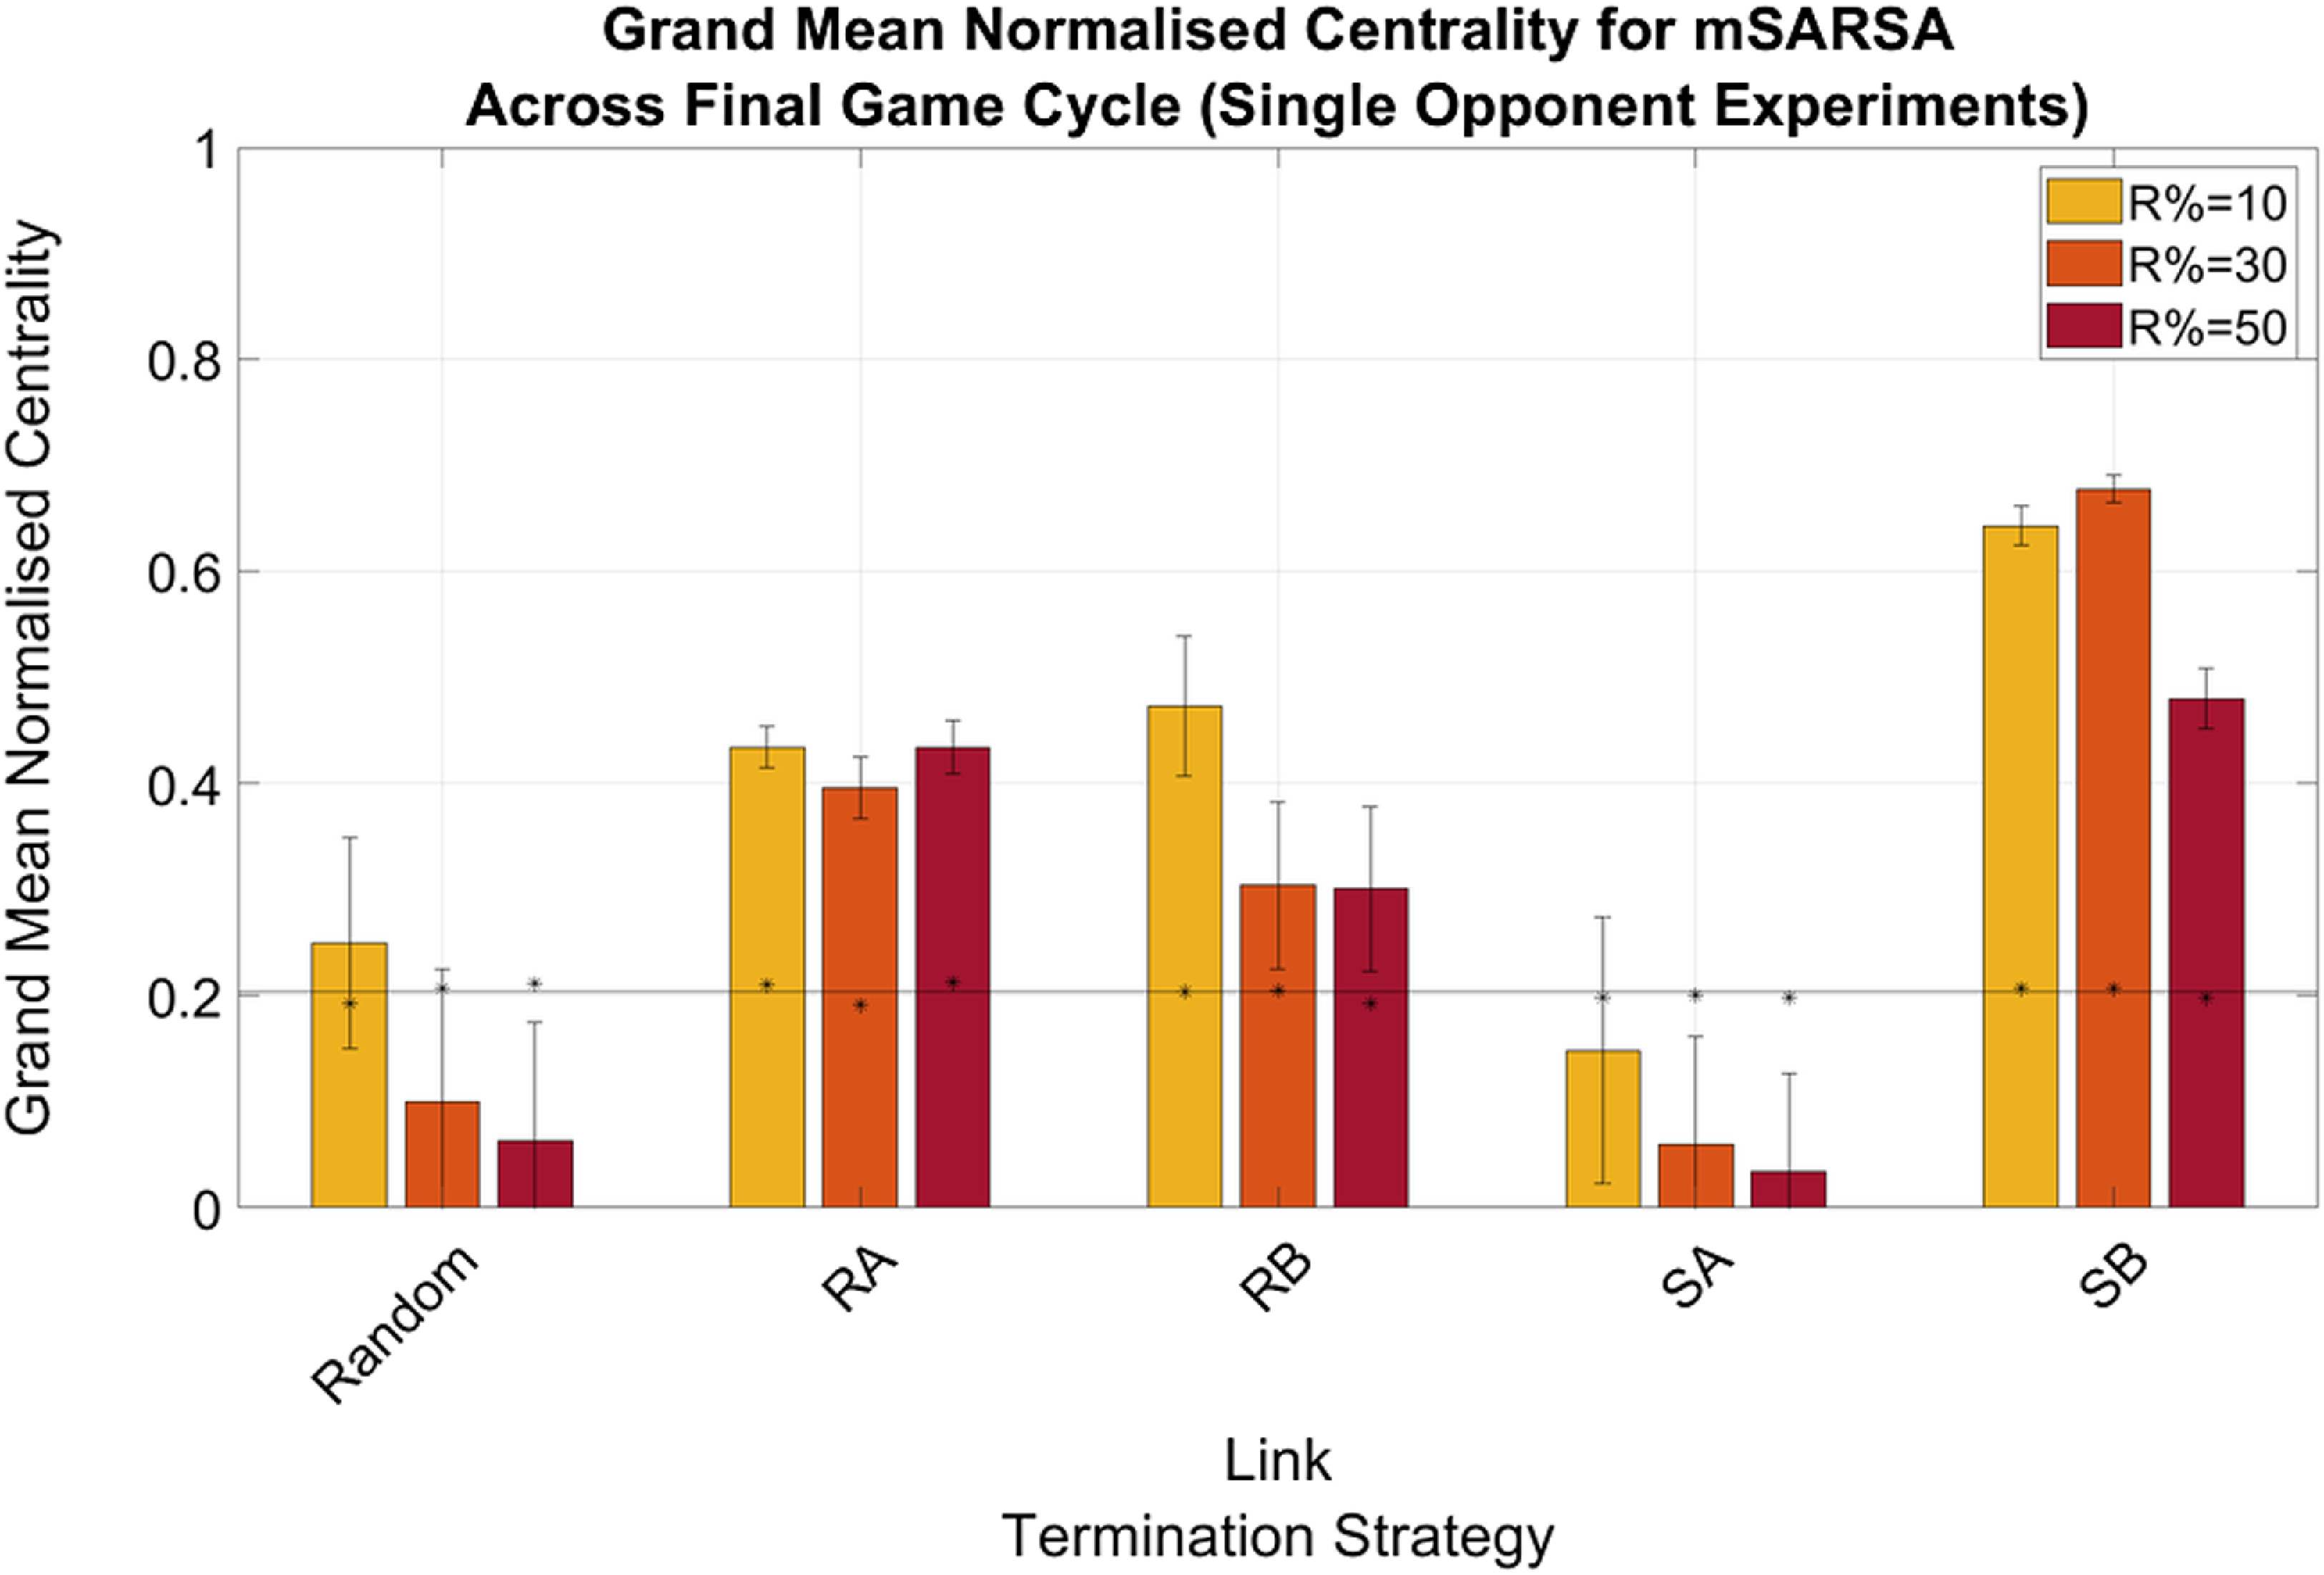
Figure 6. Summary graphs for Mean Normalised Actor Degree Centrality values for mSARSA agents within the final cycle of gameplay, Single Opponent condition. Data is presented as grand means across all agents within that time period, averaged over five simulative episodes, and displays the much greater normalized centrality of mSARSA agents under the SB condition over the alternative strategies. Asterisks (*) indicate starting values for that variable in the initial three rounds of the whole simulative period, and the solid black horizontal line indicates the baseline average, taken from simulation with no partner switching
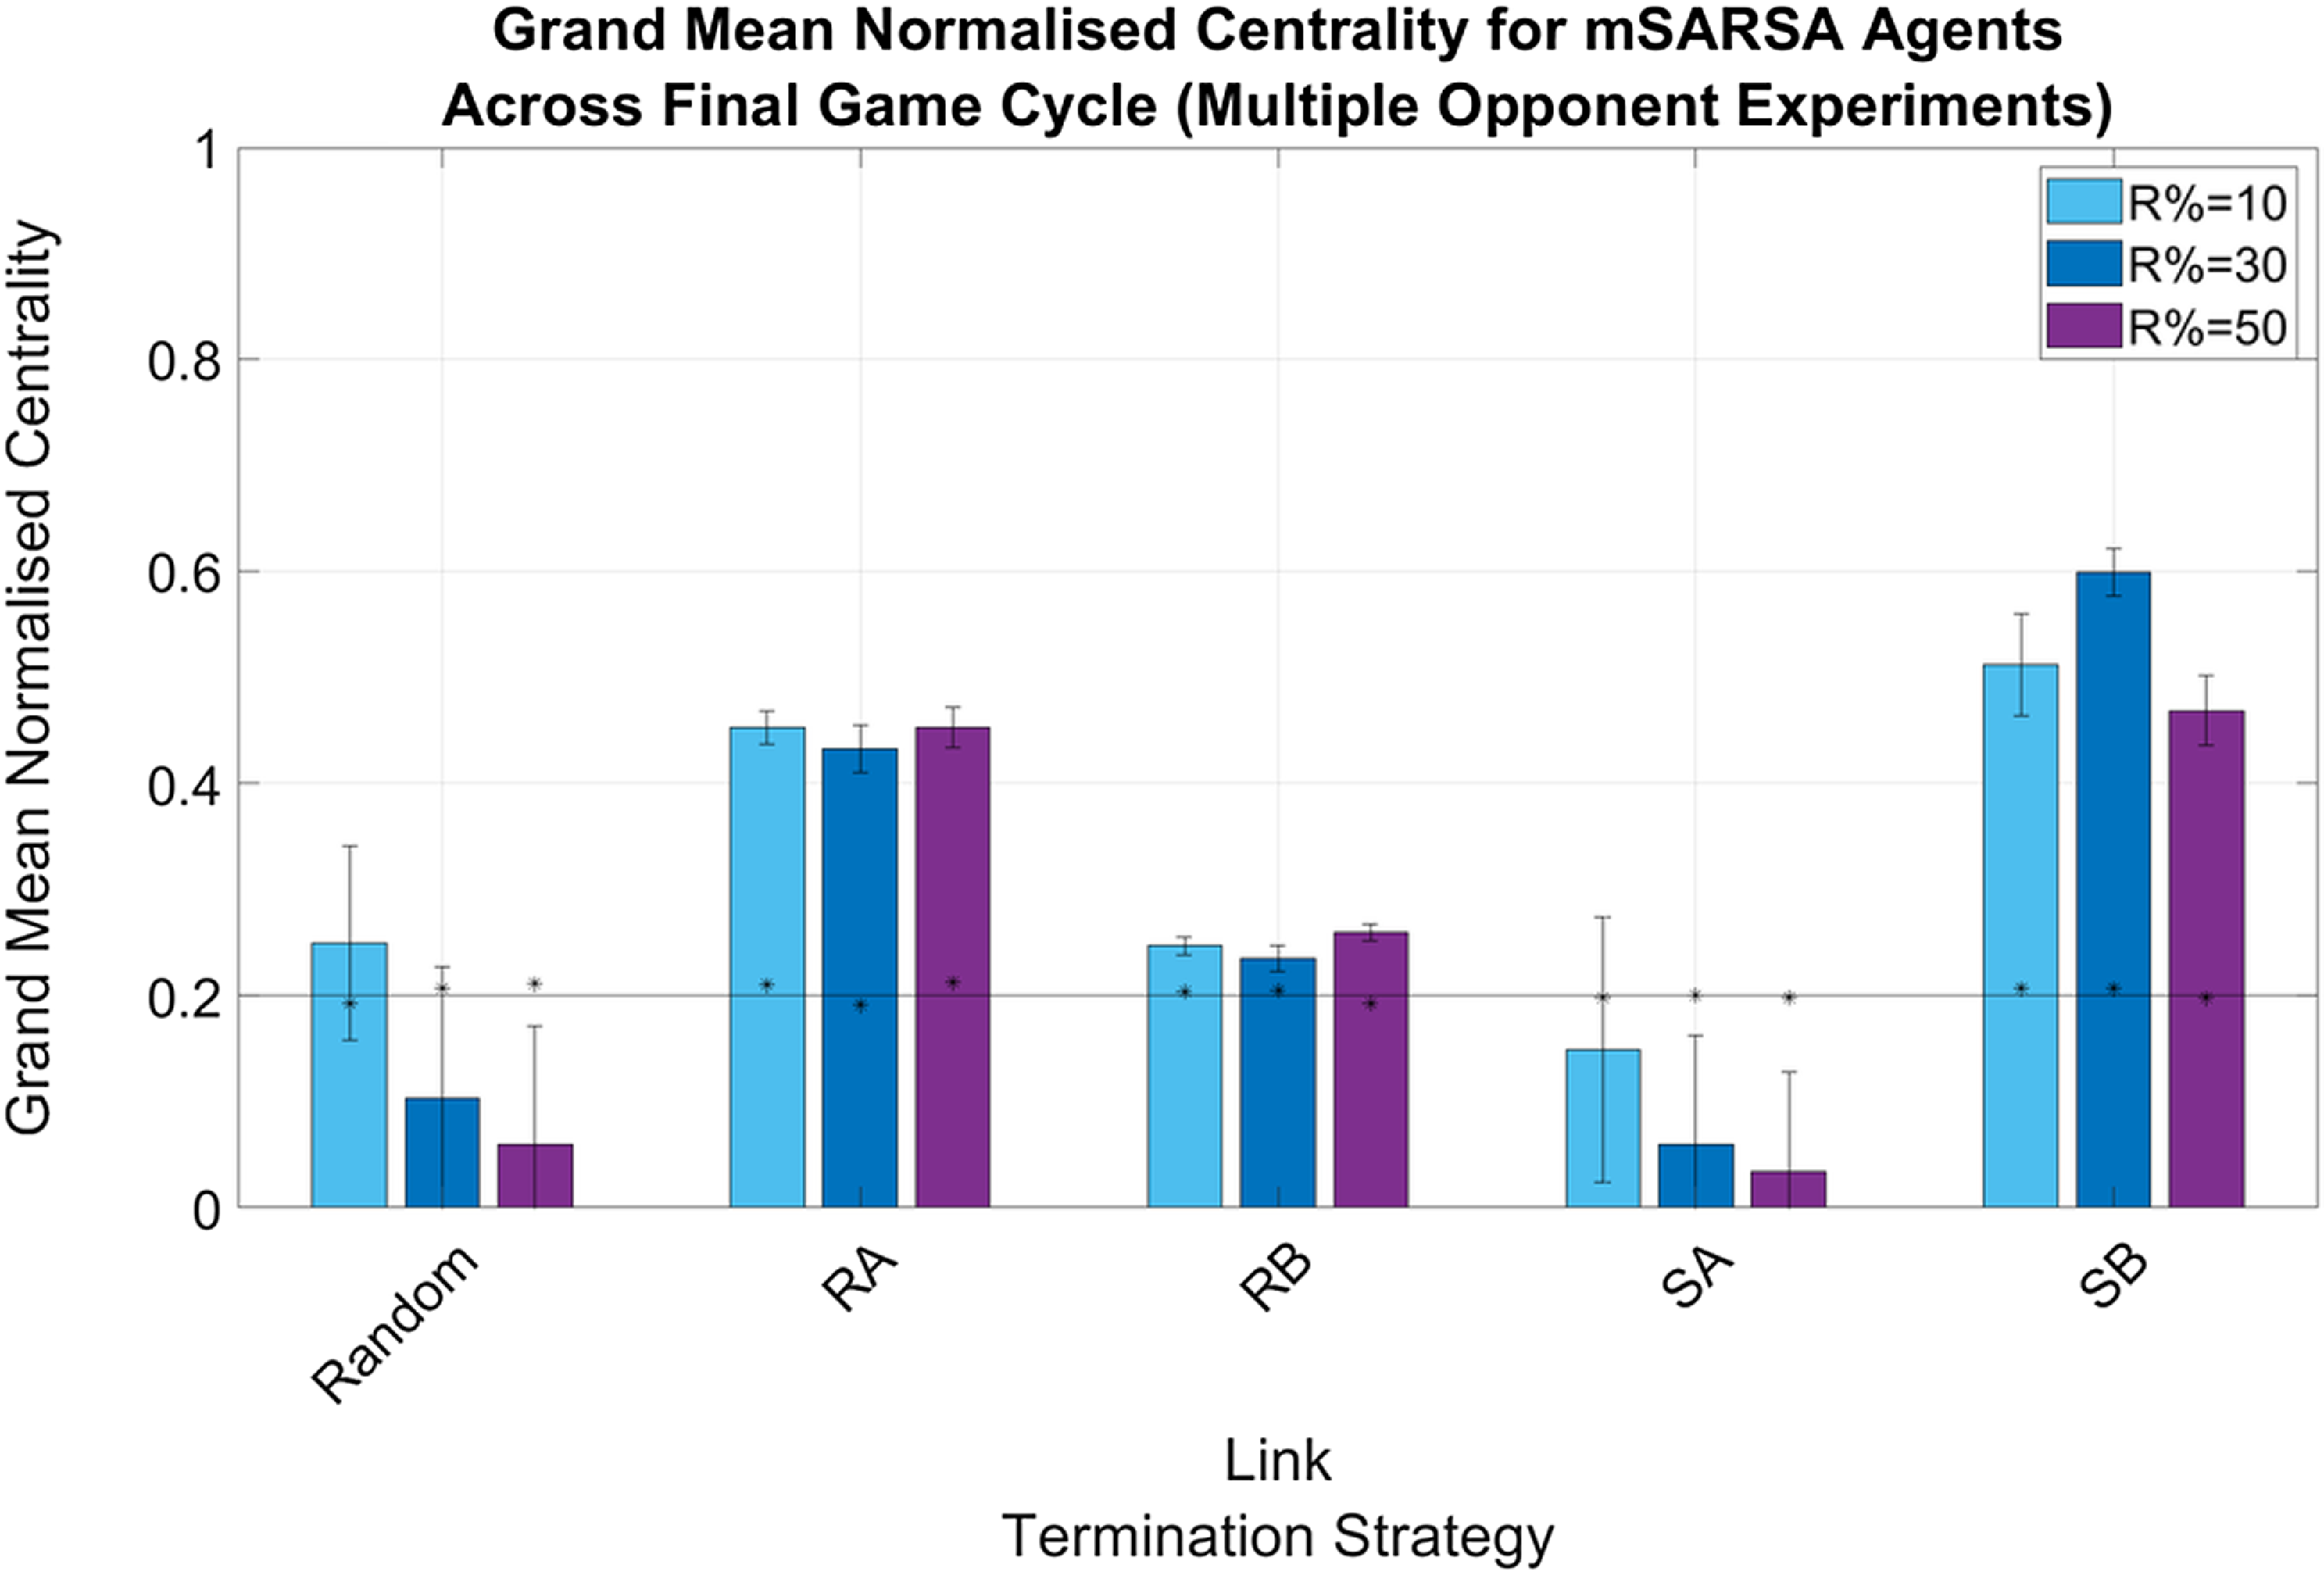
Figure 7. Summary graphs for Mean Normalised Actor Degree Centrality values for mSARSA agents within the final cycle of gameplay, Multiple Opponent condition. Data is presented as grand means across all agents within that time period, averaged over five simulative episodes, and displays the much greater normalized centrality of mSARSA agents under the SB condition over the alternative strategies. Asterisks (*) indicate starting values for that variable in the initial three rounds of the whole simulative period, and the solid black horizontal line indicates the baseline average, taken from simulation with no partner switching
Overall, in both network diversity conditions, SB appears to facilitate the greatest amount of connectivity for mSARSA agents—particularly at R%=30. The next most consistently connected strategy after this was RA.
4.0.4. Further data
As for other mSARSA variables, mood was high for all experimental conditions; with the exception of the RB strategy in the Multiple Opponent condition (see Figure 9), average mood in the final cycle was always above 40%. When the network was more diverse, mood overall was lower than in the Single Opponent conditions (see Figure 8), where it did not decrease below 60% and occasionally was higher at the end of the simulation period than at the beginning. This reaffirms the conclusions of Feehan and Fatima (Reference Feehan and Fatima2022), suggesting that SARSA is consistently able to exploit the structure of mSARSA, where mSARSA’s mood does not react sufficiently to the selfish behaviour of SARSA and act to protect itself from defection. The hope that the more updated version of the algorithm with greater mood update reactivity would be more competitive against SARSA alone has not been supported by this data—though this vulnerability may have been exacerbated by periodic forgiveness. Generally, it is the author’s hope to see a version of mSARSA tuned that has mood more sensitive to defection, even at such high volumes of interaction as in this study.
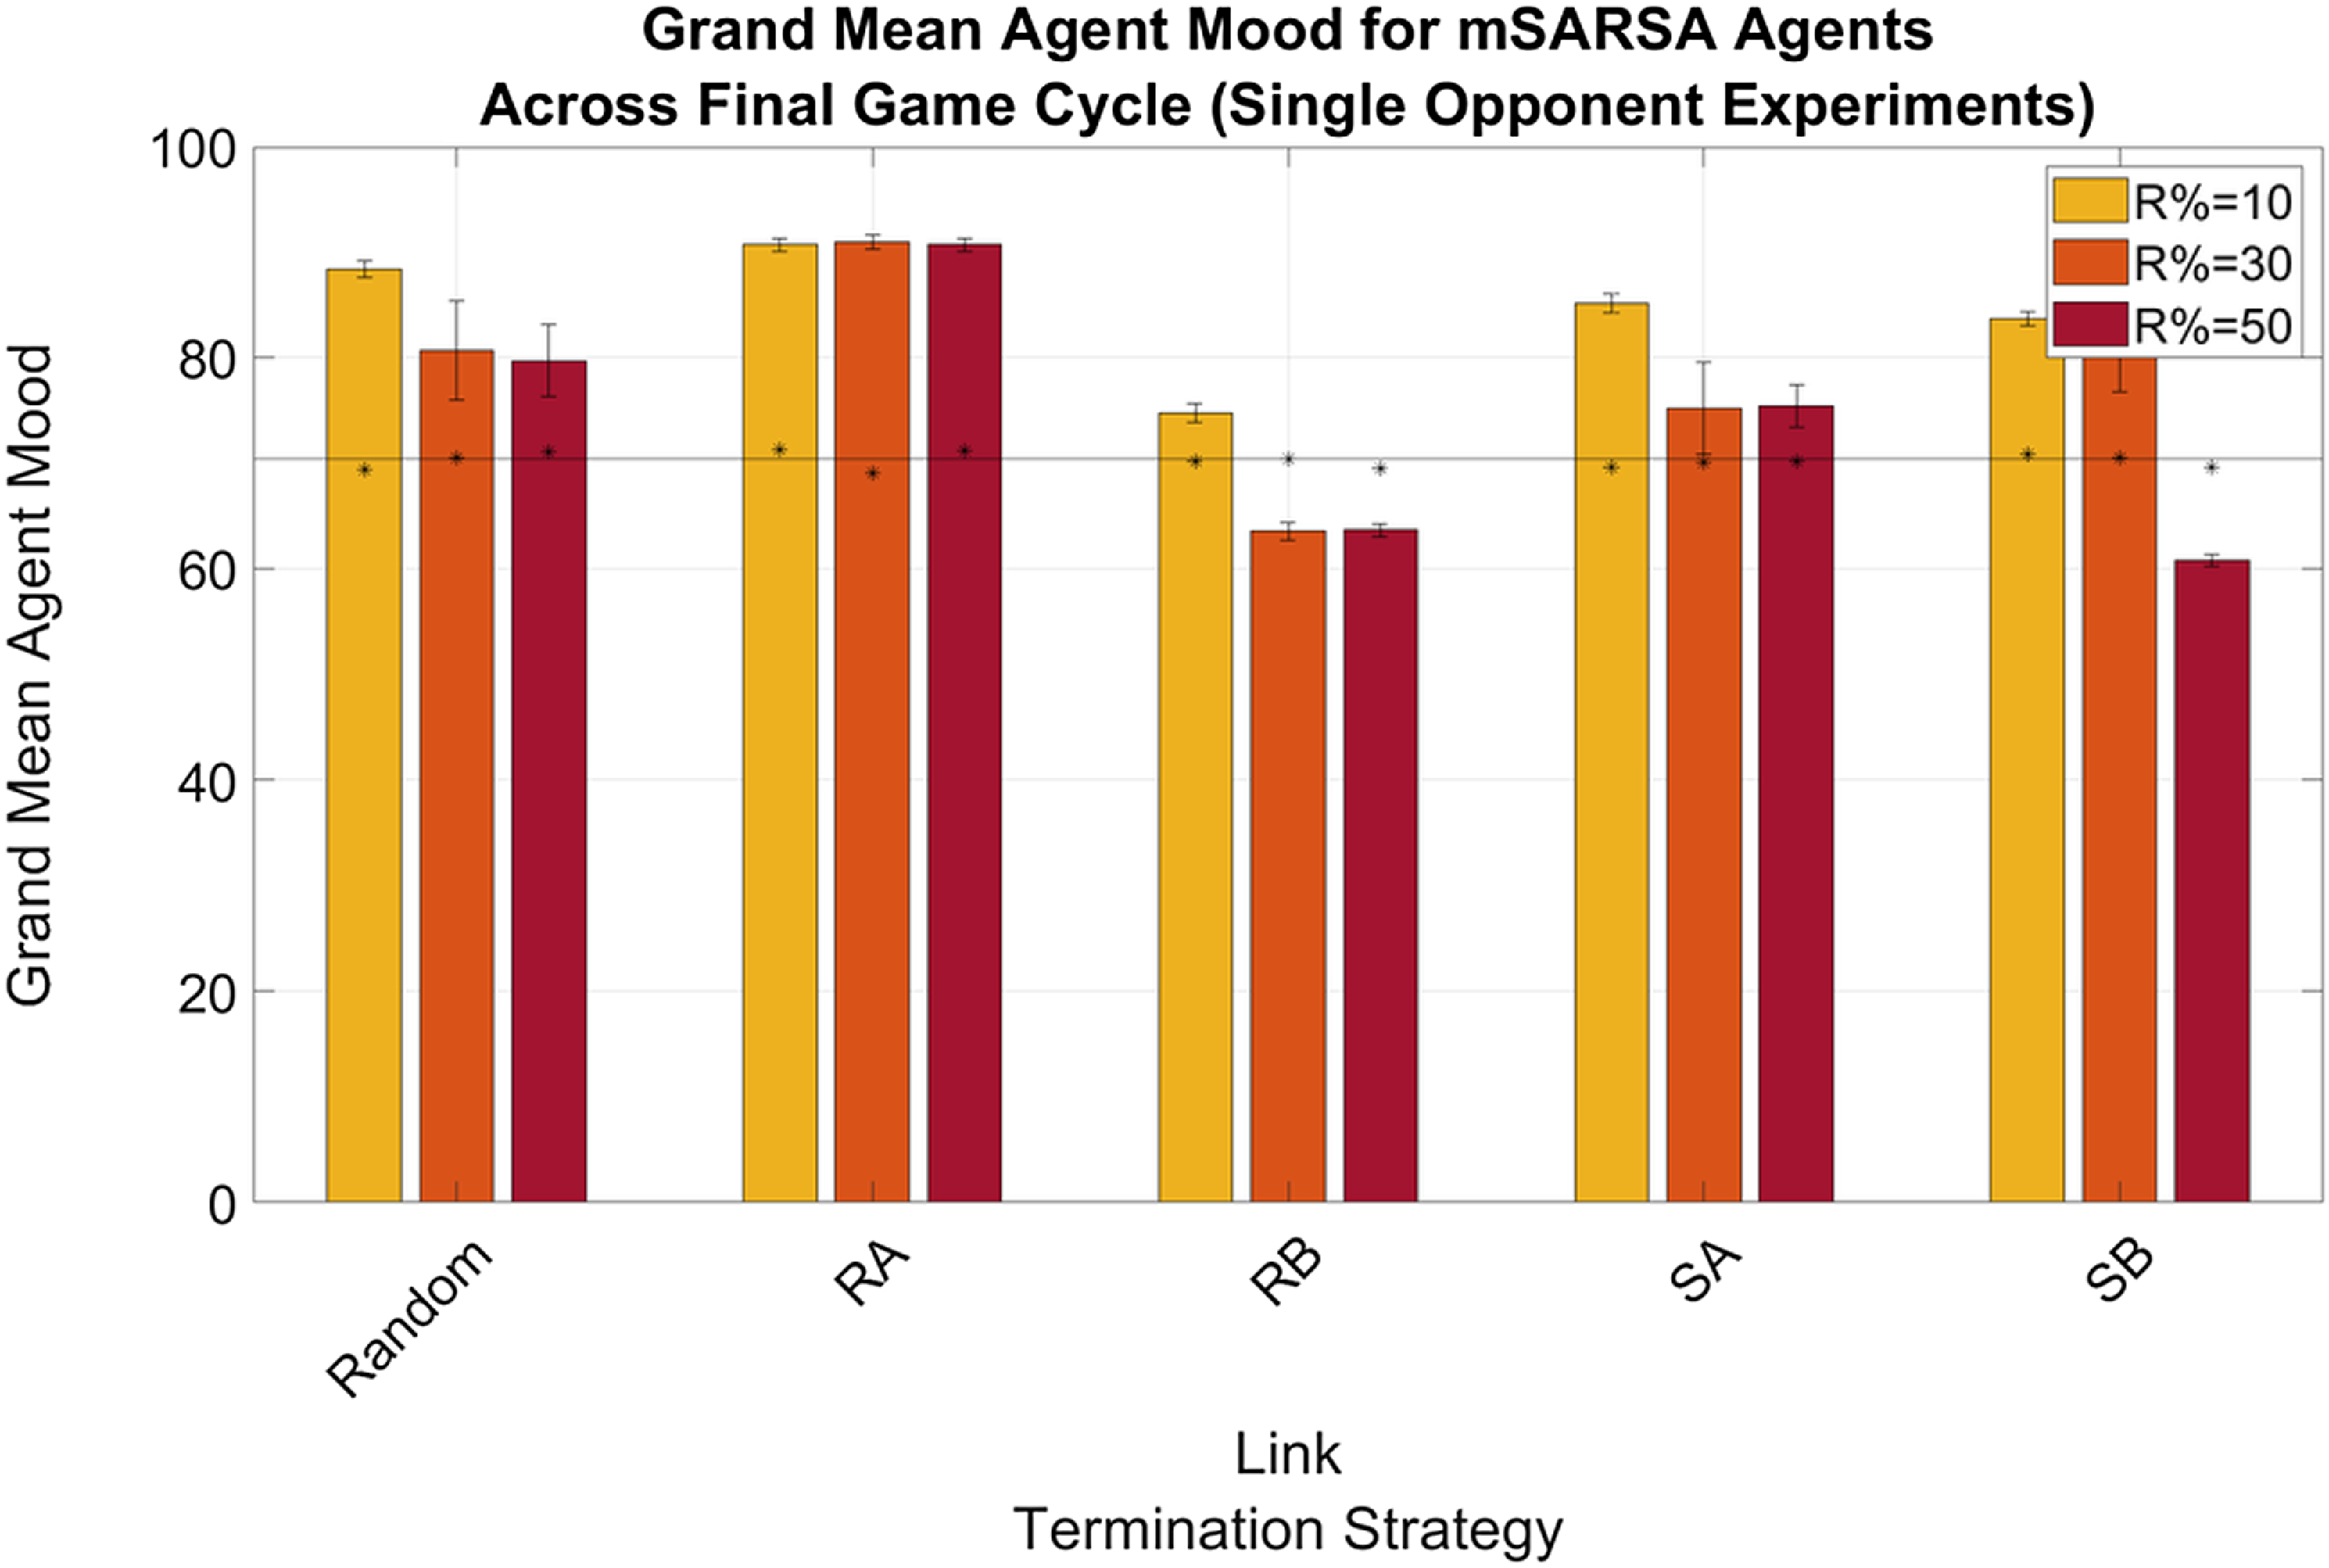
Figure 8. Summary graphs for Average Mood levels of mSARSA agents within the final cycle of gameplay, Single Opponent condition. Data is presented as grand means across all agents within that time period, averaged over five simulative episodes, and displays a high mSARSA agent mood value throughout. Asterisks (*) indicate starting values for that variable in the initial three rounds of the whole simulative period, and the solid black horizontal line indicates the baseline average, taken from simulation with no partner switching

Figure 9. Summary graphs for Average Mood levels of mSARSA agents within the final cycle of gameplay, Multiple Opponent condition. Data is presented as grand means across all agents within that time period, averaged over five simulative episodes, and displays a high mSARSA agent mood value throughout with the exception of the RB strategy. Asterisks (*) indicate starting values for that variable in the initial three rounds of the whole simulative period, and the solid black horizontal line indicates the baseline average, taken from simulation with no partner switching
Generally speaking, the mean proportions of similar partners mSARSA agents possessed were greater in the Single Opponent condition over the Multiple Opponent condition, which is considerably likely to be due to there being half as many mSARSA agents present in the environment in this condition to match with. In the Single Opponent condition, the RB and SB LTS aid in selecting and retaining partners of a similar strategy (at least 50%), with RA following a close third (∼40% across all values of R%). In the Multiple Opponent environment, RA and SB provide the greatest mean proportions of similar partners maintained, but even then this is only slightly above 30% of all links. mSARSA agents successfully select away from defection-prone SARSA. The SB LTS facilitates this effect best, with over 70% of mSARSA’s partners also using mSARSA as opposed to less than 10% for SARSA in the R% = 50 condition.
Data regarding other game-playing strategies outside of mSARSA are complex and not consistent across conditions, but do provide revealing context for the results summarized above. Across conditions, WSLS and TFT often cooperate more, score better and are occasionally more central—but this is heavily dependant on LTS. Throughout all of the following summation of the time-series results, SARSA consistently defects regardless of condition.
Under RA, WSLS cooperates the most, then TFT, then mSARSA. However, payoffs are roughly equally distributed across all strategies—mSARSA and WSLS earn slightly less than the other two strategies, but they all fall approximately equidistant between the mutually cooperative and mutually defective payoffs. Despite this, WSLS and TFT agents have slightly lower normalized actor degree centralities than those of the two learners.
Then, under RB, we see a very similar pattern to RA for cooperation in terms of hierarchy, with the exception that mSARSA tends much stronger and faster towards defection, only quickened to conversion by the increase in R%. In terms of payoffs, WSLS and TFT largely outperform the learners, and we see that these two have much higher normalized centralities than the learners, who are largely rejected under this threshold.
With SA, we see the reflection of the data already presented for mSARSA previously; at R%=10, WSLS and TFT cooperate more than the learners, but at any R% above this all four strategies cooperate very infrequently. TFT attains slightly greater payoffs in the lowest R% condition, but this again becomes minimal at higher levels, with SARSA attaining slightly greater payoffs than the other three. All four strategies experience high isolation under this LTS.
Lastly, under SB, we finally observe some trends consistent with the human model in Rand et al. (Reference Rand, Arbesman and Christakis2011). In terms of cooperation, TFT voluntarily cooperates in over 85% of its behaviours, closely followed by WSLS; examining this alongside data regarding homophily, we suggest that it is likely TFT and WSLS agents partnered together, alongside with themselves, as their proportions of similar partners were approximately 47% and 25% respectively. Regarding payoffs, TFT and SARSA attain better than WSLS and mSARSA, with the former pair very closely approaching mean payoffs of approximately 2.8 (particularly when R% = 30). Lastly, all three of the more cooperative strategies, TFT, WSLS and mSARSA, maintained much greater normalized agent degree centralities than normal SARSA; replicating the trend where cooperators were more greatly connected. Indeed, WSLS agents were the most central agents by this measure, attaining connectivity proportions of around 0.75.
5. Analysis and discussion
To reiterate from previous discussion, in past research, it has been observed that increased restructuring proportions in the links within human dynamic networks leads to increased—and more importantly, sustained—cooperation within the IPD (Rand et al., Reference Rand, Arbesman and Christakis2011; Gallo, Reference Gallo2022). Image-scoring is one proposed method that explains cooperation in risky social human paradigms (Wedekind & Milinski, Reference Wedekind and Milinski2000), as it provides useful social metrics by which to evaluate altruism in others, and its benefits to the emergence of cooperation have also been demonstrated in computational modelling (Fu et al., Reference Fu2008).
Humanlike reinforcement learners that have been shown to be more cooperative when structural changes are made to their learning environments (namely, the payoff structure of the IPD) are also, at their baselines, more naturally cooperative than their default counterparts (Collenette et al., Reference Collenette2017b; Feehan & Fatima, Reference Feehan and Fatima2022). In further exploration of the reactivity of this algorithm and its usefulness in modelling human behaviour, we have deployed it in behavioural simulation against a handful of other strategies, whilst incorporating these other elements from human literature to see if they produce similar effects at a multi-agent level.
Overall, there are a handful of primary conclusions we have drawn from the simulation data presented here, with consideration to the conclusions of previous research. With regards to our hypotheses, some appear to be conditionally fulfilled, whereas others seem to have found opposing trends to that of previous research. We outline each of these conclusions in the points below, with evaluation as to the cause and significance of each outcome.
-
H1. There were no consistent patterns of cooperation or centrality between the Score and Reputation LTS categories; for example, even when the RB and SB strategies earned similar payoffs in the mixed environment (payoffs of ∼1.5, Figure 2), the RB strategy voluntarily cooperated a fifth as frequently as agents utilizing SB did (Figure 3). This particular finding follows common sense; Reputation LTS evaluate a partner’s global poor behaviour, whereas Score LTS are more focused on an agent’s own performance. These will naturally lead to different selection patterns given the focus of the underlying metric—though these differences do not follow a linear trend and seem to depend more on thresholds used. mSARSA reacts behaviourally to differing network dynamics when they are being altered by different rules and thresholds, where little to no such reactivity was evident in our implementation of SARSA. This leaves vast scope for the designing and selection of future LTS, and their thresholds, for the elicitation of certain behaviours from mSARSA in modelling.
-
H2. Cooperation is greater than the static baseline under a LTS that discards partners randomly, as network exploration is beneficial to finding cooperators even without strategic evaluation of those connections (Figures 4 and 5). This concurs with discussion in Melamed et al. (Reference Melamed, Harrell and Simpson2018). Beyond this, cooperation in image-score-inspired LTS is only higher than the static baseline given specific conditions that differ when the network is less diverse. Network mutual cooperation, overall, only reaches similar levels to those seen in Collenette et al. (Reference Collenette2018b) (with a nearly comparable network diversity) when the SB LTS was used, meaning mutual cooperation rates in our networks were lower overall by comparison. The presence of SARSA, with its high propensity for defection, is likely the cause of this. This emphasizes that termination strategies should be designed carefully when including reinforcement learners in the network if we aim to replicate human models; those with softer thresholds that evaluate partners based on score, in this instance, exhibited more humanlike trends than the other LTS tested.
-
H3. Stricter threshold values do appear to lead to greater social punishment for reinforcement learners—even more generous ones such as mSARSA—as evidenced by the lower values of centrality for mSARSA agents under the RB and SA conditions (Figure 7). This leads to reduced cooperation in both instances, as moody agents are rejected when they explore through more stochastic play. Interestingly, exploring in the diverse environment under RB specifically leads to reduced cooperation rates ( $<=5\%$
) for mSARSA and therefore mitigated payoff reduction in comparison to the less diverse environment (Figure 6). This demonstrates that the addition of other strategies for mSARSA to learn from, with the combination of RB, leads mSARSA to defect more on the whole.
$<=5\%$
) for mSARSA and therefore mitigated payoff reduction in comparison to the less diverse environment (Figure 6). This demonstrates that the addition of other strategies for mSARSA to learn from, with the combination of RB, leads mSARSA to defect more on the whole. -
H4. In contrast to our expectations, there were certain conditions for the Multiple Opponent environment in which mSARSA cooperated at similar levels to SARSA; under the RB LTS entirely and under the SA LTS when R% was greater than 10. The very low proportions of similar partners for mSARSA under these conditions (<10%) suggests that when exposed to TFT and WSLS and utilizing these LTS, mSARSA chooses to defect more often (Figures 4 and 5), as opposed to the much higher proportions of similar partners (and greater cooperation) in the Single Opponent condition (Section 4.0.4., Paragraph 2). Because mSARSA also has low Normalised Centrality under these conditions (Figure 7), we can assume moody agents are only interacting with SARSA agents in these conditions. Typically, as the less diverse environment demonstrates, mSARSA is more predisposed to cooperating (Figure 4) and is therefore more exploited by any partnered SARSA it encounters, scoring less (Figure 2). However, when they learn in a more diverse environment, this cooperation is reduced; therefore when they are rejected (via the harshness of these particular LTS thresholds), they continue to defect more and are therefore better prepared against exploitation. This means that when exposed to these simple strategies, under these LTS, the exposure of mSARSA to a broader variety of strategies earlier in the learning process encourages defection to the extent of consistent self-protection against exploitative selfish strategies when the network experiences sparse connectivity.
-
H5. The most interesting conclusion regards the replication of observations from past research manipulating R%. We observed similar trends to human behaviour from mSARSA in only one of the LTS; SB, the score-based strategy with the softer selection threshold value of 2. At first glance, both the RA and SB LTS both exhibit the increase in proportions of cooperation (Figure 4) when R% is increased from 10 to 30 (as in the study with humans)—this cooperation is sustained, as it was in humans, but this is less unusual as mSARSA does not typically exhibit any decay of cooperation in a similar manner to that of human play. However, only under SB do we see the other related effects discussed by Rand et al. (Reference Rand, Arbesman and Christakis2011) and Gallo (Reference Gallo2022). Cooperators are much better connected than defectors under SB, with higher levels of strategy homophily. Within the last quarter of the experimental period, mean cooperation (and payoffs) for mSARSA exhibit a substantial dip—the cause of which is not immediately clear—but the strategy is able to recover from this to re-establish the previous level of cooperation with continued play. These dips are only observed in conditions where R%≠30. This initial work exhibits the behavioural trends observed in Rand et al. (Reference Rand, Arbesman and Christakis2011) with human participants, though the disruption of behaviour in the later phase requires more in-depth study to evaluate properly.
-
H5.1. In addition to the above, the increased R% value of 50 tends to have the effect of decreasing cooperation levels in almost all LTS for mSARSA (particularly in Figure 5); perhaps a unique effect to computational networks, though this could explain the only minimal increases in cooperation in Gallo (Reference Gallo2022) at R% = 50 over R% = 10. It is also worth highlighting that all game-playing strategies are to some degree influenced by increased values of R%, though in different ways (e.g. proportions of cooperation for TFT under SB increase linearly with R%, including at the 50 value). Given that the behaviour exhibited by mSARSA under the SB LTS is similar to that of both Rand et al. (Reference Rand, Arbesman and Christakis2011) and Gallo (Reference Gallo2022), in that cooperation is increased in trend with both (but greater under R% = 30, which was not tested in the latter of the two studies), we suggest that the SB LTS in these circumstances has the greatest potential for aligning with human model data, moving forward.
-
H6. A threshold of 3 for score-based link termination (Threshold SA) indeed resulted in lower connectivity for mSARSA agents, across all conditions, leading to reduced payoffs (Figures 2 and 3), less similar partners (Section 4.0.4 ., Paragraph 2) and lower voluntary cooperation (Figures 4 and 5). The lowest value of R% appeared to mitigate this negative influence by virtue of reducing the number of opportunities for partner rejection, providing ∼10% greater similar partners, ∼18% more voluntary cooperation and an approximately 280% increase in payoff in the more diverse environment alone (Figure 3). Threshold SB, however, appeared to best facilitate late-stage increases in cooperation and connectivity of all LTS, whilst allowing the learning agents with the increased propensity to cooperate (mSARSA) the opportunity to explore in earlier cycles. Together, these show that very rigid thresholds create difficult situations for learners to grow within; in fact, the entire network suffers and declines as a result, as seen by the low proportions of overall connectivity and mean payoffs across all strategies. However, the ease of changing network behaviour through the reduction of this threshold by a single point (to 2, in SB) demonstrates how vastly different behavioural changes are with just small alterations to threshold. These thresholds should be carefully navigated by future models as too restrictive on the growth of cooperation, with thresholds that change over play potentially working well for adaptive strategies like mSARSA.
-
H7. In the Single Opponent condition, mSARSA agents were more central under RA, RB (slightly, with peaks under R% = 30) and SB (see Figure 6). Under SB, R% = 30, mSARSA agents are able to attain centrality values almost as high as 0.7 (in comparison to just under 0.25 for SARSA). As SARSA agents cooperate much more infrequently, mSARSA agents in the Single Opponent condition are able to discard them as opponents with greater ease, whilst maintaining links to mSARSA agents who require flexibility to explore but can maintain greater cooperation levels (behaviour that is rewarded under the softer threshold). This conclusion is reaffirmed with the homophily data, as discussed in H8. With this, we demonstrate that the mood structures that facilitate greater cooperation in mSARSA interact with certain LTS to produce enhanced pro-sociability with both like-minded agents and similarly generous agents when they are available (such as WSLS and TFT). Better connectivity with more cooperative partners under the SB strategy over the default learning parameters of SARSA shows promise for mSARSA in social contexts.
-
H8. mSARSA agents do maintain a higher level of homophily in the Single Opponent environment under the RB and SB LTS specifically, successfully selecting away from defection-prone SARSA (as described in Section 4.0.4 ., Paragraph 2). Such small values are explained by the low connectivity overall (SARSA having normalized centrality values of 0.2 for this same condition). As discussed under the previous hypothesis, this maintains the prosocial advantages that mSARSA maintains over basic SARSA with the addition of partner selection. In the more diverse environment, the learning strategies are more similar in terms of patterns of connectivity and homophily, with SB and RA at R% = 10 being the exceptions. The conditions under which exploratory cooperators can flourish mean that mSARSA outperforms SARSA here, as SARSA agents are selected against.
-
H9. As opposed to our prediction, a distinct homogeneity of outcomes was observed in strategies utilizing RA; all game-playing strategies in the network experienced approximately the same levels of payoff rewards and normalized centrality values (for an indication of value, see Figures 3 and 7 respectively). Cooperation levels (as discussed in Section 4.0.4 ., Paragraph 4) were also more similar under this LTS than RB and SB, but still exhibited a hierarchy in which WSLS cooperated the most, then TFT, then mSARSA (whose levels can be found in Figure 5) above SARSA. Because partner rejection is based on how often a partner has betrayed, we see this dynamic threshold—in comparison to how many betrayals the deciding agent has performed—as less functional to game-players in terms of social partner evaluation. All agents in the diverse network will have chosen to betray at some point; learners through their exploration, TFT through copying a defection coincidentally against a partner who then cooperates (such as an explorer, or a partner using TFT or WSLS who is switching), or a WSLS who does not experience resistance to betrayals. Because these agents are comparing against their own personal levels of betrayal when they judge others, they are much less discriminating than under other LTS and therefore have much less consistent overall standards of acceptable partner play. The use of the pure cumulative count of betrayals, too, was on reflection poorly chosen. In future work, more thorough pre-experiment evaluation of the variance within this metric should be performed; it would likely benefit agents to use an abstracted summary variable for betrayals instead of the actual value, also.
-
H10. Following the trend of noted high performance of TFT in Collenette et al. (Reference Collenette2018b), TFT and WSLS both repeatedly outperformed the learning strategies across all conditions and metrics, with the exception of under RA, where they cooperated more but scored similarly and were similarly as central to the learners, and SA, in which all agents performed poorly due to restrictive partner judgement thresholds (Section 4.0.4 , Paragraphs 3 through 7). We suspect that the strengths of the more simple strategies, particularly in an environment with reinforcement learners, are due to the speed of their reactivity and in the formulation of their behavioural trends. Learners are influenced by exploration rates, the types of opponents they are exposed to, and so forth; the more blunt approach of both TFT and WSLS, regardless of partner type, appears to serve them well. With the addition of LTS, they can also exclude partners who do not satisfy them, benefiting them even more.

General explanations for the data come through the examination of the thresholds used for each strategy. We see that some of the thresholds have a very restrictive influence on behaviour, limiting cooperation and centrality. Agents with less complex behavioural structures, that are quicker to fall into mutual cooperation (TFT and WSLS) are able to thrive better under these conditions, but learners—who explore more randomly—are punished socially. In the more diverse network environments, mSARSA is excluded from play by cooperators under the stricter thresholds (comparison with the network mean, in RB, and score comparison with the goal of 3, in SA), leaving it to play the IPD against either itself, or SARSA. In comparison with the data from Feehan and Fatima (Reference Feehan and Fatima2022), where a static grid network was utilized with enforced play between SARSA and moody agents (utilizing an earlier version of mSARSA), we see distinct differences in the proportions of outcomes. In the directly comparable Single Opponent condition it is demonstrated that all variations of the RA condition and two of the three SB conditions exhibited greater proportions of voluntary cooperation than this previous paper—this is likely due to the fact that there are now homogeneous interactions occurring in this different network structure, in which some cooperation will be more readily rewarded.
Values such as mood and cooperation decline under the Random and SA strategies when R% increases. This can be explained through the observation of the proportion of similar partners for these conditions. The Random strategy’s variance means that approximately half of all reviewed partners are discarded—and this effect can be seen similarly in SA, where the threshold is so strict that most partners who have not mutually cooperated (or permitted the occasional exploitation) will be removed. When R% increases, this occurs to a greater degree as the amount of links under review in each R e is greater. It is better (across measures of cooperation, centrality and payoff earned) to use a random strategy if the network does not permit a large proportion of link alteration than it is to use the SA LTS. Some LTS were no better than Random at a low R%—RA and SA, in either network diversity condition, received lower mean payoffs in the final cycle than Random at R% = 10, despite cooperating similarly. Out of these two, RA was more connected than Random, however—whereas those using SA were much more isolated. This propensity for a Random strategy to still attain positive outcomes by comparison is noted in previous research, also (Melamed et al., Reference Melamed, Harrell and Simpson2018).
The RB strategy’s low proportion of similar partners in the Multiple Opponent environment is likely due to RB’s rejecting, selective nature. Strategy RB, in which agents compare betrayals against the network mean, leave mSARSA agents connected with only a few select partners that they can then interact with. Moody agents receive the second best payoff levels of all strategies under RB, but are more sparsely connected, in the poorest moods, are at their most uncooperative, and interact with themselves the least. This demonstrates the effect, then, that selecting partners who are in the top half of all in the network when regarding how often they betray facilitates more logical, less cooperative network game-playing.
In an overview of mood in this study with comparison to previous research, we find that mood remains a somewhat consistent influence on cooperation, but interacts inconsistently with the introduction of the LTS dynamics. In Collenette et al. (Reference Collenette2017b), when the influence of mood on mSARSA learning increases, mutual cooperation increases and mutual defections decrease; the cause of which is ascribed to mood increases in the general population, in which the mood mechanism is designed to increase the selection of C behaviour. Agents receive payoffs, which increases mood, which leads to even greater raising of mood as more R outcomes are attained. Then, we see this general trend reiterated in Feehan and Fatima (Reference Feehan and Fatima2022), albeit at a more suppressed level. Although there is little explicit mood data reported from Collenette et al. (Reference Collenette2017b), in Feehan and Fatima (Reference Feehan and Fatima2022), mood rose quickly to ceiling and remained there—with mutual defection being the greatest average reported outcome when mSARSA played against SARSA. There, we see that despite mood being high, cooperation is not always a given—this is true in this study also, with differences observed between LTS.
In this research, mood is again generally very high against SARSA. Lower moods (RB, R% > 10 and SB, R% = 50) attained some of the highest payoffs against SARSA—this makes sense in this environment, as defecting in such a defection-prone opponent environment will lessen exploitation outcomes (lower centrality and cooperation levels equate to higher payoffs here—SB, R%=50 is the best example of this). With the exception of SA, which is an unusual case in that agent connectivity in general is very low (see the low proportions of centrality in Figures 6 and 7), the trend of cooperation to mood is almost exactly the same between the differing LTS conditions.
Mood can be inconsistent, however, as a general predictor of behaviour; in the Multiple Opponent condition for example, agents are happiest when they are most isolated (even from themselves), cooperating less and earning less under strategy SA. The influence of individual payoffs are large when an agent has few partners, likely leading to inflated moods despite this context. Conversely, when agents are still maintaining connections and cooperating very little (despite earning nearly the greatest payoffs levels of all LTS), their moods are very low. The mood construct, at a very basic level, is designed to increase cooperation at high levels and increase defection at low moods. These inconsistencies, particularly in mixed strategy environments, are potentially an area for review in regards to the architectural functioning of the algorithm—if they are brought about by interaction with decision-based partner changes within a social network, then this interaction must be more clearly defined with further research.
6. Conclusions
This piece of research has tested a conjunction of human- and agent-influencing experimental parameters in order to evaluate the moody SARSA algorithm in different dynamic network contexts. Overall, we still consider it to be a very promising, more cooperative variation on the algorithm it was augmented from—even more so that we continue to add to the list of parameters that seem to influence its behaviour in ways that are reminiscent of human trends. Its robustness as a functional model in the face of exploitation we still feel could be improved, as we still find inflated moods despite poor outcomes across numerous contexts (despite the augmentations made in Collenette et al. Reference Collenette(2018b)); this requires more research as to avenues of diversification for the algorithm, perhaps returning to previous synthesis with emotion simulation (Collenette et al., Reference Collenette2018a) or the alteration of how it evaluates its own performance (namely the use of the Homo Egualis model).
We also add conditional support to the conclusions of Rand et al. (Reference Rand, Arbesman and Christakis2011) and, to some extent, the extension of this work through Gallo (Reference Gallo2022). By combining a slightly more humanlike learning algorithm with a selection of proposed humanlike partner judgement mechanisms, we attempted to test agents that recreate the processing of humans in their research, evaluating this through the likeness of the data to the human model. This was true under the SB strategy and though the actual levels of cooperation exhibited do not even closely approach that of human players (Hauk & Nagel, Reference Hauk and Nagel2001; Rand et al., Reference Rand, Arbesman and Christakis2011; Wang et al., Reference Wang, Suri and Watts2012), or non-learning agents (Fu et al., Reference Fu2008; Qu et al., Reference Qu2016), the trends of behaviour shown suggest its potential usefulness in further research. In particular conjunction with the R%=30 restructuring rate, the RB strategy facilitates the greatest centrality, voluntary cooperation, mutual cooperation and payoffs within our environment, consistently.
Here, we only tested two very specific thresholds for each LTS, but there are a great variety of thresholds that could have been chosen (including variable thresholds as opposed to static), and quantitative work exploring these thoroughly would be a strong selection for follow-up investigation at a larger scale. More depth of understanding is also required regarding the interaction of other structural features of our simulation, such as the effect of forgiveness events and restructuring frequency on the individual strategies. In addition, recent similar work has highlighted the importance of the influence an agents’ depth of evaluation on learned outcomes, contrasting local partners (as we examined in this work) with global observations (Jia et al., Reference Jia2021). Whilst the moody conditional cooperation under examination is more a classification of emergent behaviour in this other work, and distinct from the mood defined here, it would also be of interest to examine such effects within mSARSA in future.
Acknowledgements
The authors would like to offer thanks for the funding provided by Loughborough University and UK Research and Innovation (UKRI), upon which this paper and the research within it was constructed. We also offer appreciation to the original authors of the Moody SARSA algorithm, Joe Collenette and colleagues, for their initial assistance and clarity in provision of their algorithmic code.
Declaration of competing interests
The authors declare no competing interests for this piece of research.


 Open access