

Background
We previously developed a standard set of validated research participation experiences measures, the long Research Participant Perception Survey (RPPS-L), for local and national benchmarking and performance improvement [Reference Kost1–Reference Kost4]. In the course of validation, we fielded the survey to research participants at 15 National Institutes of Health -supported research centers. Analysis of 4961 completed surveys identified a number of actionable items for improving the research participants’ experiences [Reference Kost3, Reference Kost4]. Despite the value of these outcome data, we realized that the 72-question RPPS-L had 3 limitations: the survey length, the logistics and cost mailing the survey, and the relatively modest response rates when mailed [Reference Yessis2, Reference Kost4]. Academic and industry stakeholders expressed interest in a shorter RPPS questionnaire, and we sought to address these limitations with survey redesign. The fact that a multiple regression analysis of the original RPPS-L fielding data identified 6 questions within the survey (“6 key questions”) that accounted for the majority (96%) of the variance in respondents’ overall rating of their experiences [2] suggested that a shorter survey incorporating these core questions might provide similar key performance information, while likely decreasing participant burden and improving response rates.
As electronic platforms increasingly are used to communicate with patients and research volunteers, electronic fielding through email or other internet interfaces provide an inexpensive mode for reaching participants to validate a shorter survey and potentially improve response rates. It is well recognized with patient-care experience surveys that outcomes and response rates differ by fielding mode (e.g., mailing, internet, phone call) such that the Center for Medicare Services requires standard score adjustments depending on the fielding mode [5]. Thus, any change in the fielding mode of a survey validated through mailing would require revalidation in the new mode to be used. Another variable that may affect survey response, the use of compensation, is a topic of ongoing research; the impact of incentives on survey validity and outcomes may depend on the investment of the target population in the particular survey topic [Reference Barge and Gehlbach6, Reference Toepoel7]. In the current study, we sought to compare the performance of the original survey (RPPS-L) with that of 2 new shorter survey versions, RPPS-Short (RRPS-S) and RPPS-Ultrashort (RPPS-U). Using an on-line platform, with and without compensation, in a large cohort of diverse self-identified research volunteers, we sought to determine the impact of survey length, survey platform and compensation on survey validity, reliability, response rate, sample demographics, and participant-centered outcomes.
Methods
Ethics
The work described herein was reviewed and approved by the Rockefeller University Institutional Review Board before the conduct of any research.
Survey Instruments
RPPS-U, RPPS-S, and RPPS-L contain 13, 25, and 72 questions, respectively. All of the survey versions share a common backbone of 13 questions included in the RPPS-U survey: 5 questions collect characteristics of the respondent (age, gender, race, ethnicity, education level), 2 questions assess overall ratings (overall rating and would recommend), and 6 questions are the key actionable questions identified within the original RPPS-L as accounting for 96% of the overall rating score [Reference Yessis2]. An actionable question asks whether or how often something did or did not happen, as opposed to questions that collect descriptive (e.g., study duration, study intensity) or subjective (rating of motivations) assessments. The RPPS-S instrument contains 9 additional questions about motivation to join, leave or stay in a study, more detail about past research experience, and additional partnership and trust questions of which 3 are actionable. The RPPS-L contains additional actionable and descriptive questions [Reference Yessis2]. All survey versions include an open text field at the end of the survey to collect additional comments from the respondent. Survey versions and questions are shown in online Supplementary Appendix S1.
Sampling and Testing Algorithm
The sample population was drawn from a large national research volunteer registry (ResearchMatch© [Reference Harris8]); at the time of fielding, the registry contained ~69,000 enrollees interested in research participation. Data regarding overall registry demographics (race, gender, ethnicity, and state of origin) were recorded from the registry Web site.
Registry enrollees age ≥18 years were contacted anonymously through the registry’s recruitment platform. Contact messages offering information about a survey opportunity, with brief eligibility information, were distributed to random samples of the registry in unique batches of 2000 participants, according to the registry’s sampling algorithm.
When registry recipients respond to a contact message, the registry search engine returns to the investigator the name, demographics and contact information of those who express interest in the study, and the reasons for declination of those who demur. Among nonrespondents to the message, the investigator cannot distinguish an implied declination from an unopened, or undeliverable message.
Interested registry volunteers were randomized to receive an email from the investigator providing a personalized hyperlink to one of the 3 surveys hosted on a commercial on-line survey platform (www.Surveymonkey.com). Individuals clicking on the survey link encountered informed consent information including an estimate of the time required to complete the specific survey offered (3–5, 5–7, or 20 min, for RPPS-U, RPPS-S, and RPPS-L, respectively), notice that individuals completing the survey would be offered the survey again in 7–14 days for optional retesting, and an eligibility question. Individuals who indicated that they were eligible and interested to proceed then progressed to the survey questions. The survey platform tracked whether the individual did or did not open the link, started and completed the survey, or had blocked the survey administration platform a priori.
Eligibility
To be eligible to complete the surveys, individuals had to have enrolled in at least one research study, excluding on-line survey studies. After self-referral based on the contact message, an explicit eligibility question served as a second screen for eligibility. Ineligible respondents who made it through the self-screen and attempted to start the survey were diverted to “submit” without completing the rest of the survey and removed from the response and completion denominators.
Compensation
One set of initial contact messages for each of the 3 survey versions made clear that no compensation would be provided. The second set of initial contact messages, designed to test the impact of compensation on the RPPS-short survey, made clear that compensation would be provided. Interested registry members were randomized to receive offers of either a $10 or a $20 incentive in the email link. The survey fielding procedures were otherwise the same for the uncompensated and compensated surveys. Compensation was provided as an electronic (Amazon) gift card emailed after survey completion.
Response Rates
The registry does not return information on eligibility or idle accounts. We considered the initial registry contact message as a preparatory step to identify an eligible target population and not part of the survey response/nonresponse calculation.
The Survey Response rate for each version was calculated using the set of registry members who granted permission to be sent information about a research participation experience survey and were sent an email with a personalized survey link. According to Hospital Consumer Assessment of Healthcare Providers and Systems quality standards [5], respondents whose surveys were undeliverable (a priori had generically blocked the survey site) or who self-identified as ineligible in the qualification question, were removed from the analyses:
 $${\rm Reponse }\,{\rm Rate\,{\equals}\,}{{{\rm (}\left( {{\rm \,\#\,survey}\,{\rm links}\,{\rm opened}} \right){\rm {\minus}}\left( {{\rm \,\#\, ineligible}} \right){\rm )}} \over {{\rm [}\left( {{\rm \,\#\, sent}\,{\rm a}\,{\rm survey}\,{\rm link}} \right){\rm {\minus}}\left( {\left( {{\rm \,\#\, undeliverable}} \right){\rm {\plus}}\left( {{\rm \,\#\, ineligible}} \right)} \right){\rm ]}}}.$$
Survey Completion Rate
In order to give respondents the opportunity to revise their responses, the responses to research participation questions were captured once the respondent clicked “submit.” If respondents did not click “submit” the survey was considered incomplete and un-submitted responses did not register. Appropriate opt-out response options such as “Not applicable” were included to encourage completion of all items. Surveys were considered complete if the respondent submitted answers to all the questions. Survey Completion Rates were calculated for the number of surveys completed, divided by the same denominator used in Survey Response Rates.
Retest survey completion rate was calculated as the number of Retest surveys completed, divided by the number of Retest surveys started by an individual who had completed the matching version of the prior test survey.
Test/Retest
Respondents who completed one of the survey versions were sent a second unique link to the same survey version for retest validation. Retest surveys were sent within 2–4 weeks of the test surveys. We compared the intrarater reliability of the individual’s test and retest responses for each question, and compared the aggregate retest reliability for the collection of core questions in common across all of the survey versions. We also compared the retest reliability of the additional questions unique to each survey version to identify questions with high and low retest reliability.
As a high level screen of the overall retest reliability, we estimated the proportion of responses in the top box response (optimal response to an actionable question) for each item, in the test, and retest response set, then applied a correlation coefficient to assess the retest reliability of the questions in each survey. This represents the correlation of the aggregate results.
Statistical Analysis
The Cronbach α coefficient [Reference Cronbach9] and the intraclass correlation coefficient (ICC) were used to measure internal consistency in actionable items and test-retest reliability in overall ratings, respectively [Reference Zou10, Reference Bonnet and Wright11]. Internal consistency was considered acceptable whenever the lower bound of Cronbach α 95% confidence interval estimate was higher than 0.7 [Reference Nunnally and Bernstein12]. The benchmark value considered to reflect substantial agreement for the ICC lies in the interval 0.61–0.8 [Reference Landis and Koch13, Reference Spearman14]. In addition to ICC, the κ “beyond chance” correlation coefficient measured the association between proportions in top box (best answer) responses in test and retest samples [Reference McHugh15] (Cohen’s κ significance ranges are: 0.81–1.0=near total agreement; 0.61–0.8=significant agreement; 0.41–0.60=moderate agreement; 0.21–0.4=fair agreement; 0–0.2=little agreement. More stringent scoring has been proposed, requiring κ of 0.81–0.9 to assert significant retest or interrater agreement [Reference Landis and Koch13]). Comparisons across different surveys were carried out with χ2 and Fisher exact test for categorical outcomes and ANOVA for quantitative ones.
To calculate the needed sample size, we modeled different scenarios using expected Cronbach α of 0.7, 0.75, or 0.8, and for the different length surveys. Sample sizes were calculated, and upper and lower bounds evaluated aiming to select a sample size that would guarantee with 95% confidence that the maximum margin of error in Cronbach α estimation would be 5% irrespective of the number of actionable items in the survey (recognizing that a higher reliability is associated with a higher number of items). The prior reliability testing of the RPPS-L [Reference Yessis2] supported the selection of an expected Cronbach α of at least 0.75 and a sample size of 280.
Survey completion rates were calculated for each version and then tested for differences between proportions with a χ2 test statistic. Item completion rates were not calculated.
Compensated surveys: for the surveys offered with compensation (RPPS-SC), an additional measure was a test of significance of the magnitude of compensation. Analysis of the outcomes was otherwise the same for surveys offered with or without compensation.
Results
Response and Completion Rates
Registry Contact Rate
In total, from January 2015 to March 2015 invitations were sent to 41,789 randomly selected registry volunteers, seeking interested individuals with prior research experience for an uncompensated (n=38,036) or compensated (n=3693) research experience survey. A detailed accounting of messaging and response samples across all surveys is provided (online Supplementary Table S1). The proportion of registry volunteers who responded to the initial random email contact invitations was similar for uncompensated (10%) and compensated surveys (11%). Among contact respondents, the proportion expressing interest in learning more about potential participation was slightly higher for messages indicating a compensated survey (78%) than for those offering no compensation (73%).
Survey Response Rate
In total 2228 individuals were randomized to receive an email with a link to one of the versions of the survey. Despite initial self-referral as eligible, 339 (15%) individuals who attempted to start the survey were identified as ineligible on the explicit qualification question. Among the uncompensated surveys, the survey response rates were similar for the 2 shorter surveys RPPS-U (65%) and RPPS-S (64%), and lower for the longer RPPS-L survey (51%) (p<0.001). The compensated RPPS-SC1 and RPPS-SC2 surveys yielded survey response rates (77%, 73%, respectively) that were higher than for any of the uncompensated survey (p<0.001) (Table 1).
Table 1 Survey response and completion rates

Disposition is shown for individuals sent an email survey link to uncompensated Research Participant Perception Survey (RPPS)-Ultrashort (RPPS-U), RPPS-Short (RPPS-S), and RPPS-Long (RPPS-L) surveys, and to compensated RPPS-SC1 ($10) and RPPS-SC2 ($20) surveys. Known undeliverable or ineligible surveys are removed from response and completion rates calculations; otherwise nonrespondents are assumed to be eligible. Data are shown for participants who completed an uncompensated RPPS-U, -S, or -L survey and were sent links to a retest survey of the same version.
* Response rate for shorter surveys RPPS-U and RPPS-S were significantly higher than for the longer RPPS-L survey (p<0.001).
† Response rate for RPPS-S surveys with any compensation were significantly higher than for uncompensated RPPS-S surveys (p<0.001).
‡ The shorter the survey, the higher the completion rate (p<0.001).
§ The addition of any compensation further increase the completion rate (p<0.001).
Survey Completion Rates
Overall, shorter surveys were more likely to be completed. Completion rates for uncompensated surveys RPPS-U, RPPS-S, and RPPS-L were 63%, 54%, and 37%, respectively (p<0.001). Completion rates for the $10 and $20 compensated RPPS-S survey were higher (74% and 69%, respectively) than for uncompensated surveys (p<0.001) (Table 1).
Retest Survey Completion
Retest surveys were completed by 94%, 93%, and 87% of RPPS-U, RPPS-S, and RPPS-L eligible recipients, respectively, who had returned the initial test survey and started a retest survey.
Survey Duration
The median times to complete the survey were 2, 7, and 10 minutes for the RPPS-U, RPPS-S, and RPPS-L, respectively. Completion times for the RPPS-S with or without compensation were similar.
Test and Retest Reliability, Sample Characteristics, Compensation
Reliability
All survey versions were reliable (Cronbach α>0.71) when fielded without compensation. Reliability for the 6 key actionable questions increased with survey length for RPPS-U, RPPS-S, and RPPS-L (Cronbach α=0.81, 0.84, 0.87, respectively) (Table 2). The addition of $10 or $20 compensation for survey completion slightly reduced survey reliability [Cronbach α=0.78 (0.72–0.84)], still remaining within the lower cut-off for reliability. When reliability analyses included all of the actionable questions in each of the uncompensated surveys, the ranking of reliability across surveys remained acceptable, with reliability considerably higher in the longest survey version (Cronbach α=0.95) (online Supplementary Table S2).
Table 2 Test reliability: Cronbach α, standard error, and the number of evaluable surveys (valid sample) are shown for the 6 key actionable questions in common across survey versions

RPPS-U, Research Participant Perception Survey-Ultrashort; RPPS-S, Research Participant Perception Survey-Short; RPPS-L, Research Participant Perception Survey-Long.
Cronbach α>0.71 is considered to reflect reliability [Reference Kost1, Reference Yessis2].
Test/Retest Reliability
The retest reliability for the overall rating question showed good agreement for the RPPS-U and RPPS-S versions, ICC=0.81 and 0.81, respectively, and moderate agreement for the RPPS-L version, ICC=0.73. The Cohen’s κ coefficient for intrarater reliability showed significant retest agreement for RPPS-U, RPPS-S, and RPPS-L (Cohen’s κ=0.84, 0.85, 0.81, respectively) by typical scoring algorithms [Reference Landis and Koch13, Reference McHugh15] as well as more robust rating standards [Reference Landis and Koch13, Reference McHugh15] (Table 3).
Table 3 Retest reliability
RPPS-U, Research Participant Perception Survey-Ultrashort; RPPS-S, Research Participant Perception Survey-Short; RPPS-L, Research Participant Perception Survey-Long. Retest reliability measured by the intraclass correlation coefficient (ICC) for absolute agreement (reference range, 0.61–0.8) and κ coefficient [Reference Nunnally and Bernstein12, Reference Landis and Koch13, Reference McHugh15]. Significant agreement is variously defined as reflected by κ coefficients of 0.61–0.8, or more stringently by McHugh, for coefficients from 0.81 to 0.90 [Reference McHugh15].
We also evaluated the retest reliability of each of the questions in the RPPS-S and RPPS-L that did not also appear across all surveys to assess the value of individual questions that might be used to customize future surveys. One question that asked whether participants felt like valued partners in the research process, demonstrated a κ of 0.71, in the range of substantial agreement in retest reliability. Many additional questions in the RPPS-L had moderate agreement κ coefficients but broad bounds that reduce their reliability (online Supplementary Table S3).
Response Sample Characteristics
The sampling strategy preserved geographical representativeness of the parent registry as indicated by the Pearson correlation coefficient between frequencies of each state of origin in the sample of the respondents and the research match cohort overall (r=0.98).
Across the uncompensated surveys, the age, race, gender, and educational background of the respondent samples were similar. Survey respondents overall were slightly more likely to be White (p<0.001) and female (p=0.003) compared with the entire volunteer registry (Table 4).
Table 4 Demographic data were collected from respondents to uncompensated [Research Participant Perception Survey-Ultrashort (RPPS-U), RPPS-Short (RPPS-S), and RPPS-Long (RPPS-L)] and compensated (RPPS-SC1, RPS-SC2 combined) surveys fielded to a national registry
Compensated respondents were younger (p<0.001) and more often persons of color (p=0.03) than were uncompensated respondents.
* Registry privacy policies did not permit retention of the demographic data for individuals who did not consent to the survey. The contemporaneous demographics of the registry overall are shown in place of nonresponder demographics. Registry enrollment grew from approximately 69,000 to 75,000 during the fielding of the survey.
† Application of a Binomial test showed that the proportion of females in the surveys 750/996 is significantly higher than the proportion in the National Registry (71%), p-value=0.003.
‡ More persons of color responded to compensated surveys, than to uncompensated surveys (p=0.03).
§ Application of the Binomial test has showed that the proportion of Whites in the uncompensated surveys (691/794) is significantly higher when compared to the National Registry (78.2%), p-value<0.001.
‖ More respondents came from the 18–35-year-old age group for compensated surveys than for uncompensated surveys (p<0.001).
Compensation
When surveys were offered with compensation, significantly more respondents came from the 18–35-year-old age group (p<0.001), and there was greater representation of persons of color (p=0.03) than in uncompensated surveys (Table 4). To verify the significance of the association for race, we performed a χ2 test of independence after combining data for the 2 compensated surveys (RPPS-SC1, RPPS-SC2) into a single group, and collapsing categories for races into 2 groups, White and persons of color. Post hoc pairwise comparisons were applied with p-value adjustment by Bonferroni-type correction for multiple tests.
The compensated and uncompensated RPPS-S samples were similar in the proportion of respondents that had qualified for a prior study by having with a disease or disorder, or had undergone an intervention for their study, and were similar in the intensity/demands of the studies in which they had previously participated. These characteristics were inferred from their responses to previously validated questions designed to assess these characteristics [Reference Yessis2] that were included in the RPPS-S (Table 5).
Table 5 Characteristic of the samples responding to uncompensated Research Participant Perception Survey-short (RPPS-S) and compensated (RPPS-SC1, RPPS-SC2) surveys, were compared based on response frequencies to 2 previously validated questions about prior study participation
* Descriptions are provided for the levels of study intensity within the response options for the questions survey. Full surveys are provided in the online Supplementary Appendix S1.
Respondents across the surveys did not differ significantly in their responses to the overall rating and actionable key questions in common across the versions (Fig. 1).
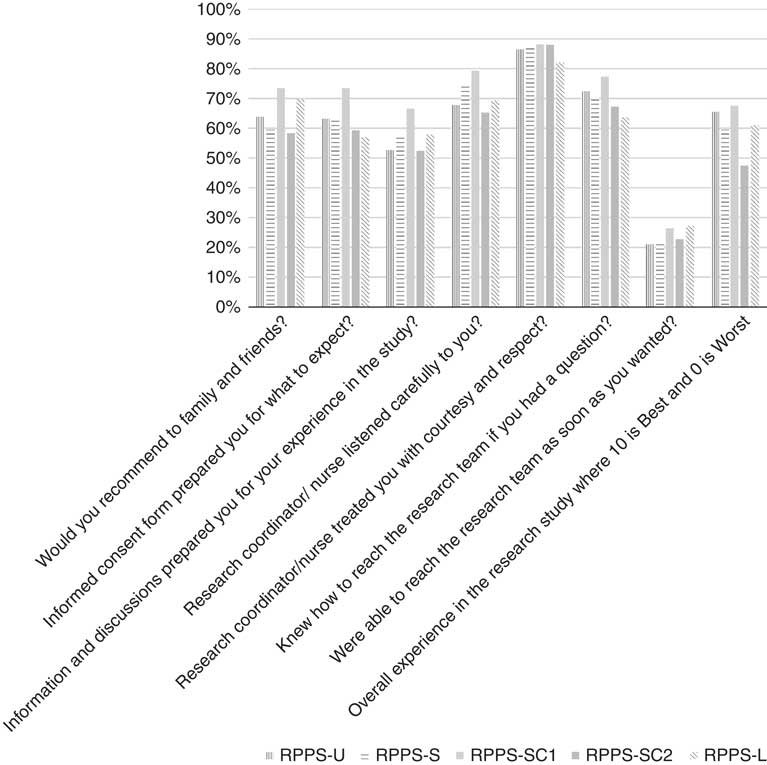
Fig. 1 Participant experience outcomes: frequencies of top box responses to overall rating, would recommend, and 6 key questions, in common across the Research Participant Perception Survey (RPPS)-Ultrashort (RPPS-U), RPPS-Short (RPPS-S), and RPPS-Long (RPPS-L) survey versions are shown. Full question text is provided in the online Supplementary Appendix S1.
Discussion
Participant-centered and participant-generated information about the quality of the research experience may provide important data that can be used to improve participants’ research experiences, assess the quality of the informed consent process, and overcome barriers to recruitment of participants to clinical studies. The original validated RPPS-L provided extremely valuable information, but it had a major limitation in that its response rate was only 29%, comparable to that of hospital surveys [Reference Kost4], but perhaps not sufficiently representative of the participant population. We hypothesized that the major reason for our less-than-desired response rate was the length of the survey. Since we were able to identify 6 key questions in the RPPS-L survey that predict the overall rating score with high accuracy [5] we were able to rebuild the RPPS around these questions into a very short and an intermediate length survey. As healthcare institutions, researchers, patients, and volunteers increasingly communicate electronically, and electronic health records are increasingly a common platform for research integration, we also sought to validate the RPPS in an electronic mode anticipating its potential for fielding via patient portals.
Complaints about lack of compensation were among the early negative responses to the contact message. The impact of incentives on survey validity and outcomes remains a subject of focused research because there is a lack of consensus [Reference Barge and Gehlbach6, Reference Toepoel7]. Therefore we took the opportunity afforded by developing our new surveys to also test the impact of compensation on the reliability of RPPS survey performance and response rates.
All 3 versions of the survey proved to be valid and reliable instruments in this test platform. The shortest survey elicited the highest response and completion rates, yet the intermediate length RPPS-S had good response and completion rates, and the highest retest reliability. Survey adopters must weigh these competing priorities when optimizing for participant feedback. The similarity of the demographics and response outcomes of the respondent samples across all 3 uncompensated survey versions speaks to the interchangeable value of the versions. This outcome provides flexibility for survey adopters seeking shorter or longer surveys.
Compensation increased response and completion rates, however, it slightly lowered reliability signaling the need for caution when comparing results from compensated and uncompensated surveys. It may be necessary to reassess psychometric reliability or invoke scoring adjustments when different survey modes are employed in parallel or compared, and when compensation is a variable.
Compensation attracted a population that was significantly younger and included greater representation of persons of color than the uncompensated respondents who were majority white females. Minority populations and individuals from lower socioeconomic tiers are among the groups that suffer greater health disparities and express more distrust of the research enterprise. The finding that compensation increased the number of responses from this group, while preserving other characteristics of the uncompensated response sample suggests that the slightly lower reliability associated with compensation may be more than offset by the increase in participation by minority populations. Further study will be required to understand the trade-offs associated with compensation, both in nonregistry populations and in populations with higher minority prevalence and less formal education. It is not well understood why compensation differentially increases participation (other than obvious financial motives): compensation may serve as a proxy for trust or a quid pro quo in partially overcoming mistrust of researchers among minority populations. Additional qualitative research and psychometric testing of the instruments among persons of color may also be informative. Engagement with target populations to identify and test culturally relevant incentives (aside from gifts or cash) could identify additional drivers of survey and research participation.
Our study has several limitations. The survey was fielded only in English, as the Registry only supported English language enrollment at the time of the surveys. All of the survey questions are, in fact, available in Broadcast Spanish and were fielded in the original validation cohort [Reference Yessis2]. The initial registry contact message was sent to a large pool of uncharacterized registry enrollees. To focus our analysis on the subset of registry members whose contact we could confirm, we defined our survey response rate denominator using the registry volunteers who responded to the initial contact message and provided eligibility information. This approach likely enriched the starting sample of people who were sent the survey links and may have introduced a positive response bias overall; we have therefore minimized interpretation of the response outcomes, for example overall rating scores, and specific actionable questions. However, as the primary objective of the study was to assess instrument validity and reliability, and any limitations were distributed across all survey versions, we do not believe that these limitations materially affected the reliability and validity data. Additional details regarding the data set are provided in the online Supplementary Material (Table S1).
To streamline adoption of participant experience surveys, enable benchmarking and the development, validation, and dissemination of new survey questions we have made the following materials available; the 3 surveys, the broadcast Spanish version of the RPPS-L containing all the questions, are available free of charge to the research community (online Supplementary Appendix S1). Implementation in the on-line mode omits the costs of 2-wave mailing, and participant burden is low, requiring a median 2–10 minutes to complete depending on the version. This suite of ultrashort, short, or long valid questionnaires enables institutions to assess participant-centered outcomes at whatever depth of inquiry is desired, through electronic platforms like email, a patient portal, handheld devices, or social media. Recently, researchers tested a customized version of the RPPS-U fielded directly to research participants through the electronic health record patient portal, reporting response rates meeting or exceeding traditional survey modes, at significantly lower cost [Reference Kelly-Pumarol16]. A very brief survey of the participant experience data may offer a quick scorecard assessment of participant ratings, explore differential performance across research units, test different approaches to informed consent, or reach as yet unconnected populations. The longer surveys afford a deeper dive into participant motivations, and reveal performance drivers that can be utilized to improve the experience and accelerate the conduct of research.
Supplementary Material
To view supplementary material for this article, please visit https://doi.org/10.1017/cts.2018.18
Acknowledgments
The authors would like to acknowledge assistance from Lauren Corregano Demato, M.S. for assistance with survey fielding and data management and Barry S. Coller, M.D. for wisdom and perspective. This work is supported by the National Center for Advancing Translational Sciences (NCATS), National Institutes of Health, through grant award numbers and UL1TR001866 (R.G.K. and J.C.d.R.).
Authors’ Contribution
R.G.K. wrote manuscript, designed research, performed research, analyzed data; J.C.d.R. designed research, analyzed data.
Disclosures
The authors have no conflicts of interest to declare.


 Open access