


In its 2013–2020 action plan for the prevention and control of non-communicable diseases, the WHO highlighted the importance of an environment that fosters healthy diets with reduced levels of sugars, sodium, and saturated- and trans-fatty acids( 1 ). The shift from energy-dense to nutrient-dense diets would present a significant advance in lowering the risk of obesity and related diseases( Reference Troesch, Biesalski and Bos 2 ). Although this is clear at the scientific level, the perpetual question for the international community as well as for national governments and health policy makers is how to achieve dietary improvements at the population level. The concerned governing and advising bodies (national and international), such as Ministries of Health, Consumer protection, or Food safety and Food regulation authorities, have endeavoured to change consumer behaviour from all angles, through the use of education campaigns, community-based interventions, fiscal measures and social media( Reference Brambila-Macias, Shankar and Capacci 3 – Reference Peirson, Fitzpatrick-Lewis and Morrison 5 ). Most of these strategies require significant resources to implement and have shown limited evidence of success so far( 4 , Reference Peirson, Fitzpatrick-Lewis and Morrison 5 ).
Another angle of approach is to act directly on the food supply to provide consumers with a wider access to and a larger number of more healthful products. A recent analysis across multiple interventions addressing obesity indicated that interventions with the highest impact were those that restructure the food and beverage environment and are subconscious in nature, i.e. they do not require consumers to change their behaviour( Reference Dobbs, Sawers and Thompson 6 ). Among these, reformulation of food products was identified as one of the most effective, measured in disability-adjusted life years saved( Reference Dobbs, Sawers and Thompson 6 ). There is a growing body of evidence that industry-wide reformulation interventions could be an effective means for reducing the intake of sugars, sodium and SFA( 7 – 10 ). Policies to stimulate reformulation and improve the food supply have been implemented by several governments and through public-private partnerships( 11 ).
A key pre-requisite for improving the food supply lies in the analysis and classification of different foods in order to evaluate (and improve upon) their nutrient profiles. To this end, many different nutrient profiling (NP) systems have been developed( Reference Labonte, Rayner and L'Abbe 12 ). The WHO defines NP as ‘the science of classifying or ranking foods according to their nutritional composition for reasons related to preventing disease and promoting health’( 13 ). It is acknowledged that NP as a tool can be used to improve the overall nutritional quality of diets( 14 ). This review will discuss the role of NP systems in the reformulation of food products as a means for improving diet and population health using the example of the Nestlé nutritional profiling system (NNPS), a system globally used to guide innovation and reformulation of food and beverage products. The review will also discuss the potential public health impact of product reformulation.
Nutrient profiling
In the broadest sense, the goal of NP is to evaluate foods based on their nutrient content( Reference Sacks, Rayner and Stockley 15 ). NP systems use a certain number of inputs (e.g. amounts of specific nutrients and/or energy in the food) to generate scores or rankings that reflect the degree of ‘healthfulness’ of a particular food product( Reference Scarborough, Rayner and Stockley 16 ). More than 100 NP systems have been developed for different purposes( Reference Labonte, Rayner and L'Abbe 12 ). The WHO Europe NP model, the UK Food Standards Agency colour-coded nutrients (‘traffic lights’) model and the Australian/New Zealand NP Scoring Criterion are examples of systems that have been developed to restrict marketing to children, to inform consumers or to identify products eligible for health claims( 14 , 17 , 18 ). Other NP systems are relevant for the regulation of pricing, for example in categorizing foods for taxation (or subsidy)( Reference Sacks, Rayner and Stockley 15 ). Furthermore, there are systems driven by government initiatives to encourage the reformulation of food products to meet specific goals; for example, the voluntary reformulation of food products to reduce salt consumption in order to meet national regulatory guidelines( 11 ).
NP models should be developed using a systematic approach( 13 , Reference Sacks, Rayner and Stockley 15 , Reference Scarborough, Rayner and Stockley 16 , 19 ). This systematic approach means taking multiple decisions when designing a NP model, i.e. whether the model will use specific food categories or will evaluate foods across-the-board, the choice of nutrients to encourage v. nutrients to limit, the choice of a threshold or score as outcome measure, the daily nutrient reference values used and the reference amount for calculation: per 100 g, 418·4 kJ (100 kcal), or actual serving size( Reference Scarborough, Rayner and Stockley 16 , 19 , Reference Drewnowski and Fulgoni 20 ). These decisions should be made in order to tailor the NP system to fit the specific purpose it should serve. Ideally, all NP systems should be validated against an accepted independent measure of diet quality( Reference Drewnowski 21 , Reference Fulgoni, Keast and Drewnowski 22 ). The following sections outline the specific considerations for the design of a NP system for reformulation.
The elements of a nutrition profiling system to drive product reformulation
Despite the numerous NP systems used in the food industry( 23 ), only two examples exist in the peer-reviewed literature that have been specifically developed for product reformulation( Reference Vlassopoulos, Masset and Rheiner Charles 24 , Reference Vlassopoulos, Masset and Leroy 25 ). Both systems are built on the same approach (i.e. category- and threshold-based, mostly using nutrients to limit) but differ in the food classification (scope of categories), reference amounts, nutrient thresholds used and the target consumer.
The following sections describe the principles of a NP system designed for reformulation using the example of the NNPS (Fig. 1). More details about the system and how it has been applied to drive the reformulation and renovation of an extensive product portfolio are described elsewhere( Reference Vlassopoulos, Masset and Rheiner Charles 24 ).
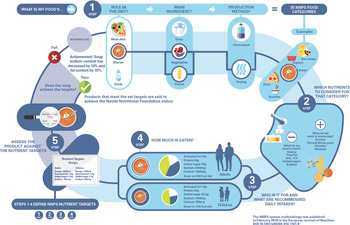
Fig. 1. Application of the Nestlé Nutritional Profiling System (NNPS) towards the reformulation of different food products. The figure represents the different steps needed to define category-specific nutrient targets in the NNPS system. More information can be found at http://www.nestle.com/asset-library/documents/r_and_d/nestle-nutritional-profiling-system-infographic.pdf.
Food categories v. across-the-board
In general, NP systems use two main methods for ranking food items( Reference Scarborough, Rayner and Stockley 16 ). The first ranks separate food items within a particular food category (category-specific). In these models, the appropriate definitions of healthful (or unhealthful) are applied within each food category (Fig. 2). The second method ranks all foods across-the-board. Here, a universal definition of healthy (or unhealthy) is applied across all food categories. In the latter case NP systems try to identify products that are recommended to be more frequently consumed (i.e. those at the base of food pyramids) and set targets that are likely to exclude products that are recommended to be eaten less frequently (i.e. items at the top of the food pyramid) (Fig. 2). For the specific purpose of food and beverage reformulation, a NP system should be able to identify in each food category the most nutritious options rather than the exclusion of entire food categories. As a result, a category-specific approach is preferred since a single set of nutrient profiles, such as those underlying across-the-board models, may not account for the many kinds of products that presently form part of a varied diet( 19 ). To date, no agreement exists on the optimal number of categories to be used for reformulation purposes but existing systems range from 10 to 158 categories( Reference Vlassopoulos, Masset and Rheiner Charles 24 , 26 – 28 ).

Fig. 2. Translating dietary guidelines to nutrient profiling (NP) systems: across-the-board (left) v. category-specific (right) systems. Green: products that meet the targets; red: products that do not meet the targets. Pyramid adapted from Schweizerische Gesellschaft für Ernährung (Swiss Nutrition Society)( 67 ). In an across-the-board NP system, foods from most recommended food categories usually pass the systems’ targets, whereas most foods from not-recommended categories do not pass. In a category-specific system, there are foods passing the targets in all categories.
A preliminary analysis of the NNPS against the UK Food Standards Agency Ofcom NP system indicated that the NNPS as a category-specific system was more appropriate to equally identify products for reformulation across four food categories compared with an across-the-board system that only seemed to stimulate product improvements in two of the four categories( Reference Masset, Vlassopoulos and Potter 29 ). A recent analysis confirmed this work showing that the NNPS was indeed able to differentiate between healthier and less healthy in more categories than the Office of Communications and the Système d' Etiquetage Nutritionnels Simplifié (A Vlassopoulos, M Gressier and G Masset, unpublished results).
Which nutrients to include in a nutrient profiling system?
The NNPS, as with other multi-nutrient systems, gives priority to nutrients to limit i.e. SFA, trans-fatty acids, total fat, sodium and sugars as well as energy, in line with the recommendations of the WHO and the World Health Assembly( 30 ). Although a number of NP systems only focus on nutrients to limit, the NNPS also accounts for nutrients to encourage (such as fibre, calcium and protein)( Reference Vlassopoulos, Masset and Rheiner Charles 24 ). The inclusion of specific nutrients to encourage is used in cases where the nutrients support the role of the product in the overall diet (for example, protein and calcium in dairy products, and fibre in cereal products). The simultaneous profiling of nutrients to limit and nutrients to encourage has been criticised, as this procedure could enable products to achieve better nutrient profiles simply by increasing the amounts of nutrients to encourage without significant changes in nutrients to limit( Reference Buttriss 31 ). To bypass this limitation, the NNPS uses a non-compensatory approach in its targets for both nutrients to limit and encourage, i.e. all nutrient criteria need to be met to obtain a pass status. This ensures that the NNPS ranking provides an accurate depiction of the nutritional value of a product and does not simply reflect an increase in nutrients to encourage, for example, through micronutrient fortification( Reference Vlassopoulos, Masset and Rheiner Charles 24 ).
Threshold v. scoring and level of strictness
NP systems translate global reference values such as those defined by the WHO for a global diet into food-specific target values. A threshold is defined as the value for each nutrient or component that must not be exceeded (the upper limit, in the case of nutrients to limit) or that must be achieved (the lower limit, for nutrients to encourage). A score is the outcome of a calculation that has used either a sum, a mean- or a ratio-based method. Score-based systems can be the outcome of a combination of thresholds (e.g. the UK Food Standards Agency Ofcom or the Oceanian Health Stars models)( 18 , Reference Rayner, Scarborough and Lobstein 32 ), or the outcome of an algorithm. While both threshold and score systems have strengths and weaknesses( Reference Tetens, Oberdörfer and Madsen 33 ), a threshold system is better adapted to guiding food developers in their reformulation efforts( 13 , Reference Tetens, Oberdörfer and Madsen 33 ). Accordingly, the NNPS is a non-compensatory threshold system, i.e. specific targets are set for each nutritional factor, and all targets need to be reached to obtain an overall pass status. The reference values for the thresholds are regularly adjusted based on the latest guidance from e.g. the European Food Safety Authority, the Institute of Medicine, or the WHO recommended daily values and also take into account technical and sensory feasibility( Reference Vlassopoulos, Masset and Rheiner Charles 24 ). Where possible, the NNPS uses local research-based daily values in order to tailor food products according to local dietary needs( Reference Vlassopoulos, Masset and Rheiner Charles 24 ). Another important feature of the NNPS is that threshold values for both adults and children are used, further enhancing its utility for product reformulation targeted towards specific populations.
For NP systems that should stimulate reformulation, it is important that nutrient thresholds be kept meaningful and realistic for food developers and nutritionists, so that these targets can stimulate (re)formulation and be achieved over time. Thresholds that are overly stringent may not stimulate reformulation. As an example, in 2007, the Dutch Choices sodium target for processed vegetables was set at 120 mg/100 g, despite the fact that the average sodium content was 250 mg/100 g for that food category( 34 ). During this time, very few products (up to about thirty) complied with the Dutch Choices criteria. As a result, the Dutch Choices programme decided in 2010 to increase this sodium threshold to 200 mg/100 g, to provide a stronger incentive for reformulation. This effectively led to a larger number of food products achieving this target (about 110 in 2015–2016): not only was this realistically feasible with reformulation, it also stimulated an overall improvement in the category( 34 ). Conversely, thresholds that are less challenging or too lenient would not stimulate reformulation if all products can comply. The recently published draft Food and Drug Administration voluntary sodium targets are an example of setting realistic and achievable targets by taking into account the existing food thresholds as a basis to define reformulation targets( 28 ).
When the NNPS was used to evaluate food composition datasets from five countries, 38 % of the food supply complied with the NNPS thresholds (E Combet, A Vlassopoulos, F Mölenberg et al., unpublished results), suggesting that the NNPS can set realistic yet challenging reformulation targets.
Reference amounts
The most frequently used reference base for NP systems is per 100 g, because it is simple and has already been widely implemented in food legislation. Yet, a study compared the performance of nutrient profiles that were based on 100 g, 418·4 kJ (100 kcal) or serving sizes (defined by the Food and Drug Administration as reference amounts customarily consumed (RACC))( Reference Drewnowski, Maillot and Darmon 35 ). The results of this study indicated that models based on serving size were easier for the consumer to use, provided a more consistent ranking for different categories of foods, and were more stringent at ranking items that contained added sugar, such as sweetened beverages( Reference Drewnowski, Maillot and Darmon 35 ). A further disadvantage of the 100 g approach is that it does not account for the different types of foods, or how they are consumed( Reference Drewnowski and Fulgoni 20 ). For example some items are eaten in very small amounts (such as salad dressing) and may appear high in salt when the value is expressed per 100 g.
To overcome these limitations, the NNPS uses serving size as a reference base to evaluate most accurately the impact of the product in the diet. For example, the Food and Drug Administration recently updated their RACC to reflect changes in the eating habits of Americans. The new RACC saw a large increase in the RACC of beverages and ice creams, while the RACC for yoghurts was reduced to reflect an industry-wide reduction in the size of single-serve yoghurts; in total nineteen food categories were affected. A preliminary analysis of the impact of such changes on the performance of the NNPS showed that when the RACC were increased, the products in these categories would require larger reductions in sodium and sugar (absolute content and relative reductions) and a larger proportion of products would have to be reformulated. The present work was conducted using 500 products listed as being consumed by Americans in the National Health and Nutrition Examination Survey that fell under the categories with RACC updates. More specifically, the application of the NNPS would stimulate an additional 8 g/serving reduction in sugar for beverages and 10 g/serving for bagels and pastries. For ice creams the reformulation efforts would have to be doubled. Conversely, yoghurts and chocolate are now consumed in smaller servings and would require less reformulation for reducing sugar (approximately 50 % less sugar reduction). Similar results were seen for sodium in bagels, with the NNPS stimulating 4-fold larger reductions following a doubling of the RACC, while the reformulation intensity of appetizers and mixed mini dishes was halved following a 30 % reduction in the RACC (L Privet, F Vieux and G Masset, unpublished results). Altogether, these findings indicate that setting reformulation targets per serving is a relevant public health approach as it allows food manufacturers to simultaneously address issues in the nutrient composition of foods as well as their consumption pattern and changes thereof.
Standard reference serving sizes could provide a suitable solution to overcome the lack of uniform serving sizes and a recent publication suggested the feasibility of this approach for Europe, while it is already being implemented in countries such as the USA( Reference Kirwan, Walsh and Brennan 36 ).
Validation
Validation ensures that the NP model is based on sound scientific principles, is relevant for the intended purpose and that interventions using the NP model are evidence-based( 13 , Reference Drewnowski and Fulgoni 20 ). Only limited research has been conducted on how to best validate a NP model. Recent studies have linked nutrient profiles to global measures of diet quality and demonstrated the health impact using dietary surveys, as discussed in the following sections( Reference Fulgoni, Keast and Drewnowski 22 , Reference Darmon, Vieux and Maillot 37 ). A recent review concluded that further work is needed to develop more robust NP systems meeting specific validity standards( Reference Cooper, Pelly and Lowe 38 ).
Public health impact of product reformulation
Product reformulation guided by the application of a NP system should (1) improve the nutritional quality of a product, and as a result have (2) an impact on population dietary intakes that could lead to (3) a positive public health effect. These three potential effects of NP-driven reformulation are described hereafter and summarised in Table 1, which provides an overview of observed and modelled diet and health outcomes. Several studies report on modified product composition and the resulting impact on dietary intakes (either observed or modelled). A growing number of studies have also modelled the resulting health effects of a modified product composition (Table 1).
Table 1. Impact of reformulation on products, diet and health with a focus on interventions and models driven by the use of a nutrient profiling (NP) system

A recent overview by the World Cancer Research Fund International lists local reformulation initiatives with the aim of reduction in public health-sensitive nutrients in food and beverage products, driven both through voluntary agreements between the public and private sector and through mandatory removal of trans-fats and reductions in sodium( 11 ). One of these, the UK Responsibility Deal, resulted in a 7 % sodium reduction in food products over 5 years. The Consumer Goods Forum recently reported that in 2015, its members had reformulated 84 000 products resulting in improved nutritional profiles( 39 ). Similarly, a NP-driven 5-year voluntary reformulation strategy was recently reported to have led to a reduction in sodium and added sugars across eight food and beverage categories in the USA and France( Reference Vlassopoulos, Masset and Rheiner Charles 24 ).
Alongside reformulation is the need to assess whether the observed (or modelled) reductions in sodium, saturated fats and sugars have an impact on the dietary intakes of the general population. So far, this has been addressed either through observational data or modelling studies based on dietary intake surveys. Several Dutch studies have modelled the potential dietary impact if all food products were compliant with the International Choices front-of-pack logo program( Reference Roodenburg, Popkin and Seidell 40 , Reference Vyth, Steenhuis and Roodenburg 41 ). It was demonstrated that consumption of Choices-compliant foods could have a substantial impact on the nutrient intake of a population( Reference Roodenburg, Temme and Davies 42 , Reference Roodenburg, van Ballegooijen and Dötsch-Klerk 43 ). Due to the multi-nutrient thresholds in the Choices system, not only a significant reduction in nutrients to limit but also an increase in nutrients to encourage were observed( Reference Roodenburg, van Ballegooijen and Dötsch-Klerk 43 ). A similar study modelled the potential effects of two pizza reformulation strategies based on the standards established by the NNPS. The study concluded that both reformulation and substitution towards NNPS-compliant criteria could result in a lower intake of nutrients to limit, including energy, saturated fat and sodium, among US children and adolescents( Reference Masset, Mathias and Vlassopoulos 44 ). Taken together, the findings from these modelling studies (Table 1) suggest that industry-wide reformulation, even of a single but frequently-consumed food category, may have a positive impact on the general population's dietary intakes.
Going one step further, relatively few studies have evaluated the potential health impact of product reformulation (Table 1). A recent analysis using reformulation scenarios and a health model showed that the total impact of reformulation resulted in 2408–3597 avoided deaths per year in France, equivalent to a 3·7–5·5 % reduction in mortality linked to diet-related chronic diseases (including CHD, stroke and some cancers)( Reference Leroy, Requillart and Soler 45 ). This study is part of a growing body of evidence suggesting that reformulation of food items may be effective in improving population nutritional intakes and thereby its health status. However, in order to achieve the full potential of positive health effects resulting from an improved food environment, the entire food industry would have to be engaged. This calls for involvement at a global scale, also requiring the intervention of governments or public health authorities, for example through public–private partnerships( Reference Frieden 8 , 11 , Reference Leroy, Requillart and Soler 45 ).
How can consumers be reached through reformulation
Although reformulated food products may have improved nutrient profiles, taste and sensory perceptions are important factors that influence consumer uptake and adherence. With the increasing wealth particularly in emerging economies, consumers are demanding and are getting accustomed to an ever-expanding array of food choices. It is unlikely that consumers (particularly those with less education and of lower socio-economic status) will sacrifice taste, texture, convenience and cost at the expense of health( Reference German 46 ). Indeed, data from the 2012 Food and Health Survey indicated that taste is still the number one deciding factor when it comes to purchasing food( 47 ).
Ultimately, the final test of a successful product reformulation is whether or not the reformulated foods are actually purchased and consumed( Reference Trichterborn, Drossard and Kersting 48 ). This underscores the importance of designing NP systems specifically for food reformulation with nutritional targets that also take into account sensory and technical challenges. Although they may appear simple, many dietary recommendations translate into complex technical and sensory challenges for food producers. For example, reducing the level of SFA in food products affects many aspects of the food supply chain, from production to consumer preference( Reference Downs, Gupta and Ghosh-Jerath 49 ). Salt plays a role in the preservation and structure of food products (such as dressings, bread and meats), and has a strong effect on the final taste and consumer acceptance( Reference Jaenke, Barzi and McMahon 50 ). To this end, stealth reformulation can be used successfully, as evidenced by the gradual reductions in salt consumption, which was achieved in part due to product reformulation( 51 – Reference Wyness, Butriss and Stanner 53 ). Combet et al.( Reference Combet, Jarlot and Aidoo 54 ) redesigned the typical Margherita pizza in order to meet all the target nutrient recommendations, while maintaining a reasonable portion size. The authors achieved this through essentially undetectable modifications to the traditional recipe and the use of small amounts of functional ingredients (red pepper and seaweed), which enabled them to augment the amount of vitamins A, C and iron. Importantly, the nutritionally-balanced pizza was acceptable to a panel of consumers that included adults and children( Reference Combet, Jarlot and Aidoo 54 ).
This is an encouraging example of a successful innovation but the question remains how to guide the consumer. One option is front-of-pack labelling and several schemes such as traffic lights, colour coding or health logos have been created to enable easier identification of nutritious products( Reference Fulgoni, Keast and Drewnowski 22 , Reference Rayner, Scarborough and Lobstein 32 , Reference Darmon, Vieux and Maillot 37 , Reference Roodenburg, Popkin and Seidell 40 , Reference Hawley, Roberto and Bragg 55 , Reference Hodgkins, Raats and Fife-Schaw 56 ). Studies demonstrated that diets containing a higher amount of products meeting front-of-pack nutritional targets were associated with an overall reduction in disease risks( Reference Adriouch, Julia and Kesse-Guyot 57 , Reference Chiuve, Sampson and Willett 58 ).
Conclusions
Addressing the global burden of non-communicable diseases requires a range of strategies that work synergistically to improve a population's diet as any single intervention in isolation will only have a small overall impact( Reference Dobbs, Sawers and Thompson 6 ).
In the UK and USA 60 % of the daily energy intake comes from packaged foods; in developing countries and emerging economies packaged foods represent still a minimum of one quarter of the daily energy intake( Reference Monteiro, Levy and Claro 59 – Reference Adams and White 62 ). In this context the actions of the private food sector hold tremendous potential to influence the diet of a population, in terms of scale and reach( Reference Yach, Khan and Bradley 63 ). The re-designing of food products is therefore of fundamental importance, as this strategy can reach nearly the entire society by providing more nutritious products straight off the shelf without the need to change consumer behaviour( Reference Winkler 64 ). The findings discussed in this review suggest that food and beverage reformulation, if implemented throughout the entire food industry, could have a positive effect on the food supply, resulting in improved dietary intakes and reduction of disease risk in the general population.
However, reformulation alone will still only have a limited impact and other measures such as consumer education and the promotion of a healthy lifestyle are very important for creating an environment that fosters healthier choices. Lasting success and sustainable food systems can only be achieved with the principles of ‘keeping the consumer in mind’ and the involvement of all stakeholders concerned (i.e. the engagement of the entire food sector, from farmers and manufacturers, to restaurants and retailers). Reaching such environment demands the development and the implementation of solutions that are easy to understand, provide incentives to make healthy choices and remove barriers for diet change; that have long-term focus and take socio-economic status into consideration to address best social inequalities in nutrition and health( Reference Darmon and Drewnowski 65 , Reference Kim, Symons and Popkin 66 ).
Acknowledgements
The authors would like to thank Liz Read for provision of relevant literature and Mathilde Gressier who assisted with the reference collection for the review. The support of Karen Yeow for the manuscript review was highly appreciated.
Financial Support
This work was supported by Nestec Ltd, which is a wholly owned affiliate of Nestlé S.A.
Conflicts of Interest
U. L., V. R. C., A. V., G. M. and J. S. are employed by Nestlé Research Center, Switzerland, a member of Nestec Ltd. Nestec Ltd, a wholly owned affiliate of Nestlé S.A, provides professional assistance, research and consulting services for food, dietary, dietetic and pharmaceutical products of interest to Nestlé S.A.
Authorship
U. L., A. V. and G. M. conceptualised the work. U. L. conducted the literature search. All authors contributed jointly to the writing of the present paper.


 Open access