


1. Introduction
Evaporation in porous media is a process of particular interest in many applications, such as weathering of monuments and buildings (Derluyn, Moonen & Carmeliet Reference Derluyn, Moonen and Carmeliet2014; Veran-Tissoires & Prat Reference Veran-Tissoires and Prat2014), drainage in proton exchange membrane fuel cells (Wu et al. Reference Wu, Zhao, Tsotsas and Kharaghani2017), mineral precipitation induced by saline evaporation in geological carbon sequestration (Huppert & Neufeld Reference Huppert and Neufeld2014; He, Jiang & Xu Reference He, Jiang and Xu2019), self-assembly of porous materials resulting from the evaporation of colloidal suspensions (Hamon et al. Reference Hamon2012) and transpiration cooling for thermal protection (Huang et al. Reference Huang, Zhu, Jiang and Xiong2015b) to name but a few. Some applications would benefit from controlling the evaporation pattern and rate. For example, in the self-assembly of nanoparticles in porous materials, the evaporation rate affects the generation of self-assembled structures and the evaporation pattern determines how and where the particles accumulate and assemble (Qin et al. Reference Qin, Del Carro, Mazloomi Moqaddam, Kang, Brunschwiler, Derome and Carmeliet2019). In geological carbon sequestration, the brine evaporation pattern determines the salt precipitation, which alters the pore structure and transport properties of the reservoir and therefore impairs the injection process (He et al. Reference He, Xu, Ji and Jiang2022; Yang et al. Reference Yang, Lei, Wang, Xu, Chen and Luo2023). In many others, a common aim is to promote a fast evaporation rate to improve the efficiency of water management and thermal management. Thus, the study of evaporation in porous media, with the focus on deeper understanding of the evaporation rate and pattern, can support the advancement in many fields of science and technology.
The global evaporation kinetics of a porous medium is usually presented by the canonical form, i.e. the drying curve, which shows the change of evaporation rate with respect to the degree of liquid saturation (S). In both experimental and simulation work, a typical transition in the drying curve is often observed (Chen & Pei Reference Chen and Pei1989; Coussot Reference Coussot2000; Chauvet et al. Reference Chauvet, Duru, Geoffroy and Prat2009). During the first period, the evaporation rate is essentially constant (or slightly decreasing) and determined mostly by external conditions; this stage of drying is referred to as the constant rate period (CRP). The last period, called the receding front period (RFP), is limited by transport properties of porous media and characterized by an internal evaporation front receding into the porous medium. The intermediate period in between, the falling rate period (FRP), depends on the interplay between external and internal conditions and is characterized by a fast drop in evaporation rate. The CRP discharges a larger amount of liquid in a shorter time than the other two periods. Increasing the CRP average evaporation rate as high as possible and prolonging its duration as long as possible towards lower saturation levels improves the global drying efficiency. The evaporation rate in CRP can be improved by changing atmospheric conditions, e.g. increasing air flow and decreasing relative humidity (Fei et al. Reference Fei, Qin, Zhao, Derome and Carmeliet2022, Reference Fei, Qin, Zhao, Derome and Carmeliet2023). Laurindo & Prat (Reference Laurindo and Prat1998) investigated the evaporation process in a two-dimensional (2-D) quasi-isothermal micromodel of three basic cases, namely in the absence of gravity forces, in a stabilizing gravity field and in a destabilizing gravity field, and found that thin liquid films have significant contributions to the evaporation rate. Alternatively, drying can be improved by optimizing the porous medium itself. Shokri, Lehmann & Or (Reference Shokri, Lehmann and Or2010) conducted drying experiments in layered porous media. The duration of CRP is shown to depend on the thickness of each layer and their layering sequence. A composite characteristic length is proposed to predict the drying front depth at the end of CRP, while drying dynamics at the pore scale could not be observed. Pillai, Prat & Marcoux (Reference Pillai, Prat and Marcoux2009) conducted a pore-network study of evaporation in two bilayered porous media, i.e. one with a larger-pore layer covering a smaller-pore layer, and one with a smaller-pore layer covering a larger-pore layer. In the latter case, evaporation starts simultaneously in the two layers due to evaporation in the smaller-pore layer and capillary pumping from the inner larger-pore layer to the top smaller-pore layer, resulting in a global faster evaporation rate than seen in the former case. Wu, Kharaghani & Tsotsas (Reference Wu, Kharaghani and Tsotsas2016) elaborately designed a 2-D microfluidic network in which the liquid saturation decreases linearly with time during its drying, leading to a perfect CRP throughout the drying phase. However, to induce sufficient capillary pumping, the evaporation rate had to be slow, thus requiring a fine throat connected to the outlet. As a result, drying of the  $8\ {\rm mm} \times 8\ {\rm mm}$ chip takes one week. Qin et al. (Reference Qin, Del Carro, Mazloomi Moqaddam, Kang, Brunschwiler, Derome and Carmeliet2019) designed two synthetic micropore structures, i.e. spiral shaped and gradient shaped, to favour capillary pumping. They aimed to extend the CRP until the end of evaporation, although the evaporation rate is decreasing along the pathways. In addition, such structures are limited to the condition that all four boundaries are open to the environment. Using isothermal lattice Boltzmann (LB) simulations (no evaporative cooling included), Panda et al. (Reference Panda, Paliwal, Sourya, Kharaghani, Tsotsas and Surasani2020a) imposed a temperature gradient on a porous medium. The drying pattern exhibits invasion percolation increasing downwards and the CRP holds until $S \approx 0.1$. The main challenge of this technique lies in obtaining a linear temperature profile inside the porous media, which seems difficult in practice due to evaporative cooling effects.
As seen above, the global evaporation rate can be increased by means of boundary conditions, optimization of porous media configuration, i.e. pore size, distribution and layering, and the presence of temperature gradient. Despite these great efforts, specifically, the drying of heterogeneous porous media has received relatively little attention. The objective of the present work is to study the effect of heterogeneous configurations of wettability and of pores of different sizes on convective evaporation in a porous medium, where a gas mixture is blown over the surface of a wet porous medium. We use the common assumption of isothermal conditions, at room temperature, meaning thermal effects due to evaporative cooling are considered negligible (Pillai et al. Reference Pillai, Prat and Marcoux2009; Defraeye et al. Reference Defraeye, Blocken, Derome, Nicolai and Carmeliet2012). Different from the work of Pillai et al. (Reference Pillai, Prat and Marcoux2009) who considers the porous medium divided into two layers, here more general cases with multiple layers are considered. Besides, we investigate scenarios of multiple layers with different contact angles or pore sizes first, followed by more complex cases with combined heterogeneous wettability and pore size distribution. The results are analysed in terms of invasion patterns and evaporation dynamics. The complexity of the study is twofold: (i) multiphysics processes are involved and coupled, including liquid–vapour phase change, multiphase interface dynamics and multicomponent transport inside the porous media, as well as convection/diffusion to the surroundings; (ii) phenomena are typically multiscale spatially and temporally, as the characteristic length ranges from the pore scale to the environment scale and the characteristic time spans from fast convection time scale to slow diffusion time scale. For such a study, pore-scale dynamics need to be documented, however, accurate extraction of the dynamic pore-scale information from experimental work is challenging even with the most advanced experimental techniques. To ensure the detailed elucidation of the underlying mechanisms, we use a multicomponent LB model with the ability to resolve the detailed pore-scale evaporation dynamics and complement this work with theoretical analysis.
The lattice Boltzmann method (LBM) (Qian, d'Humières & Lallemand Reference Qian, d'Humières and Lallemand1992; Succi Reference Succi2018), which solves a specific discrete Boltzmann equation designed to reproduce the continuous Navier–Stokes equations in the low-Mach number limit, has been increasingly used as a very powerful pore-scale model for various flows and transport phenomena in complex porous media (Liu et al. Reference Liu, Kang, Leonardi, Schmieschek, Narváez, Jones, Williams, Valocchi and Harting2016; Chen et al. Reference Chen, He, Zhao, Kang, Li, Carmeliet, Shikazono and Tao2022). The mesoscale nature of LBM allows its natural incorporation of microscale and mesoscale physics, providing insightful access to multiphase/multicomponent interface dynamics (Shan & Chen Reference Shan and Chen1993, Reference Shan and Chen1994; Huang, Sukop & Lu Reference Huang, Sukop and Lu2015a; Li et al. Reference Li, Luo, Kang, He, Chen and Liu2016; Huang, Li & Adams Reference Huang, Li and Adams2022). The bounce-back type of boundary schemes in LBM is very suitable for flows in complex pore structures (Liu et al. Reference Liu, Kang, Leonardi, Schmieschek, Narváez, Jones, Williams, Valocchi and Harting2016; Chen et al. Reference Chen, He, Zhao, Kang, Li, Carmeliet, Shikazono and Tao2022), discarding the need for significant simplification of real geometries as done in pore network models (PNMs) (Fatt Reference Fatt1956; Zhao et al. Reference Zhao2019). In addition, the canonical ‘collision-streaming’ algorithm disentangles nonlinearity and non-locality (Succi Reference Succi2015), i.e. the nonlinear collision operator is entirely local and the non-local streaming is linear towards the discrete distribution, making it highly efficient in large-scale parallel computations (Fei et al. Reference Fei, Yang, Chen, Mo and Luo2020; Luo, Fei & Wang Reference Luo, Fei and Wang2021; Wang, Fei & Luo Reference Wang, Fei and Luo2022). Recently, LBM has been extended to study evaporation in porous media. Qin et al. (Reference Qin, Del Carro, Mazloomi Moqaddam, Kang, Brunschwiler, Derome and Carmeliet2019) proposed a thermal entropic multiple-relaxation-time LBM to study the evaporation in synthetic pore structures and achieved a satisfying agreement with experiment results. The model is hybrid, where the flow and temperature fields are solved by a pseudopotential LB model and a finite difference scheme, respectively. Further coupling with a nanoparticle transport model allows us to investigate nanoparticle depositions resulting from evaporation in porous media (Qin et al. Reference Qin, Su, Zhao, Moqaddam, Del Carro, Brunschwiler, Kang, Song, Derome and Carmeliet2020, Reference Qin, Fei, Zhao, Kang, Derome and Carmeliet2023). To improve the computational efficiency, Zhao et al. (Reference Zhao, Qin, Kang, Derome and Carmeliet2022, Reference Zhao, Liu, Qin, Fei, Wang, Shang, Guo and Zhou2023) proposed a coupled LBM–PNM for isothermal evaporation in porous media by using LBM for two-phase regions and PNM for the single-liquid and single-vapour phase regions, respectively. Nevertheless, the above models are limited to single component phase change processes, e.g. systems with pure water and its vapour, without involving the non-condensable component, e.g. dry air in the gas phase. Based on a multicomponent pseudopotential model, Zachariah, Panda & Surasani (Reference Zachariah, Panda and Surasani2019) proposed a two-component LBM to investigate invasion patterns during convective drying of porous media. The model has also been applied to study micro–macro interactions during the drying of bundles of capillaries (Panda et al. Reference Panda, Supriya, Kharaghani, Tsotsas and Surasani2020b) and stabilizing and destabilizing evaporation fronts induced by surface tension gradient during the drying of porous media (Panda et al. Reference Panda, Paliwal, Sourya, Kharaghani, Tsotsas and Surasani2020a). However, the multicomponent diffusion in the gas phase, a key factor affecting the evaporation patterns, is not clearly described in the model of Zachariah et al. (Reference Zachariah, Panda and Surasani2019), and the used LBM collision operator and forcing scheme limit the convective inflow Reynolds number ( $Re$) to very small values ( ${\sim }0.05$). More recently, Fei et al. (Reference Fei, Qin, Zhao, Derome and Carmeliet2022, Reference Fei, Qin, Zhao, Derome and Carmeliet2023) developed a two-component cascaded LBM for convective evaporation in porous media, which includes the correct binary diffusion mechanism in the gas phase and is suitable for convective drying of porous media with varying contact angles ( $\theta$) and $Re$. Moreover, the model improves significantly the achievable concentration of the non-condensable gas in the gas phase from 1 %–2 % commonly reported in the literature to 95 %, making it able to simulate the evaporation of porous media in the natural environment. The model has been validated by comparison with the theoretical solution of the Stefan problem and microfluidic evaporation experiments by Wu et al. (Reference Wu, Kharaghani and Tsotsas2016). Using the model, Fei et al. (Reference Fei, Qin, Zhao, Derome and Carmeliet2022, Reference Fei, Qin, Zhao, Derome and Carmeliet2023) investigated the convective evaporation of a dual-porosity medium and reproduced the classical transition from CRP to RFP in the drying curve. A universal scaling formulation is also proposed to predict the evaporation rate during CRP with respect to three governing factors, i.e. relative humidity, contact angle $\theta$ and $Re$.
$Re$.
Despite much literature on the study of evaporation in porous media, the effect of heterogeneous distribution of wettability and pore size on convective evaporation of layered porous media is still not well understood. In this work, we present a systematic study of such a problem using the pore-scale LBM and theoretical analysis. In § 2, we will give a brief introduction to the employed numerical model. The computational set-up is described in § 3, followed by extensive simulations and analysis in § 4. Finally, in § 5, we conclude the paper.
2. Numerical model
For the sake of completeness, the recent LB model for two-component isothermal evaporation in porous media is briefly introduced in this section, and for more details, interested readers are kindly directed to our previous works (Fei et al. Reference Fei, Qin, Zhao, Derome and Carmeliet2022, Reference Fei, Qin, Zhao, Derome and Carmeliet2023). Following the standard LB algorithm, our model consists of two steps: (i) the collision step, representing the time relaxation towards the local equilibrium state due to molecular collisions, and (ii) the streaming step, standing for molecular free streaming. The former depends on the collision models while the latter is trivial, which streams the postcollision density distribution function (DDF) for each component k ( $=A,B$) at the present space–time point $( {\boldsymbol {x},t} )$ exactly to the neighbouring lattice point, along the ith lattice direction by the discrete velocity ${\boldsymbol {e}_i}$ within one time step $\delta t$, i.e.
 \begin{equation} f_i^k(\boldsymbol{x} + {\boldsymbol{e}_i}\delta t,t + \delta t) = f_i^{k,*}\left( {\boldsymbol{x},t} \right)\!. \end{equation}
The hydrodynamic variables of the two-component mixture (density  $\rho$ and velocity $\boldsymbol {u}$) are updated after the streaming step by the following definitions:
 \begin{equation} \rho = \sum_k {{\rho _k}} = \sum_k {\sum_i {f_i^k} } ,\quad \rho {\boldsymbol{u}} = \sum_k {{\rho _k}{{\boldsymbol{u}}_k}} = \sum_k {\left( {\sum_i {f_i^k} {{\boldsymbol{e}}_i} + 0.5\delta t{{\boldsymbol{F}}^k}} \right)}, \end{equation}
where  $\rho _k$ , $\boldsymbol {u}_k$ and ${\boldsymbol {F}}^k$ are the component density, component velocity and the total force imposed on each component, respectively.
To suit the problems under investigation, a specific collision model can be selected among the many, such as the single-relaxation-time (Qian et al. Reference Qian, d'Humières and Lallemand1992), multiple-relaxation-time (Lallemand & Luo Reference Lallemand and Luo2000), cascaded or central-moment (Geier, Greiner & Korvink Reference Geier, Greiner and Korvink2006) and the entropic-multiple-relaxation-time schemes (Karlin, Bösch & Chikatamarla Reference Karlin, Bösch and Chikatamarla2014), which have been reviewed in detail and integrated into a unified framework (Luo et al. Reference Luo, Fei and Wang2021). In this work, the cascaded model is employed as it possesses excellent numerical stability (Geier et al. Reference Geier, Greiner and Korvink2006; Fei et al. Reference Fei, Yang, Chen, Mo and Luo2020), while it allows achieving non-slip boundary conditions (Fei & Luo Reference Fei and Luo2017; Fei, Luo & Li Reference Fei, Luo and Li2018) and tuning the Schmidt number (Fei et al. Reference Fei, Qin, Zhao, Derome and Carmeliet2022, Reference Fei, Qin, Zhao, Derome and Carmeliet2023). In the cascaded LB model, the DDF is first projected onto the central moment space, then central moments at different orders are relaxed towards their equilibria separately, and finally the postcollision DDF is reconstructed. The three substeps of the collision step can be written concisely as
 $$\begin{gather} f_i^{k,*}(\boldsymbol{x},t) = f_i^k(\boldsymbol{x},t) - ({{\boldsymbol{M}}^{ - 1}}{\boldsymbol{N}^{ - 1}}{\boldsymbol{S}}{\boldsymbol{NM}})\left[ {f_i^k(\boldsymbol{x},t) - f_i^{k,eq}(\boldsymbol{x},t)} \right]\nonumber\\ + \,\delta t{{\boldsymbol{M}}^{ - 1}}{\boldsymbol{N}^{ - 1}}({\boldsymbol{I}} - {\boldsymbol{S}}/2){\boldsymbol{NM}}R_i^k(\boldsymbol{x},t), \end{gather}$$
where  $f_i^{k,eq}$ is the k-component equilibrium DDF, and $R_i^k$ represents the forcing term in the discrete velocity space, i.e. a function of ${\boldsymbol {F}}^k$. The transformation matrix $\boldsymbol {M}$ transfers DDFs to their raw moments, and the shift matrix $\boldsymbol {N}$ shifts raw moments to the corresponding central moments. Here $\boldsymbol {I}$ is the unit matrix, and $\boldsymbol {S}$ is a diagonal relaxation matrix, whose non-zero elements are the relaxation parameters for different central moments. The explicit formulations of $\boldsymbol {M}$ and $\boldsymbol {N}$ and their inverses ( $\boldsymbol {M}^{-1}$ and $\boldsymbol {N}^{-1}$) depend on the discrete velocity model and the selected central moment set. The simulations in the present work are conducted both in two dimensions and three dimensions, and the classical 2-D nine-velocity (D2Q9) and 3-D nineteen-velocity (D3Q19) lattices (Qian et al. Reference Qian, d'Humières and Lallemand1992) are used, respectively. In the numerical implementation, the matrix manipulations on $f_i^{k,eq}$ and $R_i^k$ are not needed since their central moments are defined by matching a natural central moment set of the Maxwellian distribution (Fei & Luo Reference Fei and Luo2017; Fei et al. Reference Fei, Luo and Li2018)
 \begin{align} \left. \begin{gathered}
{\rm 2}\hbox{-}{\rm D}\left\{
\begin{array}{@{}l} {\boldsymbol{NM}}f_i^k = {\Big[ {{\rho
_k},0,0,2{\rho _k}c_s^2,0,0,0,0,{\rho _k}c_s^4}
\Big]^{\rm T}},\\ {\boldsymbol{NM}}R_i^k = {\left[
{0,F_x^k,F_y^k,0,0,0,F_y^kc_s^2,F_x^kc_s^2,0} \right]^{\rm
T}}, \end{array} \right.\\ {\rm
3}\hbox{-}{\rm D}\left\{ \begin{array}{@{}l}
{\boldsymbol{NM}}f_i^k = {\Big[ {{\rho
_k},0,0,0,0,0,0,{\rho _k}c_s^2,{\rho _k}c_s^2,{\rho
_k}c_s^2,0,0,0,0,0,0,{\rho _k}c_s^4,{\rho _k}c_s^4,{\rho
_k}c_s^4} \Big]^{\rm T}},\\ {\boldsymbol{NM}}R_i^k =
{\left[
{0,F_x^k,F_y^k,F_z^k,0,0,0,0,0,0,F_x^kc_s^2,F_x^kc_s^2,F_y^kc_s^2,F_z^kc_s^2,F_y^kc_s^2,F_z^kc_s^2,0,0,0}
\right]^{\rm T}}, \end{array} \right.
\end{gathered} \!\!\right\}
\end{align}
\begin{align} \left. \begin{gathered}
{\rm 2}\hbox{-}{\rm D}\left\{
\begin{array}{@{}l} {\boldsymbol{NM}}f_i^k = {\Big[ {{\rho
_k},0,0,2{\rho _k}c_s^2,0,0,0,0,{\rho _k}c_s^4}
\Big]^{\rm T}},\\ {\boldsymbol{NM}}R_i^k = {\left[
{0,F_x^k,F_y^k,0,0,0,F_y^kc_s^2,F_x^kc_s^2,0} \right]^{\rm
T}}, \end{array} \right.\\ {\rm
3}\hbox{-}{\rm D}\left\{ \begin{array}{@{}l}
{\boldsymbol{NM}}f_i^k = {\Big[ {{\rho
_k},0,0,0,0,0,0,{\rho _k}c_s^2,{\rho _k}c_s^2,{\rho
_k}c_s^2,0,0,0,0,0,0,{\rho _k}c_s^4,{\rho _k}c_s^4,{\rho
_k}c_s^4} \Big]^{\rm T}},\\ {\boldsymbol{NM}}R_i^k =
{\left[
{0,F_x^k,F_y^k,F_z^k,0,0,0,0,0,0,F_x^kc_s^2,F_x^kc_s^2,F_y^kc_s^2,F_z^kc_s^2,F_y^kc_s^2,F_z^kc_s^2,0,0,0}
\right]^{\rm T}}, \end{array} \right.
\end{gathered} \!\!\right\}
\end{align}
where  ${c_s} = \sqrt {1/3}$ is the lattice sound speed and ${\rm T}$ denotes the transposition.
With the above equations, the following Navier–Stokes and convection–diffusion equations (supplemented by an equation of state, i.e. (2.8)) for the two-component two-phase flows can be reproduced via the Chapman–Enskog analysis in the low-Mach limit (Fei et al. Reference Fei, Qin, Zhao, Derome and Carmeliet2023):
 \begin{align} \left. \begin{gathered} {\partial _t}\rho + \boldsymbol{\nabla} \boldsymbol{\cdot} (\rho {\boldsymbol{u}}) = 0,\\ {\partial _t}(\rho {\boldsymbol{u}}) + \boldsymbol{\nabla} \boldsymbol{\cdot} (\rho {\boldsymbol{uu}}) =- \boldsymbol{\nabla} (\rho c_s^2) + {\boldsymbol{F}} + \boldsymbol{\nabla} \boldsymbol{\cdot} \left[ {\rho \nu \left( {\boldsymbol{\nabla} {\boldsymbol{u}} + \boldsymbol{\nabla} {{\boldsymbol{u}}^{\rm T}}} \right) + \rho ({\nu _b} - \nu )(\boldsymbol{\nabla} \boldsymbol{\cdot} {\boldsymbol{u}}){\boldsymbol{I}}} \right]\!,\\ {\partial _t}{Y_k} + {\boldsymbol{u}} \boldsymbol{\cdot} \boldsymbol{\nabla} {Y_k} = \alpha {\nabla^2}{Y_k}, \end{gathered} \right\} \end{align}
where  $\boldsymbol {F}={\sum }_k {{{\boldsymbol {F}}_k}}$ is the total force field imposed on the system, $Y_k=\rho _k/\rho$ is the component mass fraction, $\nu$, $\nu _b$ and $\alpha$ are the mixture kinetic viscosity, bulk viscosity and binary diffusivity, respectively.
To model the phase/component separation and the liquid–vapour phase change, we propose to appropriately incorporate the two-component two-phase pseudopotential interactions (Shan & Chen Reference Shan and Chen1993, Reference Shan and Chen1994) into the present model. For the phase-change component (water component, denoted as  $k=A$ in the following), an intracomponent force ${{\boldsymbol {F}}_{AA}}$ between the liquid water and its vapour is needed. The non-condensable dry air component ( $k=B$) is miscible with water vapour but almost insoluble in liquid water, which is achieved by a repulsive intercomponent force ${{\boldsymbol {F}}_{AB}}$. They are given explicitly as follows:
 \begin{equation} \left. \begin{gathered} {{\boldsymbol{F}}_{AA}} =- {G_{AA}}\psi ({\boldsymbol{x}})\sum_i {w\left( {{{\left| {{{\boldsymbol{e}}_i}} \right|}^2}} \right)} \psi ({\boldsymbol{x}} + {{\boldsymbol{e}}_i}\Delta t){{\boldsymbol{e}}_i},\\ {{\boldsymbol{F}}_{AB}} =- {G_{AB}}{\rho _A}({\boldsymbol{x}})\sum_i {w\left( {{{\left| {{{\boldsymbol{e}}_i}} \right|}^2}} \right)} {\rho _B}({\boldsymbol{x}} + {{\boldsymbol{e}}_i}\Delta t){{\boldsymbol{e}}_i}, \end{gathered} \right\} \end{equation}
where  $G_{AA}$ and $G_{AB}$ are the interaction strengths, and $w$ is the interaction weight. If no other forces are considered, we have ${{\boldsymbol {F}}^{A}}={{\boldsymbol {F}}_{AA}}+{{\boldsymbol {F}}_{AB}}$. For the dry air component ( $k=B$), it is treated as an ideal gas and the intracomponent force for phase separation is not needed, i.e.
 \begin{equation} {{\boldsymbol{F}}^B} = {{\boldsymbol{F}}_{BA}} =- {G_{BA}}{\rho _B}({\boldsymbol{x}})\sum_i {w\left( {{{\left| {{{\boldsymbol{e}}_i}} \right|}^2}} \right)} {\rho _A}({\boldsymbol{x}} + {{\boldsymbol{e}}_i}\Delta t){{\boldsymbol{e}}_i}, \end{equation}
with  $G_{BA}=G_{AB}$ according to Newton's third law. To incorporate the non-ideal equation of state (EOS) into the system, we use the square-root form pseudopotential function $\psi = \sqrt {2({\,p_{EOS}} - {\rho _A}c_s^2)/3{G_{AA}}c_s^2}$ with fixed $G_{AA}=-1$ (Yuan & Schaefer Reference Yuan and Schaefer2006). In the present work, we use the Peng–Robinson (P–R) EOS (Peng & Robinson Reference Peng and Robinson1976),
 \begin{equation} {p_{EOS}} = \frac{{{\rho _A}RT}}{{1 - b{\rho _A}}} - \frac{{a\varphi (T)\rho _A^2}}{{1 + 2b{\rho _A} - {b^2}\rho _A^2}}, \end{equation}
where  $\varphi (T) = {[1 + (0.37464 + 1.54226\varpi - 0.26992{\varpi ^2})(1 - \sqrt {T/{T_{cr}}} )]^2}$, and R=1 is the gas constant. When the acentric factor is set as $\varpi =0.344$, the coexistence curve given by the P–R EOS matches the experiment data of saturated water/steam very well (Yuan & Schaefer Reference Yuan and Schaefer2006). Therefore, the P–R EOS is widely used to model boiling and evaporation phenomena (Li et al. Reference Li, Kang, Francois, He and Luo2015, Reference Li, Luo, Kang, He, Chen and Liu2016) in the LB community. The critical pressure $p_{cr}$ and $T_{cr}$ temperature are determined by $a = 0.4572{R^2}T_{cr}^2/{p_{cr}}$ and $b = 0.0778R{T_{cr}}/{p_{cr}}$. With such a choice, the system suffers from the so-called thermodynamic inconsistency that the liquid–vapour coexistence densities by the mechanical stability condition deviate from the theoretical solutions by the Maxwell construction. To solve the problem, a widely used method is to adjust the mechanical stability condition by adding a modification term in the force scheme (Li, Luo & Li Reference Li, Luo and Li2012, Reference Li, Luo and Li2013). For our two-component system, only the central-moment forcing scheme for the phase change component needs to be slightly modified
 \begin{align} \left. \begin{gathered}
{\rm 2}\hbox{-}{\rm
D}\qquad{\boldsymbol{NM}}R_i^A = {\left[
{0,F_x^A,F_y^A,\eta ,0,0,F_y^Ac_s^2,F_x^Ac_s^2,0}
\right]^{\rm T}},\\ {\rm 3}\hbox{-}{\rm
D}\qquad{\boldsymbol{NM}}R_i^A = {\left[
{0,F_x^A,F_y^A,F_z^A,0,0,0,\eta ,\eta ,\eta
,F_x^Ac_s^2,F_x^Ac_s^2,F_y^Ac_s^2,F_z^Ac_s^2,F_y^Ac_s^2,F_z^Ac_s^2,0,0,0}
\right]^{\rm T}}, \end{gathered} \right\}
\end{align}
\begin{align} \left. \begin{gathered}
{\rm 2}\hbox{-}{\rm
D}\qquad{\boldsymbol{NM}}R_i^A = {\left[
{0,F_x^A,F_y^A,\eta ,0,0,F_y^Ac_s^2,F_x^Ac_s^2,0}
\right]^{\rm T}},\\ {\rm 3}\hbox{-}{\rm
D}\qquad{\boldsymbol{NM}}R_i^A = {\left[
{0,F_x^A,F_y^A,F_z^A,0,0,0,\eta ,\eta ,\eta
,F_x^Ac_s^2,F_x^Ac_s^2,F_y^Ac_s^2,F_z^Ac_s^2,F_y^Ac_s^2,F_z^Ac_s^2,0,0,0}
\right]^{\rm T}}, \end{gathered} \right\}
\end{align}
where  $\eta = 4\sigma {| {{{\boldsymbol {F}}_{AA}}} |^2}/[{\psi ^2}\Delta t(1/{s_b} - 0.5)]$ and $\sigma$ is an adjustment factor. Following (Li et al. Reference Li, Kang, Francois, He and Luo2015), the temperature is set as $T_s=0.86T_{cr}$, leading to the saturated liquid density $\rho _l^s\approx 6.5$ and saturated vapour density $\rho _v^s\approx 0.38$. By setting $a=3/49$ and $b=2/21$, the diffused liquid–vapour interface has a width of five lattice spacings ( $\Delta x$). Under this condition, the adjustment factor is chosen as $\sigma =0.099$ to achieve a thermodynamic consistent mechanical stability condition. We would like to note using such a liquid–vapour density ratio is based on two considerations: (i) the spurious velocity magnitude can be reduced to be $\sim O({10^{ - 3}})$ to suppress its defects and (ii) the evaporation rate is limited by the maximum gas velocity ( $\le$0.1) at the low Mach number condition and therefore a smaller density ratio is beneficial for a faster dry out of a given volume of liquid.
Finally, to deal with the wettability, the geometry-function-based contact angle scheme, originally developed in single-component systems (Ding & Spelt Reference Ding and Spelt2007; Li, Yu & Luo Reference Li, Yu and Luo2019; Qin et al. Reference Qin, Zhao, Kang, Derome and Carmeliet2021), has been extended to two-component systems. Compared with the other contact angle schemes, like the solid–fluid interaction scheme (Martys & Chen Reference Martys and Chen1996; Li et al. Reference Li, Luo, Kang and Chen2014) and virtual-density scheme (Benzi et al. Reference Benzi, Biferale, Sbragaglia, Succi and Toschi2006), the geometry-function-based scheme prescribes the contact angle as an input rather than a measured output, usually yields much smaller spurious currents and does not suffer from the problem of an artificial liquid film near the solid boundary (Li et al. Reference Li, Yu and Luo2019). Moreover, in our extended two-component version, the contact angle can be tuned independently of the vapour mass fraction in the gas phase. For more details, one can refer to Fei et al. (Reference Fei, Qin, Zhao, Derome and Carmeliet2023).
3. Computational set-up
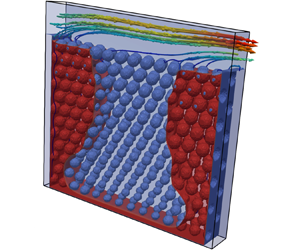
Convective drying occurs when a gas mixture is convectively blown over the surface of a porous medium filled with liquid (Coussot Reference Coussot2000; Defraeye et al. Reference Defraeye, Blocken, Derome, Nicolai and Carmeliet2012). To study the effects of heterogeneity on such evaporation processes, we consider the convective drying system sketched in figure 1(a). The porous medium 1 (PM1) initially fully filled with liquid water is centred in the computational domain. A gas mixture (water vapour and dry air) with a Poiseuille inflow velocity profile is blown from left to right through the top channel over the porous medium. The gas mixture takes away the vapour exiting the porous medium and flows out on the right-hand side. The porous medium, with larger pores in its middle vertical section and smaller pores on both sides, has a global porosity of 0.72, which is designed by filling smaller solid cylinder particles in the middle and larger ones on both sides in a rectangular domain ( $L\times H$), respectively. The reference porous medium 1 (PM1) is shown in the schematic diagram (figure 1a). In addition, we also consider other cases with different pore geometry, figure 1(b). Compared with PM1, porous medium 2 (PM2) shows a more uniform pore size distribution. For porous medium 3 (PM3), the upper part pore sizes are slightly decreased, and the lower part is slightly increased. On the contrary, porous medium 4 (PM4) has larger pores on the top and smaller pores at the bottom. Moreover, we consider porous media with multiple layers (three layers in PM5 and four layers in PM6) with increasing pore sizes from the top to the bottom. All porous media have approximately the same porosity, despite varying pore size distributions. We would like to note that the choice of the porosity, 0.72, is mainly following our previous work (Fei et al. Reference Fei, Qin, Zhao, Derome and Carmeliet2023), rather than a limitation. In the Appendix, it is shown that the main conclusion of the present study also works for a porous medium with a smaller porosity of 0.59.

Figure 1. (a) Schematic diagram of the convective drying of porous medium 1 (PM1), where the gas mixture blows through the channel with a Poiseuille velocity profile over the porous medium from left to right. The porous medium is initially filled with liquid water. All porous media have three vertical sections with larger pores in the middle compared with the pores at the sides. Each porous medium is designed by filling solid disks in the domain, and a sketch of the exact disk sizes is given in panel (b). The PM1 and PM2 have vertically uniform pore sizes, whereas PM2 shows a more uniform pore size distribution than PM1. The PM3 and PM4 have two horizontal layers, where in PM3 the pore size increases from top to bottom, and in PM4 the pore size decreases from top to bottom. The PM5 and PM6 have three and four horizontal layers with increasing pore sizes from the top to the bottom, respectively.
To achieve accurate LBM simulations of evaporation dynamics at the pore scale, it is usually needed that the smallest pore/particle size  $l_m$ should be two times larger than the interface thickness (typically five lattice spacings) (Zhao et al. Reference Zhao, Qin, Derome and Carmeliet2020; Qin et al. Reference Qin, Zhao, Kang, Derome and Carmeliet2021). Based on this guideline and a grid resolution test, we observed a system size of $L\times H =481\Delta x \times 401\Delta x$ is fine enough for the present simulations (Fei et al. Reference Fei, Qin, Zhao, Derome and Carmeliet2022). The top channel should be wide enough to resolve the fully developed vapour boundary layer, and the inlet/outlet section length $L_1/L_2$ needs to be long enough to eliminate the inlet/outlet effects. Following our previous study (Fei et al. Reference Fei, Qin, Zhao, Derome and Carmeliet2023), we set the channel width as $H_1=100\Delta x$, with $L_1=L_2/2=H_1$. Our simulations will be mainly carried out in two dimensions, while some three-dimensional (3-D) simulations will also be considered in § 4.3 to support the findings in two dimensions.
The ability of our model to simulate evaporation in porous media has been well validated in Fei et al. (Reference Fei, Qin, Zhao, Derome and Carmeliet2023) with the experimental results of Wu et al. (Reference Wu, Kharaghani and Tsotsas2016). A systematic parameter study of the evaporation process in a similar configuration was conducted probing the effects of inflow Reynolds number ( $Re={U_m}{H_1}/2\nu$, defined with the peak inflow velocity $U_m$ and the kinematic viscosity $\nu$), inflow vapour concentration ( $Y_{vapour,in}=\rho _{A,in}/(\rho _{A,in}+\rho _{B,in})$) and contact angle ( $\theta$), where the index A is for the vapour and B for the air component. Simulation results reproduced the typical transition from the CRP at large S to the RFP at small S, with an intermediate FRP in between. We have developed a scaling relation to predict the average evaporation rate in CRP,
 \begin{equation} E{R_{CRP}} = {k_3}\ln \left( {1 + {B_Y}} \right) \boldsymbol{\cdot} \left[ {\ln \left( {1 + {{Re}}} \right) + {k_2}} \right] \boldsymbol{\cdot} \left[ {\cos (\theta ) + {k_1}} \right]\!, \end{equation}
where  $B_Y$ is a vapour concentration-based mass transfer number, and $k_1$ and $k_2$ are used to estimate the evaporation rate at $\theta = {90^\circ }$ and ${Re=0}$, respectively. The parameters in the three brackets are dimensionless, and the global scaling parameter $k_3$ has units of the evaporation rate and includes the effects of the binary diffusion, the surface tension and the porous geometry. The scaling unifies the effects of three key factors on the CRP, namely diffusion from the porous media to the atmosphere, convection which carries away the evaporation-generated vapour and capillary pumping supplying liquid to the evaporation front, as represented by the three bracket terms, respectively. The model has been well validated for isothermal drying of porous media with a laminar inflow blowing over the material surface (Fei et al. Reference Fei, Qin, Zhao, Derome and Carmeliet2023). Accordingly, one can increase the evaporation rate by increasing the inlet velocity ( $Re$) and decreasing the vapour concentration of the incoming air $Y_{vapour,in}$ and the contact angle $\theta$, but the evaporation rate plateaus at large $Re$ and small $Y_{vapour,in}$ and $\theta$. The present work aims to explore the possibility to further increase the evaporation rate by incorporating heterogeneity in the porous medium, and therefore we start from the maximum evaporation rate achieved before by setting $Re=100$, $Y_{vapour,in}=0.1$ and $\theta =15^\circ$.
4. Results and analysis
4.1. Effects of heterogeneous contact angle distribution
We first probe the effect of heterogeneous contact angle on the evaporation process in PM1. To this aim, the porous medium is divided into two equal parts horizontally, with different contact angles at the top ( $\theta _{top}$) and bottom ( $\theta _{bottom}$). We decrease the contact angle difference $(\theta _{top}-\theta _{bottom})$ from $90^\circ$ to $-90^\circ$ gradually with a fixed interval of $30^\circ$, starting from $\theta _{top}=105^\circ$ and $\theta _{bottom}=15^\circ$ and ending at $\theta _{top}=15^\circ$ and $\theta _{bottom}=105^\circ$, for a total of seven pairs of contact angle. Snapshots of the convective evaporation processes for four of these cases are shown in figure 2 (see also in Supplementary movies 1–4). For each case, the evaporation front (highlighted by the solid black line) recedes first in the middle region and later in the side regions. As discussed previously (Fei et al. Reference Fei, Qin, Zhao, Derome and Carmeliet2022), such a pattern is directly attributed to the capillary pumping effect. According to the Laplace law, capillary pressure ${p_c} = \gamma \cos (\theta )/r$, with $\gamma$ the surface tension and $r$ the local pore size, is lower in the middle large pores than that in the smaller side pores. Therefore, since the top surface is open to the channel with constant gas pressure $p_g$, the liquid pressure $p_l$ is higher in the middle larger pores than in side smaller pores, leading to a capillary pumping flow from the middle section to the sides, maintaining the liquid–vapour interfacial area in smaller pores at the material surface for some time depending on the strength of the capillary pumping. For the case with $\theta _{top}=45^\circ$ and $\theta _{bottom}=15^\circ$, when the evaporation front in the middle reaches the boundary between the top and bottom parts ( $t=5\times 10^5$), the front also starts to recede in the side regions, as shown in figure 2(a). For the case with uniform contact angle ( $(\theta _{top}=\theta _{bottom}) =15^\circ$) in figure 2(b), the evaporation front in the side regions starts to recede only when the evaporation front in the middle touches the bottom of the porous medium. For cases with a larger contact angle in the bottom part than in the top part (figure 2c,d), the initial evaporation dynamics are basically the same as in case (figure 2b) while differences appear when the middle evaporation front arrives at the boundary between the top and bottom part at $t=5\times 10^5$. The evaporation front in these last two cases penetrates and spreads very fast in the bottom part, pumping liquid to the small pores in the top side regions. As a result, the side-region liquid–vapour interface remains pinned still at $t=1\times 10^6$ in figure 2(c). In figure 2(d), we see a similar but even faster spreading behaviour in the bottom part, leading to the break of the connection between the top and bottom drying front at $t=1\times 10^6$. The top small side pores cannot be supplied with liquid anymore, and therefore the evaporation front recedes from the top surface.

Figure 2. Snapshots of convective evaporation in PM1 with contact angles in the top ( $\theta _{top}$) and bottom ( $\theta _{bottom}$) parts given as (a) $\theta _{top}=45^\circ$ and $\theta _{bottom}=15^\circ$; (b) $\theta _{top}=15^\circ$ and $\theta _{bottom}=15^\circ$; (c) $\theta _{top}=15^\circ$ and $\theta _{bottom}=45^\circ$; (d) $\theta _{top}=15^\circ$ and $\theta _{bottom}=105^\circ$. The liquid–vapour interface is highlighted with a black line. The green dash borderline indicates the transition from CRP to RFP, characterized by the receding of evaporation fronts in the side regions of the top layer. The two legends show the contact angle and vapour concentration distributions, respectively, and are shared by all the frames. Full evaporation process documented in Supplementary movies 1–4 available at https://doi.org/10.1017/jfm.2024.138.
The evaporation behaviour in the initial stage is similar in figure 2(b–d) and the main differences appear onwards, after the evaporation breaks through the border between the two top and bottom parts. Benefiting from the present model at the pore scale, we can conduct detailed analysis of the underlying mechanisms based on studying the instantaneous dynamics of water front progress at the pore scale. Figure 3 shows that the location of the evaporation front just before arriving at the border (denoted by the red curves) is the same for four cases with the same  $\theta _{top}$ but different $\theta _{bottom}$. The black streamlines confirm the occurrence of capillary pumping in the liquid phase, as we explained above. After that, the evaporation front continues to recede in the middle large pores (shown by the red arrows) but remains pinned at the small pores for the uniform contact angle case (figure 3a), indicating the evaporation rate is compensated by the pumping rate. For other cases, the evaporation front recedes faster in the middle, especially for the larger $\theta _{bottom}$ case, as shown in figure 3(b–d). The underlying mechanisms can be elucidated based on the analysis of the liquid pressure difference between the large pores and small pores at the two moments just before and after crossing the border (indicated by subscripts $-$ and +),
 \begin{equation} \left. \begin{gathered} \Delta {p_ - } = \gamma \left[ {\frac{{\cos ({\theta _{top}})}}{{{r_s}}} - \frac{{\cos ({\theta _{top}})}}{{{r_m}}}} \right]\!,\\ \Delta {p_ + } = \gamma \left[ {\frac{{\cos ({\theta _{top}})}}{{{r_s}}} - \frac{{\cos ({\theta _{bottom}})}}{{{r_m}}}} \right]\!, \end{gathered} \right\} \end{equation}
where subscript s and m represent the side and middle regions, respectively. From these values, we observe that  $(\theta _{top}\neq \theta _{bottom})$ leads to a capillary pressure jump (also pressure difference jump) between the two moments. For a larger $\theta _{bottom}$ case, the jump is more significant, resulting in the evaporation front receding faster in the middle region. Concurrently, the evaporation fronts in the side regions are refilled (advancing), as indicated by the green arrows in figure 3(b–d), showing that the pumping rate is now stronger than the evaporation rate. The advancing behaviour at the top side interfaces is more significant for a larger $\theta _{bottom}$ case (larger $\Delta {p_ + }-\Delta {p_ - }$), and, notably, is absent at $\theta _{top}=\theta _{bottom}$ ( $\Delta {p_ + }-\Delta {p_ - }=0$).

Figure 3. Pore-scale dynamics immediately before (red interface line) and after (green interface line) the evaporation front arrives at the border between the top and bottom part of PM1: (a)  $(\theta _{top}=\theta _{bottom}) =15^\circ$; (b) $\theta _{top}=15^\circ$ and $\theta _{bottom}=45^\circ$; (c) $\theta _{top}=15^\circ$ and $\theta _{bottom}=75^\circ$; (d) $\theta _{top}=15^\circ$ and $\theta _{bottom}=105^\circ$. The two evaporation fronts are indicated by the solid red and green lines, respectively. The red arrows denote receding events (from red to green), and the green arrows underline advancing events (from green to red). Black lines are streamlines concurrent with the red interface.
The presence of liquid at the top of the porous medium ensures effective evaporation, and the point of receding from the top surface is thus critical to characterizing the drying process. The red and green solid lines in figure 4 show the evaporation front locations at the moments slightly before and after the onset of receding from top surface. The corresponding degrees of saturation ( $S$) are also given in each frame, and the transition occurs at S equal to 0.61, 0.47, 0.45 and 0.56 for figure 4(a–d), respectively. This transition $S$ decreases with increasing $\theta _{bottom}$, due to the increase of the pressure difference between the bottom middle region and the top side regions according to (4.1). However, when $\theta _{bottom}$ is further increased to $105^\circ$, a hydrophobic case, the transition $S$ increases again to 0.56, rather than further decreasing. Looking at the bottom of the interfaces, the evaporation front in figure 4(d) is flat compared with the other cases. Such a pattern has also been observed previously, which is due to the competing effect between the larger liquid pressure in smaller pores (negative capillary pressure due to $\theta > {90^ \circ }$) and larger vapour permeability in larger pores (Fei et al. Reference Fei, Qin, Zhao, Derome and Carmeliet2023). As a result, the connection between the top and bottom is broken earlier, and the liquid cannot be pumped anymore from bottom to top, shortening the time at which receding occurs in figure 4(d). An almost constant drying rate, the essential feature of CRP, is observed when the small pores remain filled. Thus, the CRP is maintained by sufficient capillary pumping flow from the larger to the smaller pores. Based on the observations at the pore scale of figure 4, the transition from CRP to FRP can be defined as the moment when one of the small pores at the top surface dries out, as highlighted by the dashed black boxes in figure 4. We would like to mention that such a definition generally coincides with the point in time that the drying rate starts to drop.

Figure 4. Evaporation front locations at the moment slightly before (red line) and after (green line) the transition from CRP to FRP in PM1 with (a)  $(\theta _{top}=\theta _{bottom}) =15^\circ$; (b) $\theta _{top}=15^\circ$ and $\theta _{bottom}=45^\circ$; (c) $\theta _{top}=15^\circ$ and $\theta _{bottom}=75^\circ$; (d) $\theta _{top}=15^\circ$ and $\theta _{bottom}=105^\circ$. The corresponding degrees of saturation are also given in red and green.
We now consider the global evaporation behaviour. Figure 5(a) gives the time evolution of the residual liquid mass ( $= \sum {{\rho _A}}$, where $\sum$ runs over grid nodes with ${\rho _A} > (\rho _l^s + \rho _v^s)/2$) for the different cases, while figure 5(b) gives the drying curves (drying rate versus saturation S). It is seen in figure 5(a) that the residual liquid mass for most of the cases (except for $\theta _{top}=105^\circ$) drops faster in the beginning but slower in the later stage. Such a change in slope indicates the transition from CRP to FRP. With decreasing $\theta _{top}$ and increasing $\theta _{bottom}$, the residual liquid mass is almost always lower at any given time, indicating faster evaporation during CRP. One exception is case $\theta _{bottom}=105^\circ$, where the residual liquid mass surpasses the one of case $\theta _{bottom}=75^\circ$ after $t=8\times 10^5$, due to the disconnection of liquid filled regions between the top and bottom parts as discussed above. As further confirmed in figure 5(b), for most of the cases, we indeed observe a transition from a relatively high (and constant for some cases) evaporation rate at large $S$ to a low evaporation rate at small $S$. For the case $\theta _{top}=105^\circ$, as discussed previously, the evaporation front is very flat and recedes almost simultaneously in both middle and side regions. The evaporation rate is therefore always falling, without experiencing CRP. The transition (from CRP to FRP) $S$ for each case is marked by a black-filled symbol. It is seen that by decreasing $\theta _{top}$ and increasing $\theta _{bottom}$, the CRP can be prolonged from $S>0.72$ to $S>0.42$. The four cases with $\theta _{top}=15^\circ$ behave exactly the same until $S=0.83$, indicated by the black arrow in figure 5(b) (corresponding to the red lines in figure 3), after which the capillary pressure jump happens immediately at $\theta _{bottom}>\theta _{top}$, as discussed above. The stronger pumping effect at the next moment leads to an increase in the evaporation rate, especially for the case with high $\theta _{bottom}$.

Figure 5. (a) Time evolution of the residual liquid mass for PM1 cases with heterogeneous contact angle distribution. (b) Evaporation rate versus S curves for each case.
In addition, we want to note that the Laplace equation is strictly valid only under hydrostatic conditions, while it is still widely used to study the multiphase flows in porous media dominated by the capillary force (Qin et al. Reference Qin, Del Carro, Mazloomi Moqaddam, Kang, Brunschwiler, Derome and Carmeliet2019; Gu, Liu & Wu Reference Gu, Liu and Wu2021; Fei et al. Reference Fei, Qin, Zhao, Derome and Carmeliet2023). For our cases, the capillary number can be defined as  $Ca = \nu {\rho _l}\bar u/\gamma$, where $\gamma = 0.083$ and the pore scale liquid-phase average velocity $\bar u$ can be estimated as $\bar u = E{R_{CRP}}/({\rho _l}{l_p}{n_p})$, using the middle part pore size ${l_p} = 19\Delta x$ (PM1) and number of pores in the middle ${n_p} = 7$. For an average CRP evaporation rate $E{R_{CRP}} = 0.5$ in figure 5, we have $\bar u = 5.8 \times {10^{ - 4}}$ and $Ca = 1.8 \times {10^{ - 3}}$. Therefore, our cases are generally in the capillary force dominant regime.
4.2. Effects of heterogeneous pore size distribution
In this subsection, we study the effect of heterogeneous pore size distribution on the evaporation in porous media. To do this, we consider convective evaporation in porous media with heterogeneous pore structures (PM2–4 in figure 1). The time evolution of the liquid distribution for each case is shown in figure 6(a–c), respectively (see also Supplementary movies 5, 6 and 7). For all cases, the evaporation front recedes first in the middle region, due to the strong capillary pumping effect in the hydrophilic case, and then in the side regions. For the vertically uniform pore structure, the evaporation front in the small pores starts to recede approximately when the interface reaches the bottom surface at  $t=1.0\times 10^6$ in figure 6(a). For the case with larger pores in the bottom part, the evaporation front in the bottom part expands more significantly, showing a pumping flow from the bottom part to the top at $t=1.0\times 10^6$ in figure 6(b). This expansion finally results in breaking the connection between the bottom and top liquid-filled parts ( $t=2.0\times 10^6$), after which the front recedes in the small pores. In contrast, the penetration front expands more within the top region in the case of PM4, as seen at $t=5.0\times 10^5$ in figure 6(c). The front starts to recede immediately after the top middle pores are dried out, not penetrating through the middle part ( $t=1.0\times 10^6$).

Figure 6. (a) Snapshots during convective evaporation in heterogeneous porous media with uniform contact angle  $\theta =15^\circ$: (a) vertically uniform pores (PM2); (b) larger pores in the bottom part (PM3); (c) smaller pores in the bottom part (PM4). The full evaporation process is seen in Supplementary movies 5–7. The legend gives vapour concentration levels.
The different evaporation behaviours for different pore size distributions can also be rationalized based on the analysis of the pore-scale dynamics when the drying front reaches a change of pore size. As shown in figure 7, the pumping flow from larger pores to smaller pores is observed in both PM3 and PM4. The main difference lies in the receding/advancing behaviour, which can be analysed by determining the liquid pressure difference between the large and small pores at the two moments just before and after crossing the border (indicated by subscripts  $-$ and +),
 \begin{equation} \left. \begin{gathered} \Delta {p_ - } = \gamma \left[ {\frac{{\cos (\theta )}}{{{r_{s,top}}}} - \frac{{\cos (\theta )}}{{{r_{m,top}}}}} \right]\!,\\ \Delta {p_ + } = \gamma \left[ {\frac{{\cos (\theta )}}{{{r_{s,top}}}} - \frac{{\cos (\theta )}}{{{r_{m,bottm}}}}} \right]\!. \end{gathered} \right\} \end{equation}
For the case with larger pores in the bottom part ( ${r_{m,bottom}} > {r_{m,top}}$), the liquid pressure in the middle pores increases when the front crosses the border between the two parts. Here $\Delta p$ experiences a positive jump, leading to the front fast penetrating into the bottom part, as indicated by the red arrows in figure 7(a). At the same time, the capillary pumping results in an advancing of the interfaces in the small pores (indicated by the green arrows) since the flow due to capillary pumping is locally stronger than the drying flow. For the case with smaller pores in the bottom part ( ${r_{m,bottom}} < {r_{m,top}}$), $\Delta p$ experiences a negative jump, therefore the penetration of the front into the bottom part in the middle is less significant, as seen in figure 7(b). The decrease in capillary pressure cannot balance the local drying rate, leading to a slight receding of the front in the top side pores, as also indicated by the red arrows.

Figure 7. Pore-scale dynamics immediately before (red interface line) and after (green interface line) the evaporation front arrives at the border between the top and bottom part in cases with: (a) larger pores in the bottom part (PM3); (b) smaller pores in the bottom part (PM4). Red/green arrows show the local receding/advancing of the front. Black lines are streamlines concurrent with the red interface. The legend gives the range of disk sizes for all frames.
We now study the effects of heterogeneous pore size distribution on the duration of CRP. To be consistent, we also define the transition from CRP to FRP as the moment when one of the side pores at the surface channel dries out as documented at the pore scale. In effect, for the porous medium with larger pores in the bottom part, we see a pumping flow from the bottom part to the top part after the evaporation front enters the bottom part (seen in Supplementary movie 6), which is beneficial for prolonging the CRP. In the meantime, the evaporation front also expands horizontally, leading to a disconnection of the two parts at  $S = 0.422$ and the transition to FRP afterwards, as seen in figure 8(a). The saturation degree at the onset of transition is decreased to $S = 0.413$, compared with $S \approx 0.62$ for the vertically uniform pore size case (shown below). As indicated in (4.2), for the case with smaller pores in the bottom part (PM4), the liquid pressure in the middle pores decreases when the front crosses the border between the two parts. When the front touches the bottom part of the porous medium, capillary pumping slows down importantly, and the transition to FRP happens at a high saturation $S=0.667$, as shown in figure 8(b).

Figure 8. Location of the evaporation fronts at the moment slightly before (red line) and after (green line) the start of FRP. (a) Larger pores in the bottom part (PM3); (b) smaller pores in the bottom part (PM4).
In terms of global evaporation behaviour, the residual liquid mass versus time curves for each case are shown in figure 9(a), together with the drying curves in figure 9(b). For all cases, we can see a clear phase transition, a fast evaporation stage in the beginning, followed by a slow evaporation stage at the end, experiencing different evaporation periods. The case with larger pores in the bottom part (PM3) shows the highest evaporation efficiency among the three, consistent with the previous pore-network study of evaporation in bilayered porous media (Pillai et al. Reference Pillai, Prat and Marcoux2009). In contrast, at the very beginning, PM4 dries very fast due to its high porosity in the top part, as seen in figure 9(b). Afterwards, the drying rate decreases due to the weakened pumping effect when the evaporation front penetrates from the top (red arrow) to the bottom part (green arrow). For PM3, the evaporation rate increases suddenly (from the point indicated by the red arrow to that indicated by the green arrow), because the pumping effect is enhanced when the front enters the larger pores in the bottom part. Afterwards, the evaporation rate in PM3 remains the fastest among the three.

Figure 9. (a) Time evolution of the residual liquid mass for evaporation in heterogeneous porous media with uniform pores (PM2), larger pores in bottom (PM3) and smaller pores in bottom (PM4). (b) Drying rate versus  $S$ for each case. The red and green arrows correspond to the moments represented by red and green fronts in figure 7, respectively, and the black symbols indicate the transition from CRP to FRP.
4.3. Combining contact angle and pore size heterogeneity with multiple layers
To this point, we discussed the evaporation in porous media with heterogeneity in either contact angle or pore size distribution. We found that, for a vertically two-layer porous medium, installing a layer with a larger pore size or contact angle in the bottom part is beneficial for extending the duration of CRP, as well as improving global drying efficiency, i.e. faster reaching lower degrees of saturation. We consider next whether the drying behaviour can still be improved by combining the two types of heterogeneity and by providing additional layers. Figure 10 shows snapshots for four cases: evaporation in three-layer and four-layer porous media (PM5 and PM6, as detailed in figure 1) both with uniform and heterogeneous contact angle distribution. Taking the case PM3 with uniform contact angle ( $\theta =15^\circ$) and two layers with larger pores in the bottom part as references (see figure 6b), evaporation in PM5 (three layers, uniform contact angle with downwards increasing pore sizes) is faster compared with in PM3, as evidenced at $t=5\times 10^5$ where the evaporation front has almost penetrated through the middle region in figure 10(a). The evaporation front also expands faster horizontally in PM5. For example, at $t=1\times 10^6$ the connection of the liquid phase on the left-hand side region is broken in figure 10(a) but not yet in figure 6(b). Comparing the three-layer PM5 with uniform contact angle (figure 10a) with PM5 with increasing contact angle to the bottom (figure 10b), or to the four-layer PM6 with uniform contact angle (figure 10c), we note that the evaporation front expands faster from $t=5\times 10^5$ to $t=2\times 10^6$ in the last two cases, thus showing quicker drying. Thus, increasing contact angles ( $\theta _1=15^\circ$, $\theta _2=45^\circ$ and $\theta _3=75^\circ$, figure 10b) or increasing the numbers of layers with downwards increasing pore sizes (figure 10c) improve the drying process. At $t=4\times 10^6$, the latter two cases (figure 10b,c) are completely dry, while some isolated liquid islands are still seen in the former. Finally, the four-layer PM6 with downwards increasing contact angles ( $\theta _1=15^\circ$, $\theta _2=45^\circ$, $\theta _3=75^\circ$ and $\theta _4=105^\circ$), as shown in figure 10(d), displays the effect of an even more robust drying strategy. The evaporation process experiences two well-organized stages (also seen in Supplementary movie 11): (i) the evaporation front first penetrates through the middle region in a short time reaching the bottom at $t=3\times 10^5$, as shown in figure 11; (ii) the liquid interface then expands fast horizontally into the bottom parts to then move upward layer by layer. As a result, it only takes around $t=2\times 10^6$ to almost dry out the system, which is the fastest duration among the four cases.

Figure 10. Snapshots during convective evaporation in porous media with heterogeneous contact angle and pore size distribution: (a) PM5 with uniform contact angle; (b) PM5 with different contact angles in each layer ( $\theta _1=15^\circ$, $\theta _2=45^\circ$ and $\theta _3=75^\circ$, from top to bottom, respectively); (c) PM6 with uniform contact angle; (d) PM6 with different contact angles in each layer ( $\theta _1=15^\circ$, $\theta _2=45^\circ$, $\theta _3=75^\circ$ and $\theta _4=105^\circ$). The full evaporation process is documented in Supplementary movies 8–11. Legend gives contact angle and vapour concentration distributions for all frames.

Figure 11. (a) Pore-scale dynamics at the four times ( $t=1\times 10^5$, $1.5\times 10^5$, $2\times 10^5$ and $3\times 10^5$) during the drying in PM6 with heterogeneous contact angle distribution. Front locations marked in sequential order in red, green, blue and pink. (b) Vapour boundary layer (defined at the location $Y_{vapour}=0.5$) at the four times and two subsequent times.
To understand the mechanisms of evaporation rate enhancement in the four-layer PM6 with increasing pore size and contact angle to the bottom, we analyse the local pore-scale dynamics at four representative times, as shown in figure 11(a). From  $t=1\times 10^5$ to $3\times 10^5$, the system experiences multiple capillary pressure jumps, from layer n to layer $n+1~(n=1, 2, 3)$, respectively. Since the side pores are still filled at the top, where the contact angle is denoted $\theta _1$, the liquid pressure difference between the middle pores and the side pores (by subscripts m and s), before and after each jump (by subscripts $-$ and +), can be determined as
 \begin{equation} \left. \begin{gathered} \Delta {p_ - } = \gamma \left[ {\frac{{\cos ({\theta _1})}}{{{r_{s,1}}}} - \frac{{\cos ({\theta _n})}}{{{r_{m,n}}}}} \right]\!,\\ \Delta {p_ + } = \gamma \left[ {\frac{{\cos ({\theta _1})}}{{{r_{s,1}}}} - \frac{{\cos ({\theta _{n + 1}})}}{{{r_{m,n + 1}}}}} \right]\!. \end{gathered} \right\} \end{equation}
In the considered case, where  ${\theta _{n + 1}} > {\theta _n}$ and ${r_{m,n + 1}} > {r_{m,n}}$, the liquid pressure difference induces cascaded positive jumps. Each jump results in a further invasion in the middle region, leading to a fast penetration through the porous media within a short time ( $\Delta t = 3 \times {10^5}$), indicated by the big red arrow in the middle region. In the meantime, the increasing pumping effect is not balanced by the evaporation process, and therefore multiple refilling or interface advancing steps (denoted by the pink arrows) are observed in the small side pores. As a result, the evaporation rate increases step by step, leading to a successive thickening of the vapour boundary layer in the channel until $t = 3 \times {10^5}$, as shown in figure 11(b). Afterwards, the system relaxes, the drying rate decreases and the boundary layer thickness decreases gradually. Consistent with the previous results in figures 4(b–d) and 8(a), the transition from CRP to FRP occurs when the liquid supply to the top pores stops and a small pore at the surface dries out, as shown in figure 12. The significant difference between previous cases with only one type of heterogeneity and the cases of multilayer porous media with both downwards increasing contact angle and pore size distribution is that the transition occurs at a much lower degree of saturation in the latter cases. Especially for the four-layer PM6 with heterogeneous contact angle (figure 12b), the bottom two layers have been almost dried out at this moment, showing very high drying efficiency. The time evolution of the residual liquid mass for all cases is given in figure 13(a), which shows that the liquid mass drops faster in all four-layer PM6 cases than in any two-layer PM3 and three-layer PM5 cases. In figure 13(b), we also see much more prolonged CRPs for two-type heterogeneities than in previous single heterogeneity cases. The optimized case in four-layer PM6 with both types of heterogeneity extends the duration of CRP until $S\approx 0.17$, showing significant improvement compared with the reference PM1 case with uniform pore size and constant contact angle ${\theta } = {15^ \circ }$ (until $S \approx 0.61$), as seen in figure 2(b).

Figure 12. Evaporation front locations at the moments slightly before (red line) and after (green line) the start of FRP for evaporation in (a) three-layer PM5 with  $\theta _1=15^\circ$, $\theta _2=45^\circ$ and $\theta _3=75^\circ$ and (b) four-layer PM6 with $\theta _1=15^\circ$, $\theta _2=45^\circ$, $\theta _3=75^\circ$ and $\theta _4=105^\circ$.

Figure 13. (a) Time evolution of the residual liquid mass for evaporation in porous medium with heterogeneous contact angle and pore size distribution. (b) Evaporation rate versus  $S$ for all cases. Black symbols indicate the transition from CRP to FRP. Arrows correspond to the four moments shown in figure 11(a), respectively.
Up to now, the simulations have been limited to two dimensions, thus excluding 3-D effects. For example, a corner film can develop in an angular pore in three dimensions when the liquid contact angle is smaller than a critical value which provides a pathway for liquid transport and therefore affects the evaporation rate (Chauvet et al. Reference Chauvet, Duru, Geoffroy and Prat2009). To verify the applicability of the proposed strategy in more realistic porous media, some 3-D simulations are conducted. In three dimensions, the porous structures and pore distributions are essentially the same as those in figure 1, while the cylinders (discs) are now replaced by spheres and two layers of spheres with shifted locations in the  $x$–
$x$– $y$ plane are arranged in the z-direction. The z-direction is resolved by $64\Delta x$. The evaporation snapshots for three cases are shown in figure 14, supplied by the corresponding movies 12–14. From the movements of the liquid–vapour interfaces, we see the capillary pumping-induced evaporation pattern (i.e. from middle larger pores to side smaller pores) in the early stage for each case, which is also confirmed by the streamlines. At time $t = 1.0 \times {10^5}$, all three cases reach the degree of saturation $S \approx 0.9$, after which the evaporation is faster in the third case with four layers of downwards increasing pore sizes and contact angles, as seen in figure 14(c). Although with two layers of different pore sizes and contact angles, it takes almost the same time for figure 14(b) as figure 14(a) to reach $S \approx 0.7$, since the interface location has not completely moved to the boundary between the two layers. We see for figure 14(a) with uniform pore sizes and contact angles, the capillary pumping is not strong enough to supply sufficient liquid to smaller pores for a long time, and therefore the decrease of liquid mass slows down soon after and the evaporation rate decreases gradually, as also seen figure 15. For figure 14(b), after the interface in the middle recedes to the bottom part, it expands horizontally (from $t = 7.2 \times {10^5}$ to $t = 1.06 \times {10^6}$ in figure 14b), pumps the liquids to the top and therefore prolongs the CRP, as also evidenced in figure 15(b). A similar and more robust pattern is seen in figure 14(c), leading to an accelerated drop of liquid mass in figure 15(a) and a much-prolonged CRP in figure 15(b). All the observations in figures 14 and 15 confirm that in three dimensions, the evaporation in heterogeneous porous media with more layers of downward increasing pore sizes and contact angles show faster evaporation rate, fully consistent with 2-D cases.

Figure 14. Three-dimensional simulations of convective evaporation in porous media with heterogeneous contact angle and pore size distribution: (a) Uniform (vertically) pore size with uniform contact angle; (b) two-layer pore sizes with  ${\theta _1} = {15^ \circ }$ and ${\theta _2} = {45^ \circ }$; (c) four-layer pore sizes with ${\theta _1} = {15^ \circ }$, ${\theta _2} = {45^ \circ }$, ${\theta _3} = {75^ \circ }$ and ${\theta _4} = {105^ \circ }$. Panels (ai,bi,ci), (aii,bii,cii), (aiii,biii,ciii), (aiv,biv,civ) and (av,bv,cv) show snapshots at the degree of the liquid saturation $S \approx 0.9$, 0.7, 0.5, 0.3 and 0.05, respectively. The full evaporation process is documented in Supplementary movies 12–14.

Figure 15. Three-dimensional simulations of convective evaporation in porous media with heterogeneous contact angle and pore size distribution: (a) time evolution of the residual liquid mass and (b) evaporation rate versus  $S$.
$S$.
To quantify the effect of heterogeneity on the global evaporation rate, we introduce the time ratio (or speed-up factor)  ${t_{ref}}(S)/t(S)$, where ${t_{ref}}(S)$ and $t(S)$ are the time needed to reach a given value of S for the reference case (evaporation in PM1 with uniform contact angle of ${\theta } = {15^ \circ }$) and the considered case, respectively. Figure 16(a) shows time ratio curves for all cases in two dimensions (except PM4 which showed no improvement in the drying process) from $S = 0.5$ to 0, which is the second part of the drying process. In the early stages of evaporation (large S), the effects of heterogeneities do not play a significant role. For example, even at $S=0.5$, the speed-up ratio for all the cases is below 1.7. With decreasing S, the speed-up ratio increases gradually for cases with single heterogeneity in contact angle or pore size distribution, but significantly for cases with both types of heterogeneity. Since the complete drying takes a very long time for the reference case, we only run all cases until $S=0.05$ (drying out 95 % of liquid), which already meets the requirement in many actual applications. Among all the cases considered so far, for drying out 95 % of the liquid in the saturated porous media, the most efficient case could achieve a speed-up factor of 3.95. For 3-D cases, the time ratio curves follow the same trends as in two dimensions, as seen in figure 16(b). Compared with the reference case, the optimized case speeds up the evaporation by 3.0 times, slightly smaller than that in two dimensions, which is mainly attributed to the fact that to keep the distances among spheres, the porosity has been increased to 0.76 in three-dimensions, resulting in faster evaporation rate for all the cases. In addition, the liquid films in the 3-D pore structures also slightly affect the evaporation.

Figure 16. Ratio between the time needed for the reference case to reach a certain S over the time needed for other cases to reach the same S for different cases: (a) 2-D simulations and (b) 3-D simulations.
4.4. Larger systems
Until this point, the studied system size is  $L \times H = 481\Delta x \times 401\Delta x$. With the aim to verify whether heterogeneity affects drying similarly in larger systems, we design similar porous media with the same porosity as before but the system height H is increased from 401 $\Delta x$ to 492 $\Delta x$. We consider three cases: with vertically uniform pore sizes, as well as downwards increasing pore sizes (with three layers and five layers). The evaporation snapshots in the five-layer porous medium with contact angles ( $\theta _1=15^\circ$, $\theta _2=45^\circ$, $\theta _3=75^\circ$, $\theta _4=105^\circ$ and $\theta _5=135^\circ$, from top to bottom) are shown in figure 17 (see also in Supplementary movie 15). The evaporation front in the middle moves down so fast that the complete penetration happens before $t = 5 \times {10^5}$. The interface then expands horizontally and moves back to the top, layer by layer, by $t = 1.5 \times {10^6}$. Finally, the front recedes in the side small pores and drying is almost complete at $t = 2.0 \times {10^6}$. The entire evaporation process is very similar to the one of PM6 shown in figure 10(d).

Figure 17. Snapshots during convective evaporation in a larger five-layer porous medium, with downwards increasing pore sizes and contact angles ( $\theta _1=15^\circ$, $\theta _2=45^\circ$, $\theta _3=75^\circ$, $\theta _4=105^\circ$ and $\theta _5=135^\circ$, respectively). Legends give contact angle and vapour concentration colour distributions for all frames.
The pore-scale dynamics at five typical moments, corresponding to the capillary jumps from layer n to layer  $n+1$ ( $n=1, 2, 3, 4$), are shown in figure 18(a). The evaporation front recedes in the middle large pores very fast from $t = 1 \times {10^5}$ to $4.5 \times {10^5}$, as indicated by the red arrow. In the meantime, the side pores are refilled gradually (indicated by the pink arrows). Such pore-scale dynamics can also be explained by analysing the liquid pressure differences in (4.3). As a result, the evaporation rate is increased step by step, corresponding to the five points indicated by the arrows in figure 19(b), and the vapour boundary layer experiences successive thickening until $t = 4.5 \times {10^5}$ as shown in figure 18(b). Afterwards, the liquid pressure difference cannot increase anymore, and the evaporation rate drops gradually. Accordingly, the boundary layer thickness decreases. In the time evolution of the residual liquid mass curves shown in figure 19(a), all cases experience a fast evaporation period (CRP) in the beginning, followed by a slower evaporation period. For the reference case, although the pore structures are essentially the same as PM1 shown in figure 1(a), the larger system here shortens the duration of CRP from $S \in [0.61,1.0]$ to $S \in [0.64,1.0]$, because when the evaporation front penetrates deeply in the middle region, the capillary pumping is not strong enough anymore to compensate the drying out of the surface smaller pores and the front starts to recede in the side pores. With more and more layers of heterogeneous contact angle and pore size distribution, the CRP can be prolonged more and more, as seen in figure 19(b). For the optimized case shown in figure 17, the duration of CRP is extended to $S \in [0.12,1.0]$.

Figure 18. Pore-scale dynamics at the five moments ( $t = 1 \times {10^5}$, $1.5 \times {10^5}$, $2.5 \times {10^5}$, $3 \times {10^5}$ and $4.5 \times {10^5}$; the front locations are marked in red, green, cyan, blue and pink, respectively) for the evaporation case in figure 15. (b) Vapour boundary layer at the five moments corresponding to (a) and the following moment.

Figure 19. (a) Time evolution of the residual liquid mass for evaporation in larger systems; (b) evaporation rate versus  $S$ for all cases. Black symbols indicate the transition from CRP to FRP. Arrows correspond to the five times shown in figure 18(a).
We then consider the time ratio, i.e. the ratio between the time needed for the reference case over the time for the considered case for reaching a given saturation, as plotted in figure 20. As done above, we consider the range  $S \in [0.0.05,0.5]$ because at large S the speed-up is not significant and at small S it takes too long to completely dry out the reference case (more than ten million steps). Nevertheless, we see the speed-up ratio increases with decreasing S, and nonlinearly for the cases with five layers of heterogeneous pores. For drying out 95 % of the liquid in the saturated porous medium, the optimized case achieves a speed-up ratio of over five, which is even more significant than the results in the four-layer systems. The above results allow us to verify that the strategy is not only robust for larger multilayer systems but also yields an even more effective drying.

Figure 20. Time ratio of evaporation for larger systems compared with the reference case for reaching different degrees of saturation.
4.5. Smooth transition of pore size
In the previous cases, the sizes of the solid disks (and also the pore sizes) change spatially in a stepwise manner. One question comes to mind: What will happen in the case with a smooth transition of the solid phase radius? To this aim, we design a new porous medium by filling cylindrical disks in the rectangular region with gradually decreasing radii from the top to the bottom, as shown in figure 21. The typical evaporation dynamics for six cases are shown in figure 22. For all the cases, the contact angle on the top is fixed to be  $\theta =15^\circ$. The system is divided vertically into different layers with downwards increasing contact angles layer by layer, including one layer (or uniform contact angle case L1, in figure 22a) and three layers (L3, figure 22b,c), six layers (L6, in figure 22d) and 12 layers (L12, in figure 22e,f). Generally, the evaporation patterns seen before are also observed in the present porous medium with a smooth transition of pore sizes, in the sense that the evaporation front penetrates in a big pore in the middle (marked by the red interface), expands in the bottom (green interface) and then moves upward layer by layer (cyan, blue and pink interfaces). The global evaporation rate can be increased by increasing the layer numbers (e.g. figure 22a versus figure 22b) and increasing the contact angle difference between layers (e.g. figure 22e versus figure 22f), as evidenced by the residual liquid phase at $1.25 \times {10^6}$. One exception is figure 22(c), in which the evaporation front expands so fast from $t=5.0 \times {10^5}$ to $7.5 \times {10^5}$ that the liquid phase connection between the bottom part and the top part is cut off, leading to a smaller evaporation rate whereafter compared with evaporation in L3 with a smaller contact angle difference in figure 22(b). Such a phenomenon is essentially the same as that in figure 2(d), indicating that there is a threshold of contact angle difference between layers above which the evaporation rate could not be increased any more. With the fixed contact angle in the bottom layer ( ${\theta _{max }}=95^\circ$), such a problem could be effectively overcome by increasing the layer numbers, as shown in figure 22(d,e). It is expected that a similar diminishing return also exists for increasing pore size cases. A further study of its underlying mechanisms and the development of a general criterion for its appearance would not only deepen the theoretical understanding of the process but also offer practical guidance for future experimental studies and real-world applications. Nevertheless, it is out of the scope of the present work and will be studied in the future.

Figure 21. A porous medium with gradually increasing pore sizes from the top to the bottom. Legend is for the size of the radius of solid discs. More specifically, in the top layer, the larger side discs and smaller middle discs have  ${R_l} = 14\Delta x$ and ${R_s} = 11.5\Delta x$, respectively. The disk sizes decrease downward layer by layer with an equal interval $\Delta R = 0.5\Delta x$ until ${R_l} = 8.5\Delta x$ and ${R_s} = 6\Delta x$ in the bottom layer, leading to a consistent porosity with the porous media in figure 1.

Figure 22. Pore-scale evaporation dynamics for six cases at the five moments ( $t = 2.5 \times {10^5}$, $5.0 \times {10^5}$, $7.5 \times {10^5}$, $1.0 \times {10^6}$ and $1.25 \times {10^6}$; the front locations are marked in red, green, cyan, blue and pink, respectively). (a) Uniform contact angle case with $\theta =15^\circ$. (b–f) Heterogeneous cases with different contact angle layers and fixed top layer contact angle $\theta =15^\circ$. The contact angle increases downward layer by layer with an equal interval for each case until ${\theta _{max }}$ in the bottom layer. Panels (b,c) are for three layers cases (L3) with ${\theta _{max }}=75^\circ$ and ${\theta _{max }}=95^\circ$, respectively. (d) Six layers case (L6) with ${\theta _{max }}=95^\circ$. (e,f) Twelve layers cases (L12) with ${\theta _{max }}=95^\circ$ and ${\theta _{max }}=125^\circ$, respectively. The liquid phase at the last moment in case (c) is filled in vivid red.
The evaporation curves for all the considered cases are shown in figure 23(a). It is clearly seen that a wide CRP extending to  $S > 0.38$ presents for the L1 case. For other cases with more layers, the CRP is prolonged, furthermore, with the increasing layer numbers and the bottom contact angle ( ${\theta _{max }}$). Accordingly, the evaporation rate in CRP is also increased. To be more quantitative, the speed-up ratio curves (defined as before) are plotted in figure 23(b). With the decrease of $S$, the speed-up ratio increases fast, especially for cases with more layers and larger ${\theta _{max }}$, following the trend in figure 16(a). The slow increase of the speed-up ratio and then decrease with decreasing $S$ for the case of L6 with ${\theta _{max }}=95^\circ$ is due to the stop of liquid supply, resulting from the break of the liquid connection, as discussed before.

Figure 23. (a) Evaporation rate versus  $S$ for all cases. (b) Time ratio of evaporation in the system with a smooth transition of pore size compared with the reference case for reaching different degrees of saturation.
5. Conclusions
In this work, the effect of spatial heterogeneity in contact angle and pore size distribution on the evaporation process in porous media is investigated based on extensive pore-scale LBM simulations combined with theoretical analysis. The motivation of the work comes from the dilemma (Fei et al. Reference Fei, Qin, Zhao, Derome and Carmeliet2023) that at a certain limit one cannot increase anymore the evaporation rate or reduce the evaporation time by increasing external air flow velocity or reducing the relative humidity. To further increase drying efficiency, new strategies are needed to prolong the duration of the first drying phase (CRP), for example, by means of the body force (Laurindo & Prat Reference Laurindo and Prat1998), temperature gradient (Panda et al. Reference Panda, Paliwal, Sourya, Kharaghani, Tsotsas and Surasani2020a) or configuration of pore structures (Qin et al. Reference Qin, Del Carro, Mazloomi Moqaddam, Kang, Brunschwiler, Derome and Carmeliet2019). Alternatively, we show that, by taking full advantage of introducing heterogeneity in wettability and pore size in the porous medium, the duration of CRP can be further extended, thus leading to a reduction in evaporation time.
We consider in general porous media with larger pore size in the middle, while the side parts show smaller pores, introducing a capillary pumping effect from large to small pores. We first consider the effect of spatial heterogeneous wettability by considering different contact angles in the top and bottom parts. When the contact angle in the top part is larger, the evaporation front penetrates fast in both the middle and side pores, leading to an early decrease in the evaporation rate. For a larger contact angle in the bottom part, the side pores are refilled when the evaporation front passes the boundary between the two parts. This phenomenon results in a local increase in the evaporation rate and prolongs the CRP. We then investigate the evaporation in a two-layer porous medium with different pore size distributions in the top and bottom parts. When the top part contains larger pores, the bottom smaller-pore layer will start drying after the top larger-pore layer is almost dried out, whereafter the evaporation rate decays. With smaller pores in the top layer, the evaporation front penetrates in the middle part, after which it expands horizontally in the bottom parts and pumps liquid to the top side part, leading to an increased evaporation rate. For the two considered heterogeneity types, the underlying mechanism of the increased evaporation rate is attributed to the capillary pressure jump at the interface of the two parts. Hereafter, when the drying front passes the interface, the evaporation rate decreases.
Furthermore, we investigate the evaporation in multilayer porous media combining different pore sizes and contact angle distribution. For the case with downwards increasing pore sizes and contact angles, the evaporation experiences two well-organized stages: (i) the evaporation front first penetrates through the middle region rapidly; (ii) the front then expands fast horizontally and moves back to the top, layer by layer. The multiple capillary pressure jumps in stage (i) lead to a cascaded refilling of the side pores and successive increase in evaporation rate. The strong capillary pumping effect in stage (ii) prolongs the duration of CRP significantly. It is shown that such an evaporation pattern is robust when further increasing the system size with more layers and even with a smooth transition of pore size. Compared with the reference case with uniform pores and contact angle, in the optimal case, the CRP can be prolonged from  $S > 0.64$ to reach the very low degree of saturation of $S > 0.12$ and achieve a speed-up of the drying process of over five times, when considering drying out 95 % of the initial water.
The present study paves the way for improved design of porous media. For example, the improved evaporation techniques can be applied to the design of artificial leaves that allow transpiration cooling through water uptake when integrated into artificial trees providing also shading (Jensen et al. Reference Jensen, Berg-Sørensen, Bruus, Holbrook, Liesche, Schulz, Zwieniecki and Bohr2016; Kubilay et al. Reference Kubilay, Allegrini, Strebel, Zhao, Derome and Carmeliet2020). The occurrence of capillary pumping and the successive capillary jumps elucidates the well-organized structures observed in this study, and provides paths of understanding and improvement of porous media. First, we would like to note that the proposed porous media with heterogeneous pores and wettabilities can be fabricated based on proven techniques, such as additive manufacturing and reactive-ion etching, but other possibilities should also be studied in detail. In the next step, prototypes of such porous media may be tested in the laboratory using microfluidic devices. Furthermore, the practical fabrication, durability and sustainability of such multilayer porous media have to be studied. Finally, with respect to urban heat mitigation during, for example, heatwaves, the evaporative cooling potential has to be studied by a non-isothermal LBM and tested in the laboratory, which is foreseen in future research.
In the present study, the simulations are mainly conducted in two dimensions, supplied with some 3-D simulations. For the 3-D cases, we consider a thin porous chip, filled with only two layers of solid spheres in the  $z$-direction. Since the evaporation process in porous media is slow, each considered case needs to run simulations up to millions of steps. Taking the reference 3-D case in § 4.3 as an example, our code (developed based on C++ and parallelized by the message passing interface) needs to run ${\sim }180$ hr with 432 processors ( ${\sim }2160$ node hr) in the Cray XC40 supercomputer at the Swiss National Super Computing Center. The cost will be further increased by an order of magnitude for simulating evaporation in a more realistic 3-D porous medium resolved by hundreds of lattices in each direction, which is computationally too demanding. To solve the problem, one strategy is using a coupled PNM and LBM scheme (Zhao et al. Reference Zhao, Qin, Kang, Derome and Carmeliet2022), where LBM is only used in the two-phase regions and the more efficient PNM is used in single liquid and gas phase regions. Another alternative is the quasi-3-D method (Liu et al. Reference Liu, Sun, Wu, Wei and Hou2021), which incorporates key 3-D effects into a 2-D LB model by means of source terms. Nevertheless, both strategies require essential extensions in the present model and will be another focus of future work.
Supplementary movies
Supplementary movies are available at https://doi.org/10.1017/jfm.2024.138.
Funding
This work was supported by the ETH Research Grant (project no. ETH-08 21-2) and the Swiss National Super Computing Center (project nos. s1081 and go09).
Declaration of interests
The authors report no conflict of interest.
Appendix. Smaller porosity case
We consider the same configuration as the main text but different porous media in this section. The porous medium domain has a size of  $L\times H =103\Delta x \times 192\Delta x$ and is filled with solid rectangular blocks, as sketched in figure 24. In the first porous medium (L1), the porous sizes are decreased slightly in the x direction to mimic the capillary pumping but uniform in the y direction. In the second and third one, the system is divided into two and four parts vertically (marked by L2 and L4, respectively), with downwards increasing pore sizes. The global porosity is approximately 0.59 for all three porous media.

Figure 24. Evaporation front locations at the moment slightly before (red line) and after (green line) the transition from CRP to FRP for three cases. (a) The pore size is uniformly distributed in the vertical direction (L1) and the contact angle case is uniform in the system  $\theta =15^\circ$. (b) The system is divided into two layers with smaller/lager pore sizes and contact angles ( $\theta _1=15^\circ$ and $\theta _2=35^\circ$) in the top/bottom. (c) The system is divided into four layers with downwards increasing pore sizes and contact angles ( $\theta _1=15^\circ$, $\theta _2=35^\circ$, $\theta _3=55^\circ$ and $\theta _4=75^\circ$, respectively).
Although the system is much smaller, the main evaporation pattern observed in the main text is also present. For example, the moments of transition from the CRP to FRP for three representative cases are also shown in figure 24. It is seen that the transition point is extended to a smaller degree of saturation with the increase of layer numbers and contact angle heterogeneities. The residual liquid mass versus time curves in figure 25(a) also confirm the appearance of evaporation period transition for all the cases. Taking the evaporation process in L1 with a uniform contact of  $\theta =15^\circ$ as the reference case, the speed-up factors for other cases are shown in figure 25(b). The trend of the curves, as well as the maximum achievable speed-up factor at $S=0.05$, is essentially consistent with the results reported in the main text.

Figure 25. (a) Time evolution of the residual liquid mass for evaporation in porous media with a porosity of 0.59 considered here. (b) Speed-up factors for all other cases compared with the reference case.


 Open access