


Impact Statement
This work aims to help democratize electricity distribution network analysis by developing an online tool to analyze the impacts of electric vehicles and other low-carbon technologies (LCTs) on distribution networks. The electric vehicle network analysis tool (EVENT) is accessed through a web browser at https://www.e4futuregrid.com/. It aims to be easy to use, with EVENT presenting digital representations of electricity networks; network simulation parameters, electricity demand and generation data; and options for LCT penetration levels. Users can also run analysis using their own datasets. It is hoped that the widest range of stakeholders, such as government policy makers, developers, network operators or innovators, could use EVENT to understand how actions to support a net zero energy ecosystem impact on electricity networks.
1. Introduction
Electricity networks are responsible for transferring electrical energy from electric generators to residential, commercial, and industrial end users. This ubiquitous network of pylons, cables, and other electric equipment is experiencing a fundamental change driven by the transition to a net zero economy. Conventionally, electricity is generated in a small number of controllable fossil-fueled plants connected at the high voltage level of the network, with electricity flowing in one direction from these generators to towns and cities (Figure 1). We are increasingly moving to several smaller, dispersed, and variable (i.e., weather-dependent) renewable energy generators such as solar panels and wind turbines that are connected at various voltage levels of the network. In addition, new devices such as electric vehicles (EVs) with large electricity demand and capabilities of two-way power flows are being connected to the grid.

Figure 1. Traditional electric power system.
The transition to net zero is introducing uncertainties in electricity generation and demand and creating unpredictable power flows at all levels of the network. Understanding how electricity networks are coping with this change is key to ensuring a successful transition to a net zero energy system. For example, installing EV charging infrastructure without considering possible future impact on electricity networks could lead to costly network reinforcement that might be required to ensure the new electricity demand can be met.
There is a gap between those with the data and capabilities to understand electricity networks such as network operators and those working on other parts of the energy transition jigsaw, such as EV charging infrastructure operators. Building electricity network models and simulating these networks under different scenarios of low carbon technology (LCT) uptake requires access to restricted datasets and domain-specific knowledge typically limited to electricity network operators, power systems researchers, and consultants. For example, digital representations of electricity networks are still not widely available, not least because a significant part of electricity distribution networks are buried underground, network topologies are updated via manual switching, and because historically networks have been neither instrumented nor well documented (Element Energy and EA Technology, 2022). Additionally, smart meter data is considered sensitive information, as it reveals information as to the behavior of an individual or household. Because of these privacy issues, there are often strict requirements for access and usage of smart meter data, adding an additional barrier for those wishing to simulate and understand how changing load profiles might affect distribution networks. For example, smart meter data used in the “Use Case” (Section 3) needed to be appropriately anonymized prior to sharing, following ICO (ICO, 2022) and GDPR (European Commission, 2020) guidelines.
The aim of this work is to make network analysis accessible to a wider range of stakeholders in the energy ecosystem who might not have the bandwidth to curate and integrate disparate datasets and code. This helps in providing insights on what could happen to electricity networks from the uptake of LCTs to inform choices on products and services being developed.
This paper describes the electric vehicle network analysis tool (EVENT), developed to help democratize electricity distribution network analysis by bringing together models, methods, and data to simulate the impact of LCTs on distribution networks. The tool has capabilities to run both user-defined and default demand and generation time series, to allow the user to explore with either existing representative profiles or arbitrary user-defined profiles. To enable further exploration of possible future impacts on networks, network parameters, and options for penetration levels of LCTs are also configurable by the user. For example, a user can choose between an urban or mixed urban–rural electricity network, then run simulations for several growth scenarios of LCTs (e.g., EV penetration levels of 50, 60, 70%, etc.). The results returned by EVENT indicate if the network has enough capacity to host more LCTs or if it has already reached its thermal and voltage limits.
EVENT is accessed through a web browser, available to everyone, from government policy makers to developers and innovators. It is easy to use, abstracting the complexities of electricity network analysis, and openly available to bring network analysis to a wider range of stakeholders and help them to link their work on the net zero energy transition to impact that may arise within electricity networks. Data visualizations allow for seamless interpretation of the complex system outputs.
Section 2 describes EVENT in detail, including the electricity network models, demand and generation data, power flow analysis, and overview on the cloud computing technologies used. Section 3 presents a use case that demonstrates the use of EVENT with an extensive real world residential smart meter dataset, provided by an energy supplier, showing the impact of different electricity tariffs on distribution networks. Finally, Section 4 draws conclusions and provides recommendations for future work.
2. EVENT
Electricity networks are designed to operate to very high standards of electricity supply quality and security, enabling reliable and efficient operation of electrical equipment without endangering life or property (OFGEM, 2022a). National and local power networks, therefore, have technical limitations in terms of operating voltages and power flows that can be tolerated without affecting network performance with regard to safety. As the transition to net zero will involve the electrification of energy-intensive sectors such as heat and transport, system operators are anticipating network congestion which will create challenges in maintaining operation within these limits (Department for Business, Energy & Industrial Strategy, 2020; Element Energy and EA Technology, 2022). For example, a large uptake of EVs in one neighborhood could cause voltages to drop below permitted limits, resulting in “brownout” conditions which can cause malfunction or permanent damage to devices owned by consumers. Other challenges include ensuring that electric faults on the networks can be quickly identified and mitigated by network protection and limiting the maximum electricity current flowing through devices below the rating of network components.
Network power flow analysis is an essential and versatile component in the toolkit of network operators for assessing the issues that LCTs could have on power grids. This analysis uses network topology and construction information (e.g., length and types of cables) alongside usage data from loads and generators to assess the state of a network in a specific operating condition. This allows a network operator to assess a range of important parameters, including network congestion (voltage and thermal issues) and performance criteria (e.g., energy losses).
The steps required to analyze the impacts of LCTs on distribution network infrastructure are outlined in Table 1, illustrating how undertaking analysis of this type is both time-consuming and complex. The challenges with exploring impacts of network components on systems are compounded by the fact that many of the tools that are popular with network operators (e.g., DIgSILENT GmbH, 2022; DNV, 2022; Eaton, 2022; TNEI, 2022) require a paid subscription. EVENT brings into one place several computer programs and steps described in Table 1 to open up network analysis to various stakeholders in the energy ecosystem. There are also a number of open-source network modeling tools such as Matpower (Zimmerman and Murillo-Sanchez, Reference Zimmerman and Murillo-Sanchez2020), PyPSA (Brown et al., Reference Brown, Hörsch, Hofmann, Neumann, Zeyen, Syranidis, Frysztacki, Schlachtberger, Glaum and Parzen2022), PowerModels (Coffrin et al., Reference Coffrin, Bent, Sundar, Ng and Lubin2022) (see, e.g., OPEN (Morstyn et al., Reference Morstyn, Collett, Vijay, Deakin, Wheeler, Bhagavathy, Fele and McCulloch2020) for a recent summary of tools in this space), although these also typically require significant know-how to use effectively, typically requiring knowledge of a scripting or programming language to work with.
Table 1. Steps required to use power flow analysis to simulate and assess impacts of low carbon technologies on distribution network congestion.

Note. EVENT abstracts this complex workflow to allow an end-user to interact with a user-friendly, open-source web-based tool, typically returning results in 1 min or less.
Through a user-friendly interface, a user can define certain characteristics of the network model (e.g., urban or rural network) and assign demand and generation data to the electricity network (Figure 2). The backbone of EVENT is a power flow simulator that converts input data defined by the user to load profiles, simulates the network using a load flow solver (Meira, Reference Meira2022), then processes and returns voltages and powers indicating the state of the network under study (e.g., indicating if voltage limits and hosting capacity are breached). The power flow solver (EPRI, 2018) uses iterative numerical methods to solve the nonlinear unbalanced power flow equations.

Figure 2. EVENT user interface accessed through a web browser. Results section (right) is populated after a simulation run.
The “Results” section in EVENT is populated approximately 1 min after submitting the simulation. During this time, the demand and generation data is being assigned to the electricity network (e.g., assigning demand profiles to households), followed by a sequence of power flow simulations for each half-hour time period of the day (matching UK smart meter temporal resolution). Finally, the results are collected, plotted as visualizations, and then returned to the user for interpretation.
The results include “LV network voltages” which plots the range (i.e., the minimum and maximum customer voltages), interquartile range and median customer voltages, simulated for each time period, and for each of the LV networks (up to five) that are modeled in detail. Voltages (on the y-axis) are given in per-unit: multiplying by 230 will give the voltage in volts (e.g., 1.10 per unit is the same as 253 V). If any part of the plotted graphs passes the dashed red lines (labeled lower and upper limit, at 0.94 and 1.10 per unit, respectively), then the voltage will have passed outside of the steady-state voltage limits for the UK. The voltage limits for “MV network voltages” are between 0.94 and 1.06 per unit, which are narrower than LV networks. Additionally, the distribution of MV voltages that are plotted is considered at all nodes that are not in the LV network, rather than only at customer premises as considered for the LV voltage distribution, as there are typically few customers directly connected at these higher voltages directly. Other results include the “transformer powers” which plots the total utilization, in %, of the primary (High Voltage, HV to Medium Voltage, MV) and secondary (MV to LV) substations. The power flow (in kVA) through the modeled secondary substations can be found by multiplying by the rating of that substation (within the legend, inset). Additionally, users can download summary statistics used to create the results figures to allow a user to reproduce figures using their own preferred plotting software (note that time series profiles of voltages for individual consumers are calculated internally in the package, and can be accessed using the provided code, but are not available from the online interface due to large data requirements). More information is available on the EVENT interface.
The different components of EVENT are described in the sections below.
2.1. Digital network representations used in EVENT
Electricity network models are digital representations of the physical power system which are used to support the planning and operation of the power system. Network operators own and maintain these models of their networks, although the fidelity and accuracy of the models vary considerably depending on their purpose. For example, in countries such as the UK, distribution-connected “distributed” generation has grown hugely—the UK today has 14 GW of solar PV supported by the Feed-in-Tariff, an eightfold increase in capacity over the last decade (BEIS, 2022). Connection of distributed generation requires network studies to be undertaken, requiring up-to-date digital representations, typically to 11 or 33 kV (MV) distribution. Network operators, therefore, are likely to have reasonable representations of these MV systems, although they are typically not available for members of the public or companies to access or run.
On the other hand, domestic LCTs are connected at the lowest voltage levels (230 V or “LV”). Extensive topological and electrical system data at the highest geographic fidelity is required if low voltage (LV) models are to be maintained and used to provide decision support for network planners. Moreover, there have been few significant active components at these LV voltage levels, so few actions can be taken by network operators to support system operation at LV level. As such, these LV networks have instead been designed and operated using the “Fit-and-Forget” paradigm. As a result, LV network models suitable for power flow are not maintained by network operators on a widespread basis.
It is however interesting to note a number of organizations have started projects to create digital representations on a much wider scale, that would include LV and MV levels, such as the Energy Network Association’s National Energy System Map in the UK (ENA, 2021) or Tapestry in the US (The X Company, 2021). In future, these might enable systematic analysis of the impacts of LCTs across a much larger proportion of real LV networks.
2.1.1 MV–LV distribution network models for analysis of LCT impacts on European-style distribution networks
Given the lack of validated, real-world distribution networks available from distribution network companies, in this project a pair of recently developed MV–LV distribution network models (Deakin et al., Reference Deakin, Greenwood, Walker and Taylor2021b) were selected as ideal networks to provide proof-of-concept for the EVENT tool. These models have been created by allocating real-world LV networks (Electricity North West, 2014) to generic, representative MV networks Foote et al., Reference Foote, Djapic, Ault, Mutale and Strbac2005, as shown in Figure 3. The use of such an MV–LV model is required to enable the increased level of coupling seen between LV feeders to be captured (which, in turn, is driven by LCTs all responding in consort with price or control signals passed down from transmission systems). The use of power flow analysis allows for network congestion to be explored in terms of both voltage constraints (e.g., voltage rise) and thermal constraints.

Figure 3. EVENT MV–LV network modeling approach, with the urban network shown.
These MV–LV models consist of two networks, with a complete description of these systems provided by Deakin et al. (Reference Deakin, Greenwood, Walker and Taylor2021b). The first network, the “HV-UG” model, represents an urban underground 11 kV network feeding 75 LV substations (see Figure 3). These LV substations feed a total of more than 19,000 individual customers (and so could represent, e.g., a small town). The second model, the “HV-UG/OHa” network is a system consisting of a mix of underground and overhead 11 kV lines feeding, and so represents a mix of urban and rural topologies, with 308 LV substations and 15,000 individual customers. The rural, overhead part of the HV-UG/OHa network has a much lower load density, with LV substations feeding much smaller numbers of customers as compared to the LV substations in the dense underground HV-UG network.
A number of modifications have been made to these networks to support a more holistic view of the impacts of LCTs on the grid, with additional functionality to better reflect real-world networks. Firstly, the MV–LV networks of Deakin et al. (Reference Deakin, Greenwood, Walker and Taylor2021b) are only modeled with domestic consumers, whereas real distribution networks also have a range of industrial and commercial (I&C) customers with very different demand profiles. Therefore, there are options in EVENT to select the percentage of demand which is domestic (with LCTs) and the percentage of non-domestic, I&C loads (these are modeled as “lumped” loads directly on the MV network).
Additionally, a mix of both detailed LV network modeling and lumped LV systems was adopted. Users can select up to five of the LV networks across the MV–LV system to model in full detail. For the other LV networks in the system, the demand and generation for the LCTs and underlying demand are assigned, then these loads are aggregated to the LV substation. This aggregation reduces the scale of the computations required by the cloud tool, while still providing the user with an insight into the changes in voltages at the customer level in the LV networks. From the point of view of the MV–LV power flow solution, this results a slight loss of accuracy (as phase unbalance and losses in the LV networks are not accounted for), however, these effects are relatively small and so this is a common assumption in MV–LV system modeling (Procopiou et al., Reference Procopiou, Jazaeri, Petrou, Liu, Ochoa, Langstaff, Harding and Theunissen2020). To give a sense of scale, losses across the entire distribution networks (including all four distribution system voltage levels shown in Figure 1) are typically 3.5–8% (Northern Powergrid, 2018), although it is also worth noting that these losses are nonlinearly related to demand time series. Finally, EV fast charging stations and distributed generators can impact significantly the power flows on 11 kV networks. Options for including these systems within the MV–LV model are therefore also included, with each modeled as lumped elements in the model (EVENT, 2022a).
Internationally, distribution systems are typically built in either European-style or North American-style topologies. The former typically has much more extensive LV systems, with it being common for hundreds of customers connected to be connected to a single LV substation, while US style networks typically have fewer than 10 customers per LV substation (Von Meier, Reference Von Meier2006). To match the UK-based load and generation data (Section 2.3), the UK-based MV–LV models were selected, which follow the European-style network topologies. Further European-style models which exist today which could be used directly in the tool (or with small modifications) include the synthetic “Reference Network Models” (EU JRC, 2012) or the non-synthetic LV network system (Koirala et al., Reference Koirala, Suárez-Ramón, Mohamed and Arboleya2020).
To be able to use EVENT to represent North American networks, representative data for the loads on these types of networks would need to be incorporated into the tool. In addition, there are a number of real networks that could be implemented and used for analysis, including the IEEE 8500 node circuit and the EPRI J1/K1/M1 feeders (Palmintier et al., Reference Palmintier, Elgindy, Mateo, Postigo, Gómez, de Cuadra and Martinez2021).
2.2. Data
Using real world datasets on the usage patterns of LCTs, instead of assumed profiles, has been demonstrated to minimize overestimation of LCT impacts on electricity networks (Neaimeh et al., Reference Neaimeh, Wardle, Jenkins, Yi, Hill, Lyons, Hübner, Blythe and Taylor2015).
EVENT includes smart meter, demand, and generation data that were collected from real-world demonstrators and can be used as default datasets to run power flow studies (EVENT, 2022b). Different penetration levels of LCTs can be simulated (e.g., 0.5 in “penetration box” in Figure 4 indicating 50% EV penetration) and a key feature of EVENT is that it allows users to upload their own datasets, enabling the analysis of different use cases and the usage of recent profiles such as vehicle-to-grid EV charging profiles. LV connected data indicates demand and generation profiles assigned to households on the network. EVs, PVs, and HPs can be left empty to indicate no LCT uptake. Alternatively, the higher the penetration of LCTs, the higher the impact that will be seen on the network, allowing the user to observe if a given combination of LCTs could lead to network congestion. MV connected generation indicates distributed generation sites such as commercial solar installations and the MV demand indicates fast charging sites with hundreds of kWs of site capacity.

Figure 4. EVENT demand and generation data interface.
The first default dataset is a smart meter dataset from the Customer Led Network Revolution project which was used as the baseload electricity demand in EVENT (Northern Powergrid, 2017). Another default smart meter dataset that can be used is a set of synthetic profiles created using the CREST Demand Model, a simulation tool that models user occupancy and device usage rates to estimate overall energy demand (McKenna and Thomson, Reference McKenna and Thomson2016).
EV data available in EVENT was extracted from an openly available EV charging data from the WPD- Electric Nation project. The Electric Nation project collected data over 18 months from around 700 participating EV owners. The residential EV chargers installed were 3.7 and 7 kW chargers (WPD, 2020). The code to process the EV data into 30-min daily profiles is openly available on the project GitHub repository (EVENT, 2022b).
Solar PV data was collected from a website called “PVOutput” which is a free service for sharing real PV output data (PVOutput, 2022). Residential and industrial owners of solar systems can contribute power output readings and EVENT includes data from a selection of households in the South of England shared data at 5-min resolution. The code to resample PVoutput data from 5-min into 30-min daily profiles can be found on the project GitHub repository (EVENT, 2022b) and a visualization of winter and summer PV data used can be seen in Figure 5, with the shaded area representing the range of values and the solid line the mean generation.

Figure 5. Default PV dataset used.
Half-hourly heat pump demand profiles are provided using the same approach as Deakin et al. (Reference Deakin, Bloomfield, Greenwood, Sheehy, Walker and Taylor2021a), based on the outputs of Love et al. (Reference Love, Smith, Watson, Oikonomou, Summerfield, Gleeson, Biddulph, Chiu, Wingfield, Martin, Stone and Lowe2017). Four profiles are provided with EVENT, representing typical domestic heat pump usage during a cold snap (“weekday” and “weekend”) or during a typical winter’s day (“weekday_mid” and “weekend_mid”), allowing a user to consider heavy or typical usage.
MV connected data include distributed generation and EV fast charging demand. The default DG data used was from PVOutput and the fast charging station data was obtained from a site in Newcastle hosting six fast charging stations with a total of 550 kW capacity.
2.3. Cloud computing technologies used to build EVENT
Cloud computing technologies give users access to superior computing infrastructure, such as extensive data storage and enhanced processing power, installed in a separate location and accessed through the users’ internet connected devices. In recent years, cloud computing technologies became much more accessible with several providers offering these services and resources on how to use them such as Amazon Web Services (AWS), Google Cloud Platform (GCP), and Microsoft Azure.
EVENT does not require significant computing resources; however, it was built using cloud computing technologies (Microsoft Azure) because it was easier and faster than setting up an on-premises physical computing infrastructure to run EVENT.
Several tools were used to build EVENT’s computing infrastructure and deploy it online (EVENT, 2022c). The front end (i.e., the website front that displays the parameters and results) was developed using an open source framework called Vue.js (Vuejs, 2022) and deployed as an Azure Static WebApp (Microsoft, 2022a). Cloudflare (2022) was used to add a custom domain name to the front end (i.e., e4futuregrid.com). The electricity network simulation engine was developed in dss-python (Meira, Reference Meira2022) (a port of EPRI’s OpenDSS (EPRI, 2018)) and Python. Azure App Service (Microsoft, 2022b) was used to deploy the back end which is storing the default datasets, electricity network models and running the electricity network simulation. The API which links the front end and back end was built using FastAPI (FastAPI, 2022).
The source code of EVENT is made open-access with a permissive free software license to facilitate its expandability with additional modules (EVENT, 2022d).
3. Use Case
We share the results of using EVENT to explore the impacts of an energy supplier time of use tariff on grid congestion.
An anonymized half-hourly residential smart meter dataset with around 100 k daily profiles from more than 20,000 customers was provided by Octopus Energy’s Centre for net zero. The dataset included a variety of customers spanning urban and rural areas who are signed up to various electricity tariffs (e.g., fixed vs time-of-use tariffs). In addition, the dataset captures variables such as temperature and day of the week assigned to the daily profile, and LCT ownership data, as self-reported in a customer survey (considering home battery, EV, solar PV, or heat pump LCTs). For customers who owned an EV, profiles were only provided on days when there was an inferred charge event (using the heuristic that a charging event has at least two consecutive half-hour periods with a charging power of 3.4 kW and above).
For this work, electricity profiles of the “Octopus Go” tariff were extracted from the dataset. “Octopus Go” is a time-of-use tariff targeted at EV drivers. It presents customers with cheaper electricity rates from 00:30 to 04:30, encouraging EV charging to start charging at 00:30 as opposed to starting during the evening peak (i.e., when drivers typically arrive back at home and plug in). This deferred charging can be scheduled automatically on a ChargePoint app, or by manually plugging in and charging later in the evening.
Electricity demand varies during the day with lower demand at night and peak demand in the evening in the UK. Reducing peak demand by shifting customers’ electricity demand to other times of the day lowers the need for additional generation capacity. In addition, it lowers network reinforcement needs by keeping demand within the capacity limitations of national and local grids (Goater, Reference Goater2014). While most electricity tariffs in the UK are fixed (i.e., same rate is paid throughout the day), some energy suppliers have introduced time-of-use electricity tariffs, with varying prices throughout the day, to demonstrate that customers could change their behavior in response to cheaper price signals (e.g., off peak electricity or cheaper renewable electricity; Octopus, 2018).
Figure 6 illustrates electricity demand (consumption) time series over one cold weekday for both urban and rural customers on the “Go” tariff. For each half-hour period, these figures plot the 5 and 95% quantiles (outermost lines), the interquartile range (inner, darker shaded area), and median power (bold line). It can be noticed that the demand profiles are similar, with both urban and rural customers exhibiting a peak at 00:30 instead of an evening peak. A slightly higher peak for rural customers can be seen (at the 95% quantile) implying that some of the rural customers might have longer driving distances that would lead to increased EV charging demand.

Figure 6. Urban (right) and rural (left) demand profiles of GO users for a cold winter weekday.
The “Octopus Go” smart meter profiles were uploaded under the “Smart meters” tab in EVENT and the default option “None” was kept in the remaining tabs (i.e., “Electric Vehicles” tab in EVENT was not used because the “Go” smart meter data already includes EV charging demand). The urban “Octopus Go” study results were compared with the CLNR smart meter and Electric Nation EV datasets to compare time-of-use and fixed tariffs impact on peak demand (Section 3.1). The possible synchronization effect from time-of-use tariffs was discussed in Section 3.2 and a comparison on grid impacts between the urban and rural networks was discussed in Section 3.3.
3.1. Time-of-use versus fixed tariffs—Increased headroom during evening peak
We analyze data from time-of-use “Go” tariff where customers are incentivized to shift their EV charging to take advantage of cheaper electricity rates. We then compare the results with a study using a fixed tariff dataset where electricity rates cost the same throughout the day. The Octopus smart meter dataset did not contain fixed tariff demand data with EV customers to be able to compare with Octopus “Go” so data from two previous projects were used instead. The CLNR smart meter dataset contains baseline household electricity demand without any LCTs (such as EVs), which was used to populate the baseline smart meter dataset in EVENT. The Electric Nation EV charging demand data was chosen for the “Electric Vehicles” tab in EVENT. Unlike the Octopus Go dataset, most of the EV charging in the Electric Nation dataset happened during the evening peak (i.e., people mostly charged their cars on arrival at home in early evening) using 3.7 kW chargers (WPD, 2020). This is likely due to the fact that their tariffs did not incentivize them to charge overnight, whereas the Octopus Go consumers are all subject to consistently low overnight prices. The average peak demand for the fixed tariff study and for the Go study were both approximately 2 kW. However, the difference is in the timing of the peak with the “Octopus Go” peak demand taking place at around 1 am (Figure 7).
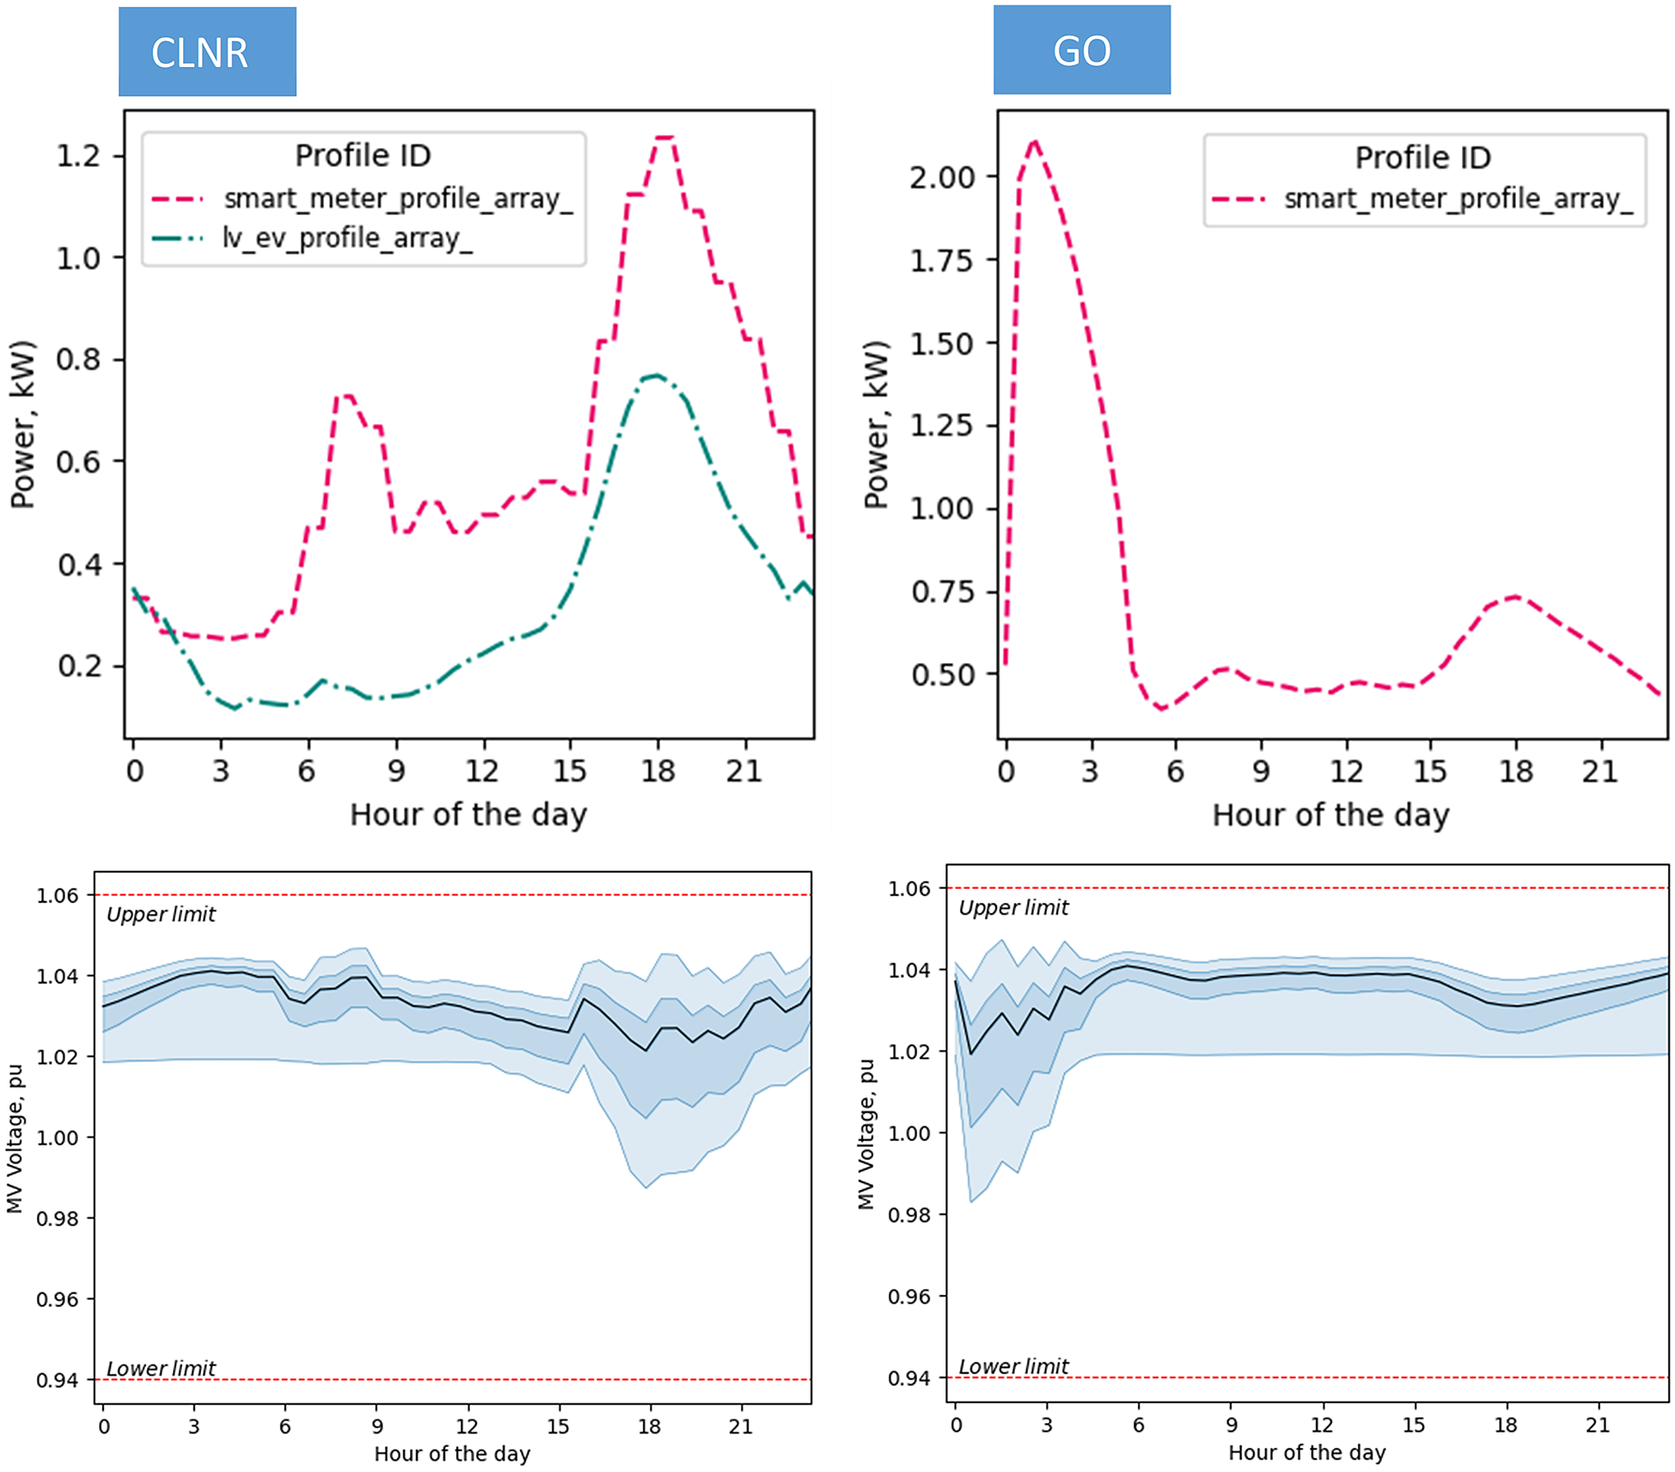
Figure 7. Time-of-use tariffs minimizing evening electricity peak demand, with figures output directly from the EVENT tool (and therefore note different axes scales for the GO and CLNR profiles). The plotted (mean) profile smart_meter_profile_array_ is aggregated EV and non-EV demand for the GO case (right), whereas in the CLNR case (left) the smart_meter_profile_array_ profile represents disaggregated mean non-EV demand, and lv_ev_profile_array_ the mean EV demand profile.
The “MV network voltages” are plotted in Figure 7, and it can be observed that in both cases there are no MV network voltage issues. (Note that, as the voltage on the fixed “source” node is close to 1.02 pu, the minimum (or maximum) MV voltage reported throughout the day will never be above [respectively, below] this value substantially.) However, it can be seen that “Octopus Go” contributed to a reduction of the evening peak usage in the studied electricity network. Extrapolating the results of the small town considered in the case study network (of c. 19 k customers) to a whole region or to the whole country suggests that smart tariffs can help shift electricity demand from early evening peak, increasing headroom and possibly minimizing costly network reinforcements.
3.2. Time-of-use tariffs-synchronization effect
As demonstrated in Section 3.1, customers responded to a cheaper price signal and moved their EV charging from the existing electricity peak to later at night, which could alleviate the existing electricity peak demand problem. However, responding to the same signal (i.e., a lower price) could create a synchronization effect where customers are all charging at the same time, creating a new electricity peak.
The “Octopus Go” urban smart meter dataset was used to demonstrate the impact of charging synchronization on voltages of LV networks. Figure 8 shows voltages for three selected local urban networks, with all consumers allocated to have an Octopus Go profile (i.e., assuming that all consumers have a tariff with low overnight costs, as intended for EV owners). While these networks are not exhibiting voltage drops during the evening peak, two out of three networks show voltage drop issues after midnight, starting at the GO tariff’s low-price period of 00:30. Charging synchronization has created a new midnight peak and associated voltage problems for LV network 1137. Figure 8 shows the impact on LV voltages, whereas Figure 9 (left) shows the impact on primary and secondary transformers.
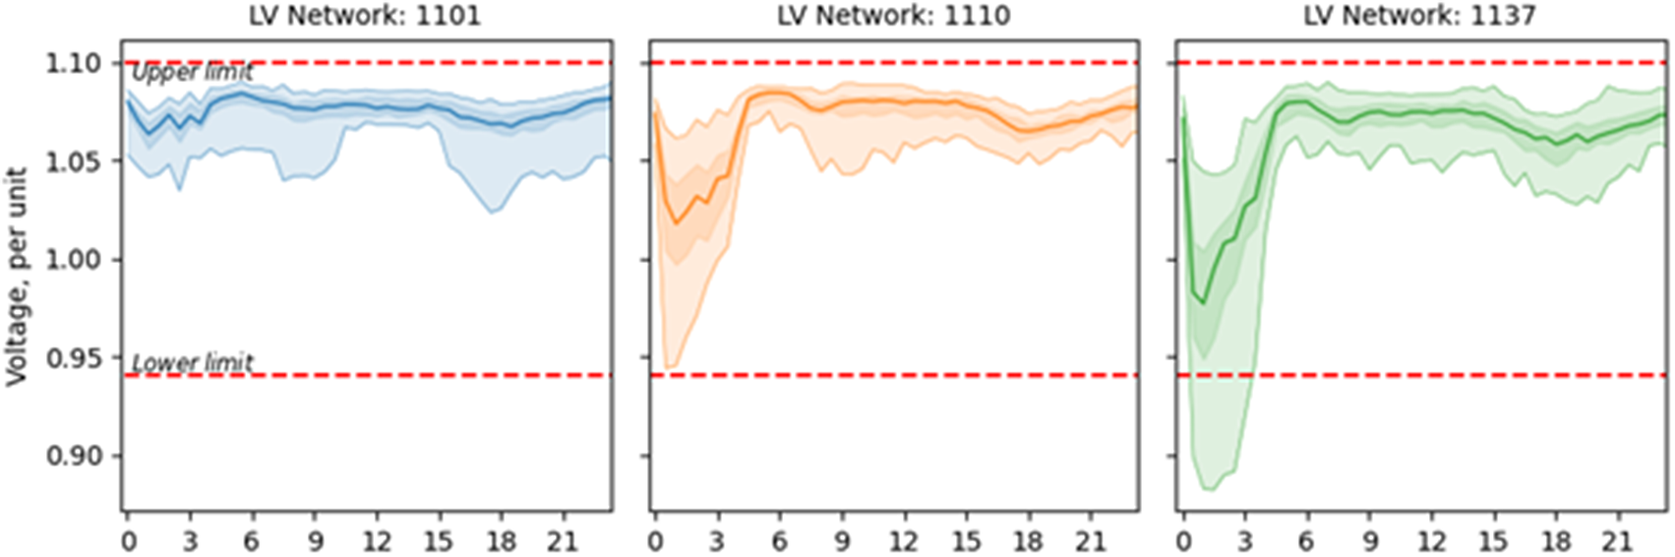
Figure 8. Voltages at selected LV networks when all customers are allocated an “Octopus Go” load profile.

Figure 9. Urban versus rural grid impact on transformer utilization capacity.
3.3. Urban versus rural comparison
The “Octopus Go” smart meter dataset was also used to compare grid impacts on urban and rural networks, in particular, we looked at the impact of primary and secondary transformers.Footnote 1 It can be noticed that there were no issues on the primary transformer for the urban network; however, the capacity of the primary transformer for the rural network has been exceeded (as indicated by utilization greater than 100%). With regard to secondary transformers, we observe that there is congestion in both urban and rural areas.
This congestion typically will lead to an increase in costs, either through up-front reinforcement costs, or through procurement of alternative “non-wires” services. For example, one solution could be to reinforce the primary and secondary substations. Typical values reported by Distribution Network Operators (DNOs) for a secondary MV–LV substation indicate costs of £15–25 k, where HV–MV primary substations can be in excess of £1 m (WPD, 2022a).
There are other alternative “non-wires” approaches for addressing this congestion. For example, flexibility markets allow a DNO to access customer resources to reduce usage during system peaks, although naturally these consumers then require ongoing payment for providing this service (Energy Networks Association, 2020). Households with LCTs could respond to these signals, either manually or via automation, to intelligently shift demand in line with network constraints and congestion and be rewarded for providing this service. In other cases, innovative techniques such as network meshing can allow LV networks to release headroom (Element Energy and EA Technology, 2022), although this is typically only practical in areas with relatively high load density—sparse, rural LV networks are unlikely to be interconnected through normally open points, and so this is unlikely to address issues in rural LV substations.
Figure 9 shows that the substation ratings for the urban LV networks are lower (on the figure legend, inset). This is because the number of customers on these networks is lower (1101, 1110, and 1137 each have more than 180 customers, while 1262 have just 21 customers). This means that typically an increased network capacity will have been allocated for those properties, following the After Diversity Maximum Demand approach (Element Energy and EA Technology, 2022), so the per-customer headroom is bigger. However, the smaller number of customers also means that a smaller number of customers changing their behavior can affect a substation more quickly. If small neighborhoods move quickly to high levels of heat pump and EV ownership, then this could cause congestion sooner than a DNO expects.
4. Conclusion and Future Outlook
Governments worldwide including the UK are pushing for the digitalization of the energy sector to enable rapid and cheaper decarbonization. Transforming the electricity industry by using digital technologies improves its processes by harnessing the power of data to increase visibility, controllability, and coordination of the grid which in turn increases its flexibility to react better and faster to change (Neaimeh and Andersen, Reference Neaimeh and Andersen2020; BEIS et al., 2021).
There is low visibility into how energy is flowing in and out of the grid, especially at the lower levels of the networks where customers are connected. Information is siloed and, in some cases, non-existent which makes it complicated to operate, plan, and keep the system in balance. In support of digitalization activities, more and more DNOs are increasing their monitoring efforts of the lower levels of the networks and building more detailed network models and increasingly making them openly available (OFGEM, 2022b; WPD, 2022b).
Leveraging on datasets and network models that are currently available, we used cloud-based technologies to build EVENT, an openly available tool through a web browser, that allows users to conveniently and seamlessly simulate a distribution system, exploring how LCTs impact on electricity distribution system congestion.
First, EVENT can and is already being used as a teaching tool in power systems, sustainable energy, and energy digitalization modules. EVENT consolidates several steps and software that were described in Table 1 which could facilitate the learning process. The government’s digitalization strategy explicitly mentions the importance of improving digital skills in the energy sector required to monitor, analyze and run this complex system (BEIS, OFGEM, Innovate UK, 2021). Efforts such as EVENT contribute directly to reducing the digital skill gap.
Second, EVENT can be used by a range of stakeholders in the energy ecosystem who might not have the bandwidth to curate and integrate disparate datasets, electricity network models and code but would like to link their net zero activities to possible impacts on the grid for a range of LCT uptake scenarios. These stakeholders include policy makers, local authorities, and EV charging infrastructure operators wanting to minimize the cost of installation and energy suppliers introducing various smart tariffs.
We demonstrated in a use case, how an energy supplier can assess the impacts of smart tariffs on network congestion. It was shown that time-of-use tariffs can effectively shift charging to off-peak periods, although widespread uptake is shown to have the potential to create new peaks. For example, the synchronization of EV charging to an overnight slot resulted in both voltage and thermal congestion. Results suggest both DNOs and energy suppliers will have to work much more closely together to ensure that latent flexibility from customers’ LCTs can be accessed in an equitable and practical way that simultaneously respects safety and security constraints within distribution grids. The results of the use case also support previous work indicating that electricity networks are not a homogenous group and bespoke studies are required to understand grid congestion from LCTs (Neaimeh et al., Reference Neaimeh, Wardle, Jenkins, Yi, Hill, Lyons, Hübner, Blythe and Taylor2015). The use case results highlighted the difference between the urban and rural networks at the primary (i.e., MV) substation level but also highlighted differences at LV level—for example, differences between urban LV networks to cope with LCT uptake. In future, development of the EVENT tool could even support and inform efforts to reduce connection waiting times for consumers looking to install LCT.
Two immediate ways to expand on EVENT include adding a cost module to determine possible reinforcement costs of network assets and adding a more comprehensive range of network models. Further efforts could also look to consider uncertainty in the load profiles or forecasts to enable risk-aware modeling of network congestion.
More data capture, detailed network models and coordination between the various network keepers are required before we can have a digital twin of the electricity network that would allow a closer management and control of the physical system (Sacks et al., Reference Sacks, Brilakis, Pikas, Xie and Girolami2020). DNOs are increasingly making available more detailed models of their networks and publishing it in a common standard (OFGEM, 2022b; WPD, 2022b). By including these network models, we could incrementally build a more detailed representation of the electricity grid and the tools on top of it to simulate it. EVENT demonstrated that it is possible to open up network analysis to a wide range of stakeholders and its modular approach makes it possible to build on it from the currently available two pseudo-real representative network models to capture a significant part of the GB electricity network.
Abbreviations
- EV
-
selectric vehicles
- LCT
-
slow carbon technologies
Acknowledgments
We are grateful for the technical assistance of Pam Wochner for data processing, and Louise Bowler and Anna Hadjitofi for supporting the development of EVENT. We are also thankful to Alex Howard and Lucy Yu for enabling the collaboration with OCNZ. Matthew Deakin’s work was supported by Supergen Energy Networks Hub (EP/S00078X/2) and a fellowship from the Centre for Postdoctoral Development in Cities, Infrastructure and Energy (CDICE), led by Loughborough University in collaboration with the University of Birmingham and Cranfield University and funded by the Research England Development Fund.
Author Contributions
Conceptualization: M.N., M.D.; Data curation: M.N., M.D., R.J.; Funding acquisition: M.N.; Methodology: M.N., M.D., O.G.; Software: O.G., M.D.; Writing original draft: M.N., M.D., R.J., O.G. All authors approved the final submitted draft.
Competing Interests
The authors declare no competing interests exist.
Data Availability Statement
Replication data and code can be found in https://github.com/alan-turing-institute/vehicle-grid-integration-webapp-private, https://github.com/alan-turing-institute/e4Future-opendata, and https://github.com/alan-turing-institute/vehicle-grid-integration-opendss-networks.
Funding Statement
This research was supported by grants from UK Research and Innovation (e4Future grant 104227) and the Lloyd’s Register Foundation (G0095) under the Data-Centric Engineering Programme of The Alan Turing Institute.


 Open access
Comments
No Comments have been published for this article.