

Introduction
This article contributed to an integrated picture of socioeconomic inequality by studying wealth and income distribution across occupational classes in five European countries. Using wave 2014 of the European Central Bank’s Household Financial and Consumption Survey (HFCS), we aimed to capture the relative importance of wealth vis-à-vis income all along the occupational class hierarchy. We thus tried to address the challenge posed to sociology by Piketty’s research [Savage Reference Savage2014]. That research compellingly showed the importance of wealth in contemporary societies’ inequality patterns, and Piketty’s works have been interpreted as a call to study elites in-depth and to distinguish among top income groups [Godechot Reference Godechot2017; Rehm and Schnetzer Reference Rehm and Schnetzer2015]. In contrast, we turned our focus to the contribution of wealth by the entire class structure [Rehm, Neqvi and Hofmann Reference Rehm, Neqvi and Hofmann2016; Skopek Reference Skopek2015; Waitkus and Groh-Samber Reference Waitkus, Groh-Samberg, Korsnes, Heilbron, Hjellbrekke, Bühlmann and Savage2018]. As will be shown, there is a trade-off between greater comparability of income and wealth distribution, on the one hand, and an “ideal” combination of this terminology with occupations and less fit with cross-country and historical comparisons, on the other. Piketty has chosen the first option; we opt for the second.
More precisely, we argued that taking occupational classes seriously in wealth and income distribution helped provide a clearer picture of inequality patterns in European societies and, in turn, extended the criteria through which class matters. We used Piketty’s works as a springboard to understand inequality from a dynamic perspective, determining the life chances associated with class belonging. Our starting point was the nature of social changes that matter when wealth was taken into account in the analysis of social stratification, a very new strand of research [Savage and Li Reference Savage and Li2021]. Piketty [Reference Piketty2014] has argued that the rise of a patrimonial middle class was “the principal structural transformation of the distribution of wealth in the developed countries in the twentieth century” [Ibid.: 260-261]. This major transformation has “deeply altered the social landscape and the political structure of society and helped redefine the terms of distributive conflict” [Ibid.: 261]. It was all the more important that top labor and capital income tended to increasingly go hand in hand [Berman and Milanovic Reference Berman and Milanovic2020]. These findings have deep implications for sociological analysis. Yet, until now, few research studies provided an in-depth sociological understanding of this patrimonial middle class and of the classes that remained excluded from this accumulation trend. Conceptual, as well as methodological, challenges were at play.
Conversely, the paper aimed to demonstrate the contribution of occupational groups to the extent and the way in which wealth inequalities shaped societies both at the macro- and the micro-levels. To do so, we estimated the relationship between wealth and income across occupational groups using aggregate data for five major European countries. Thus, we inductively built occupational group clusters, drawing on the relative importance of wealth for income. Second, we showed how cross-country comparisons helped our understanding. This move went hand in hand with a decomposition of wealth between a household’s main residence and valuables, on the one hand, and more disposable assets, on the other. Further, we drew on these previous steps to elaborate on a comparative analysis of the relative weight of wealth vis-à-vis income across country, age, and occupational groups. Finally, we estimated the inheritance anticipations for each occupational group and potential financial assistance, articulating objective and subjective variables in the analysis. In this way, we aimed at capturing the relevant future perspectives available for each group in terms of wealth accumulation patterns. Class analysis can, thus, make room for the dynamic dimension of the life-cycle, a concern raised by the thesis of individualization and insecurity. Whereas in many cases, this literature, especially that which defended the individualization thesis, denied the persistent significance of class, we argued that class, as in occupational groups, still mattered. Yet, a renewed conceptualization of the relevant aspects of class for describing social position, going back to the early works of Pierre Bourdieu, has to be elaborated in order to meet the challenges posed by the cumulative aspect of wealth. We argue that our empirical research allowed for a clarification of the debates about class by distinguishing the criteria of methodology and class schema description.
Literature and Research Questions
Questioning Piketty’s legacy
Extending Piketty’s concern for the relative weight of wealth across the class spectrum Piketty’s works have been critical in highlighting the importance of wealth in societies’ social structures. Following his first works on top incomes in France [Piketty Reference Piketty2001], he has shown the rise and significance of the super-rich, especially in the US, the importance of this group in the distribution dynamics of recent decades, and the varieties of situations that can be found among the top 1% of the distribution in terms of both income and wealth. Because wealth is more unequally distributed than income, its increasing importance contributes to the weight of elite groups in framing political and ideological outcomes [Piketty Reference Piketty2020]. In a series of papers, Rehm and Schnetzer [2015], and Rehm, Naqvi and Hofmann [2016] have argued that Piketty’s findings should lead to a focus on between-group inequalities and a renewal of class analysis. Using the HFCS dataset, they extended Piketty’s measures on wealth inequalities to the 17 countries covered by the dataset. They showed that wealth created great discontinuities between capitalists and employees. Drawing on Wolff and Zacharias’ [Reference Wolff and Zacharias2013] decomposition of capitalists into various segments, they showed that the self-employed detained a large share of wealth.
We share with Rehm et al. the idea that neither wealth matters only to understanding the top nor the patrimonial middle class but the entire class structure. To dig into this promising research direction, we made a between-group comparison using a key indicator used by Piketty at the country-level, the wealth-to-income ratio (WIR). Initially developed by Stiglitz [Reference Stiglitz1969], the WIR is relevant in three dimensions [Savage and Li Reference Savage and Li2021]: it measures the growing social weight of wealth, it is suitable for cross-country comparison, and its third aspect relates to the distributional structure of income and wealth. Thus, the wealth-to-income ratio expresses at the aggregate level the “weight” of the past on the present and, most importantly, the future.
Given that wealth is a cumulative stock that reflects years of prior circumstances and decisions at the household level [Elmelech Reference Elmelech2008; Keister and Moeller Reference Keister and Moeller2000], we argued that a similar wealth-to-income ratio could be used to assess and analyze class inequality. Thus, this paper used the (meta-)hypothesis that the WIR is a relevant tool for a sociological analysis of the various dimensions of inequality in Europe. We also considered that the WIR’s added analytical value was the facilitation of multidimensional comparisons: between classes, between countries, and between the age groups of each class and country. Such a ratio could cumulate the advantages of the attributional (in terms of important attributes of individuals, such as income and wealth, of which they can possess more or less) measure of inequality typical for economic reasoning with the relational study of inequality that Goldthorpe praised as being the specific approach of sociologists [Reference Goldthorpe2012: 204]. For sociologists, “class analysis sees class as having the potential to explain a wide range of outcomes” and, as such, “class is of interest because it links individuals’ positions in capitalist markets to inequality in the distribution of life chances” [Breen Reference Breen and Wright2005: 35]. The key issue is on what basis positions should be distinguished. Economists and sociologists still give different answers to this question and using wealth has raised sharp debates among sociologists.
A categorical divergence on class
Studies of socioeconomic inequalities have long been marked by a sharp divide between economic and sociological approaches. The former primarily considers income and wealth when studying issues like inequality or mobility when the latter uses qualitative, theory-driven categories that are at the core of occupational groups’ classifications [Blanden Reference Blanden2013]. Given that the economic perspective adopted by Piketty is one of the closest to sociological reasoning, we can consider his refusal to use occupational groups as a proxy for class as a key point of an enduring discrepancy between the economic and sociological study of socioeconomic inequality.
One should not underestimate the distance between Piketty’s class categorization and sociological reasoning. One can follow his two-step reasoning on class by examining his two major works [Piketty Reference Piketty2014; Reference Piketty2020]. First, Piketty elaborated on a class typology based on income and wealth distribution. In Capital in the Twenty-First Century, he used the various levels of wealth and income distribution to suggest a three-tier class typology [Ibid. 2014: 248-249]. He built a class map based solely on the criteria of income and wealth. The use of these criteria is justified in a strong rebuttal of the sociological insistence on occupational groups in Capital and Ideology. After having mentioned that “class must be seen as profoundly multidimensional” [Ibid.: 721], he lists occupation as one dimension among many: education, wealth, age, gender, national or ethnic origin, religious, philosophical, dietary, or sexual orientation, as well as income level, which is itself “a complex and composite attribute since it depends on all the other dimensions” [Ibid.: 722]. Piketty makes it clear that “educational, income, and wealth deciles make precise historical comparisons possible, whereas occupational classifications do not” [Ibid.: 732]. He added in a footnote of critical importance [Ibid.: 732] that “ideally,” all of these dimensions should be used together, but that, in his work, comparability was nevertheless preferred to blending economics and sociology together.
The bulk of our research strategy is to describe the link between occupational group hierarchy and the WIR. Such a restriction in the research scope brings added value in terms of our understanding of class. In sociological reasoning, the class schema developed by John Goldthorpe has become dominant in cross-country comparisons. The main idea of the “employment aggregate approach” [Crompton (1993) Reference Crompton1998] is that employment relations in the labor market are of key importance to the allocation of individuals into social categories [Erikson and Goldthorpe Reference Erikson and Goldthorpe1992]. As summarized by the authors: “The aim of the class schema is to differentiate positions within labor markets and production units or, more specifically […] to differentiate such positions in terms of the employment relationship they entail” [Erikson and Goldthorpe Reference Erikson and Goldthorpe1992: 37]. Individuals who share a common class position are considered to face similar “market situations” and “work situations.” Accordingly, they are supposed to hold similar life chances and often lifestyles. First, the self-employed and small employers are seen as having a distinct class position, different from employees. Secondly, a key element of differentiation is that employees have discretion and employers have to ensure that this discretion is used in the service of the employer. Asset-specificity and monitoring difficulty [Goldthorpe Reference Goldthorpe2000: 213] specific to this group are dealt with by employers by providing higher wages and prospective elements in the employment contract that play a key role. As put forward by Erikson and Goldthorpe: “For example, salary increments on an established scale, assurances of security […], pension rights […], and […] well-defined opportunities” [1992: 42] help secure a long-term relationship. Thus, those who belong to the service class or salariat are able to capture command over economic resources and security that are key to entering accumulation processes. The salariat enjoys “incremental advancement, employment security, and the possibility of exchanging commitment in the job against a high level of trust on the part of employers” [Scott and Marshall Reference Scott and Marshall2009: 292]. There are various explanations of this consensual point.
Goldthorpe’s class schema has been criticized for not taking wealth, and more broadly speaking, resources, into account and restraining the focus of class analysis to occupation [Savage, Barlow, Dickens, Fielding Reference Savage, Barlow, Dickens and Fielding1992]. Yet, “the distinctions captured in the class schema are held to produce differences in life chances” [Breen 2005: 42], and wealth accumulation is a key element of these differences. Drawing on this schema, we can expect that small entrepreneurs are in a different position from all employees. We can also expect that both a higher income and greater job security matter for entering a wealth accumulation process and, thus, that service class members will achieve access to wealth accumulation dynamics. For instance, a stable labor-market attachment is required to gain access to credit. In the context of the casualization of work that predominantly affects the lower occupational groups, such a long-term commitment is a key advantage for service class members. As a condition for becoming self-employed, the causal relationship between wealth accumulation and occupation is not one-sided [Pfeffer et al. Reference Killewald, Pfeffer and Schachner2017]. Therefore, there should be a strong overlap between the hierarchy of European socio economic groups [ESeG] and unequal accumulation dynamics. It has already been shown that differences in working conditions and cultural capital exist between the service class and the intermediate class, as well as the manual class, in Europe [Hugrée, Penissat, Spire Reference Hugrée, Penissat and Spire2020].
Integrating wealth into the class analysis is more complex since it leads to divergences in terms of the criteria that are relevant for class analysis, as repeatedly put forward by Savage et al., in two rounds of discussion on Goldthorpe’s class schema. The first, from the 1990s, has already been mentioned in this section; the second, following the release of the Great British Class Survey in the 2010s [Savage et al. Reference Savage, Devine, Cunningham, Taylor, Li, Hjellbrekke, Le Roux, Friedman and Miles2013], also has important methodological implications we will address in the next section. It is worth mentioning that the latter work has given rise to a furious debate [Mills Reference Mills2014] we will not enter into, except as far as the dimensions for which integrating wealth in cross-country class-based analyses are concerned, i.e. especially methodological ones.
We want to make it clear here that class is only one of the categorial inequalities affecting wealth distribution. The HFCS data displayed a substantial gender wealth gap. Even if wealth is available only at the household level, Schnneebaum et al. [Reference Schneebaum, Rehm, Mader, Klopf and Hollan2014] conducted an analysis for male and female single households in the eurozone. Male single households have higher net wealth than female single households, especially among the top 10% [Rehm and Schnetzer Reference Rehm and Schnetzer2015]. Qualitative research has shown that the gender gap was far higher when practical arrangements between men and women among families were taken into account [Bessière and Gollac Reference Bessière and Gollac2020; Glucksberg Reference Glucksberg2018]. These research studies have a great interest in highlighting the household-centered dynamics of accumulation and their embeddedness in what Bourdieu called “reproduction strategies” [Bourdieu Reference Bourdieu1972]. Without any intention to hide the theoretical and empirical significance of this dimension, and due to available variables having been built at the household level, this paper only focused on class through the occupation of the reference personFootnote 1. Yet, in the discussion section, we will elaborate on the theoretical convergences between gender and a class-based analysis of wealth accumulation.
A partial overlap between class, income, and wealth inequality across countries On the relationship between class and income
Previous empirical studies have investigated the relationship between social class and various dimensions of economic outcomes, including income insecurity, short-term income stability, and long-term income prospects [Bukodi and Goldthorpe Reference Bukodi and Goldthorpe2019], but also more broadly defined material deprivation and economic vulnerability [Bedük Reference Bedük2018; Lahtinen, Sirnio and Martikainen Reference Lahtinen, Sirniö and Martikainen2018; Lucchini and Schizzerotto Reference Lucchini, Schizzerotto, Rose and Harrison2010; Watson, Whelan and Maître Reference Watson, Whelan, Maître, Rose and Harrison2010; Whelan and Maître Reference Whelan and Maître2007, Reference Whelan and Maître2010]. Recent sociological research has documented the strong relationship between work-related income and occupational class in order to overcome a divide between economics and sociology in the study of socioeconomic inequalities [Albertini, Ballarino and De Luca Reference Albertini, Ballarino and de luca2020; Goedemé et al. Reference Goedemé, Paskov, Weisstanner and Nolan2020]. These works of great importance need to be developed to further improve scientific knowledge of the increasing significance of the impact of class on inequality. Class is also a determinant of homeownership related to social inequality [Kurz and Blossfeld Reference Karin and Blossfeld2004] and, thus, to wealth concentration in contemporary societies.
The cumulative advantage process and social differentiation within the employee class
As a stock figure, wealth helps to overcome the difficulty that arises from the decreasing effectiveness of individual labor market indicators to capture social inequalities [Skopek Reference Skopek2015]. Spilerman [2000] expressed this as follows: “a consideration of wealth becomes relevant once the agenda of the field is enlarged, from a focus narrowly on labor market success and its rewards to a concern with living standards and economic security” [Ibid.: 518]. This broader consideration of inequality led to a sharp critique of the class schema. Taking wealth into consideration is key to determining the accurate position of elite groups who can rely on the self-reproducing dynamic of wealth because wealth can also be used to reach and maintain a particular standard of living [Ibid.: 497]. At the other extreme of the socioeconomic ladder, a lack of wealth matters in understanding lasting poverty [Elmelech Reference Elmelech2008]. In the context of increasing economic risk due to work casualization and unemployment, wealth can constitute a buffer against foreseeable and unforeseeable financial difficulties. Yet, we hypothesize that class matters in shaping this key buffer against economic insecurity, precisely for the reasons mentioned in the previous section. Wealth accumulation is made possible over the life-cycle, especially for groups that enjoy a wealth stock to enter a certain class position (small entrepreneurs) or those who benefit from prospective rewards for the service relationship they enter into with their employers. The issue of the fate of the manual class, between accounts of stagnation and of disaggregation into a new “precariat” [Standing Reference Standing2011], is a question that remains open to empirical examination.
Wealth accumulation is a typical process of cumulative advantage. Thus, adopting a life-course perspective [Elder Reference Elder1975; Kohli Reference Kohli and Marshall1986; Mayer and Müller Reference Mayer, Müller, Sorensen, Weinert and Sherrod1986] can provide elements of explanation regarding the relationship between income and wealth. We argue that what matters in class is the level of income; however, employment security also matters. The relative stability of occupational group attachment allows class to play a continuous role in shaping advantage and disadvantage in terms of wealth accumulation. Diprete and Eirich [Reference Diprete and Eirich2006] differentiate between two forms of Cumulative Advantage/Disadvantage (CAD) processes. The first was derived from Merton [Reference Merton and Storer1973] and referred to the growing gap related to an initial comparative advantage. The second referred to Blau and Duncan [Reference Blau and Duncan1967] and could be described as continuous exposure to similar circumstances. Diprete and Eirich argued that “the Blan-Duncan approach can be generalized to variables conceptualized as exposures over some (possibly long) duration to a treatment.” While the transmission of wealth through inheritance and large inter-vivos transfers essentially at play for the intergenerational reproduction of the capitalist/employee divide represent a Merton-like CAD process, the differentiation produced by wealth accumulation within the employee class may be largely linked to the Blau-Duncan’s CAD process. Our purpose here was to focus on this latter form of CAD.
Facing economic insecurity through wealth accumulation: a major dimension of class inequality
The importance of wealth for capturing the extremes of the social hierarchy has been key in Savage et al.’s [2013] critiques of the Erikson Goldthorpe Portocarero (EGP) class schema. This argument is part of a wider set of criticisms of the EGP class schema that we consider important to take into account.
On the one hand, the ESeG class schema has been criticized for not capturing the recent developments in the labor market as well as horizontal divides [Oesch Reference Oesch2006]. On the other hand, as far as wealth is concerned, Savage’s new class typology constitutes the most ambitious set of sociological reflections to tackle the challenge posed by Piketty’s findings to class analysis to date, even if they have been elaborated before the latter published his (first) magnum opus Capital in the Twenty-First Century.
In our view, Savage et al. have made decisive contributions to adapting class analysis to contemporary inequalities. By introducing age, they make room in the analysis to account for the resources that have been accumulated by individuals and households during their life course. It is all the more important to take this dimension into consideration because it not only contributes to framing social capital and cultural capital but is also key for understanding the distribution of wealth, at least for the largest share of the social structure. The same applies to the specific attention that Savage et al. pay to the extremes of the class hierarchy (the elite and the precariat). A consideration of wealth can contribute to shedding light on the tangible advantages and disadvantages of these groups.
Yet, we argue that there is a methodological issue at play here. The number of variables necessary to capture the multiple dimensions of class put forward by Savage et al. may make cross-country comparisons problematic, with each set of data leading to a different class typology, preventing any systematic comparison. We agree with Connely, Gayle and Lambert [Reference Connely, Gayle and Lambert2016] that “there is no strong empirical evidence that dissuades us of the extremely high value of using existing occupation-based measures in the secondary analysis of large-scale social surveys” [Ibid.: 3]. However, this should not keep us from trying to propose a strategy that cumulates the advantages of the occupational group-based class schema, on the one hand, and the expansion of class criteria regarding age and wealth, on the other.
To sum up this discussion, we consider that Savage is correct in saying that room has to be made for wealth and, more generally, resources, in class analysis, given the magnitude of the wealthization of Western late-industrial societies [Chauvel et al. Reference Chauvel, Bar Haim, Hartung and Murphy2021], as suggested by Piketty. Yet, not only given its methodological advantage for cross-country comparison but also for the hypotheses it allows researchers to make when a) the prospective elements of the service class are taken into account, and b) the wide range of outcomes that class analysis is aimed at explaining, we consider that the occupational classes are a relevant analytical tool. Class is closely related to economic security and the capacity to maintain a certain social position, as Golthorpe put forward regarding the prospective rewards associated with service-class positions. What we want to capture through the study of between-class inequality in relative levels of wealth and income is the level of security vis-à-vis labor market fluctuations, life-cycle events, and cuts or instability in public transfers. Wealth brings inertia and memory to the analysis of inequality [Forrester Reference Forrester1961; Skopek Reference Skopek2015]. It is a proxy for the capacity of maintaining a certain social status over time [Spilerman Reference Spilerman2000].
From a theoretical standpoint, this focus is related to what Bourdieu addresses through the idea of the inertia of economic conditions and the complex relationship between one’s actual conditions and one’s anticipations. More precisely, in his early works on the Algerian working-class, Bourdieu linked the way social actors envisioned their future with their material and economic conditions. He recalled that “the attitude toward the future [being] objectively rooted in the material conditions of existence” was a major principle of social differentiation [Bourdieu Reference Bourdieu1977: 8]. These under-exploited aspects of Bourdieu’s thought are worth mentioning because they provide a basis for considering the way one is objectively and subjectively located within the social hierarchy. A young professional or manager may not be rich in terms of wealth, but their high income associated with stable employment conditions makes a future of accumulation highly probable. On the contrary, a self-employed person could enjoy a rather specific position given the importance of wealth as compared to their income. Wealth can provide them with greater stability than their income could, and even provide the ability to transmit their status to their offspring in a way that is unparalleled by other groups. However, any general stance on the impact of wealth on class and inequality has to take national variations into account, particularly the relative weight of the main residence among households’ wealth accumulation.
Cross-country comparison and wealth portfolio decomposition
Cross-country comparisons display a noteworthy discrepancy between wealth and income inequality levels. In this respect, Pfeffer and Waitkus [2021] have raised a critical point:
A first step towards an explanation of this cross-national variation in wealth inequality and concentration should begin with an assessment of the role of individuals and assets components. Much like our understanding of cross-national differences in labor income or, instead, from cross-national differences in transfer income, our understanding of international variation in wealth inequality depends on how different assets components contribute to it [Ibid.: 14].
In particular, they showed that “the decomposition results establish the dominant role of the distribution of housing wealth in explaining national levels of wealth inequality and concentration” [Pfeffer and Waitkus Reference Pfeffer and Waitkus2021: 24], leading us to highlight the importance of this feature of wealth accumulation from a cross-national perspective. This preoccupation is also consistent with the literature that showed that national contexts frame accumulation patterns through institutional factors, such as credit market regulations [Dwyer Reference Dwyer2018; Krippner Reference Krippner2017]. On the other hand, levels of homeownership also have an impact on the marketable wealth available [Davies and Shorrocks Reference Davies, Shorrocks, Atkinson and Bourguignon2000]. A household’s ability to engage in easy consumption in case of economic shocks depends not so much on its overall wealth level than on its marketable wealth as defined by assets immediately available for spending.
Data, Variables, and Main Indicators
The household financial and consumption survey [wave II]
We used the Household Financial Consumption Survey [2014 wave] of the European Central Banks network for this study. Its main advantage was to allow us to capture the distribution of wealth and its variations with other economic and social characteristics [Humer et al. 2016], thanks to nationally representative samples of European households. The HFCS collects information on assets, liabilities, income, and consumption of households, providing insights into their economic behavior and financial situation. The survey’s second wave was based on 84,000 interviews conducted in 18 eurozone countries, as well as Poland and Hungary, mainly in 2013 and 2014.
Surveys have been criticized as being less reliable than administrative data [Piketty Reference Piketty2020: 704-705], especially insofar as they are subject to sample selection problems. The sample sizes of typical surveys are small, especially at the very top of income distribution. Furthermore, non-missing at random bias may affect the results. However, we considered the HFCS data as relevant for our purpose for several reasons.
First, the HFCS employs administrative data and oversampling of rich households to improve the sample design [Eckerstorfer et al. Reference Eckerstorfer, Halak, Kapeller, Schütz, Springholz and Wildauer2015: 2; HFCS 2016]. Each national survey team provides multiply imputed values for every key variable, following a pre-established methodology and using common software tools. This allows for the use of all collected information rather than being limited to the sample units that answered to each variable of interestFootnote 2 , Footnote 3. Second, because we tried to capture between-occupational group inequality, our research questions were not sensitive to missing information that would affect inequality levels within the groups at the very top of the distribution or the total wealth estimates. Last, using medians and quantiles avoided results that would be too sensitive to extreme values. Moreover, we considered the levels of inequality between those at the top of the wealth distribution and the others as minimal approximations of actual disparities.
Main variables of interest (wealth, income, ESeG)
Here, we studied income and wealth inequalities between occupational groups and their contribution to the link between income and wealth, mainly through the use of four survey variables: annual household gross incomeFootnote 4, total household net wealthFootnote 5, total household gross wealth, and occupation status of the reference person, wherein the ISCO-08 code allows us to implement the ESeG nomenclatureFootnote 6. We processed the multiply imputed data according to Rubin’s rule [Rubin Reference Rubin1987]Footnote 7 and used the replicate bootstrap weights provided with each national sample to gain correct variance estimatesFootnote 8.
For greater clarity and as a preliminary step of analysis, we constrained this study to five European countries for which the HFCS presented large samples (11,000 for Finland, 12,000 for France, 4,500 for Germany, 5,400 for Ireland, 6,200 for Spain) and showed ESeG distributions similar to those drawn from two other cross-national surveys: the Labor Force Survey [2011] and the Adult Education Survey [2011]Footnote 9.
These five countries represented four clusters of countries according to the welfare regimes typology of Esping-Andersen [Reference Esping-Andersen1990]. Spain is an example of a Mediterranean country [Ferrera Reference Ferrera1996] with a low level of decommodification and a high familiarization of welfare provision. Finland is a social-democratic regime characterized by a high level of decommodified welfare services, whereas Ireland is closer to the liberal and highly commodified case. France and Germany belong to the conservative regime cluster shaped by insurance-based welfare provision in strong association with family values and intervention.
Gross income and net wealth measured by ESeG in HFCS for the selected countries
Wealth is a household-level measure clearly distinct from income. Killewald, Pfeffer, and Shachner [2017] claimed that “given the theoretical centrality of the claim that wealth captures aspects of economic well-being distinct from income, the lack of a well-established wealth-income correlation estimate is surprising” [Killewald, Pfeffer, and Shachner: 388-389]. Our data confirmed the relevance of the distinction between income and wealth, as the linear correlation between total household net wealth and gross annual income was strong but not collinear (r = 0.35). Calculated as the linear correlation between the individual rank among net wealth and gross income distributions, Spearman’s correlation between net wealth and gross income was higher than its Pearson counterpart but did not exceed 0.5 (ρ = 0.48).
As a consequence, the story of economic inequality depicted by an income-centered analysis may not be the one that can be told by looking at wealth accumulation. First and foremost, taking wealth into account moved the inequality scale; at an aggregated level, the interquintile ratio was 3.6 for gross income and 58.5 for net wealth.
The comparison of each ESeG’s median gross income showed similar relative differences between-countries and within-countries (Figure i). Putting the cases of the unemployed aside, the median gross income in Germany and Finland was about twice as high as in Spain, but the income hierarchy between each group was quite similar in these countries. For instance, the ratio of managers’ median income to low-status employees’ median income ranged from 1.8 in Finland to 2.4 in Spain. With the exception of Ireland, small entrepreneurs were between the technicians and the skilled service or industrial workers in terms of median household income.

Figure 1 Median annual gross income by ESeG at the country level (ppp)
Note: Values expressed at purchase parity power. The vertical lines specify the 95% confidence intervals. Levels of wealth and income are weighted by Eurostat ppp coefficients for the survey year of each country.
Population: People in the labor force aged 18 years or older living in Germany, Finland, Metropolitan France, Ireland, or Spain.
Source: HFCS, wave II.
While the relatively low precision of the estimations for small entrepreneurs in Spain cannot be ignored, the wealth hierarchy between each group seemed quite close in the selected countries, with the notable exception of Ireland, where the net wealth of managers was relatively low (Figure 2). As far as median gross income and median net wealth were concerned, each ESeG seemed to be in a homologous position with the social structure in Finland, France, Germany, and Spain. Contrary to the results shown by the median gross income, the median net wealth situated small entrepreneurs in the higher stratum of the workforce, with a considerable difference between them and other ESeG in the Irish context.

Figure 2 Median net wealth by ESeG at the country level
Note: Values expressed at purchase parity power. The vertical lines specify the 95% confidence intervals. Levels of wealth and income are weighted by Eurostat ppp coefficients for the survey year of each country.
Population: People in the labor force aged 18 years or older living in Germany, Finland, Metropolitan France, Ireland, or Spain.
Source: HFCS, wave II.
Postponing the extension of the analysis to the entire set of countries available in the HFCS, we, therefore, considered that the empirical evidence was robust enough to start our analysis at a more aggregated level and focus on the interaction between income, wealth, and ESeG by the introduction of the wealth-to-income ratio.
Empirical Results
Class inequalities in relative wealth accumulation
First and foremost, our data confirm the specific relationship with wealth that small entrepreneurs have, as well as the advantage provided to the service class. The value of our analysis is that it provides a measurement of between-group inequality thanks to the wealth-to-income ratio. Moreover, this analytical tool helps us distinguish between skilled white-and blue-collar workers and non-skilled manual workers and the unemployed. More precisely, the most salient difference is found between groups in which almost all members succeed in accumulating wealth and those where only some members do, giving rise to higher heterogeneity among these latter.
The net wealth-to-income ratio for households in the labor force ranged from 5.5 for small entrepreneurs (5.5 years of accumulated income) to 0.7 for households whose reference person was unemployed (8.5 months) (Figure 3). The gap between small entrepreneurs and top wage-earners was as large as the inequality observed between the polar opposites of the wage-earner groups, highlighting the sociological relevance of the classic divide established by the ownership of the means of production. The results nevertheless showed significant inequalities among employees, with a three-level structure differentiating managers and professionals, skilled white- and blue-collar workers (technicians and associate professionals, skilled service or industrial employees), and the last group constituted by low status workers and the unemployed.

Figure 3 Median total net WIR by ESeG
Note: Household net wealth expressed in number of years of household current gross income. The vertical lines specify the 95% confidence intervals.
Population: People in the labor force aged 18 years or older living in Germany, Finland, Metropolitan France, Ireland, or Spain.
Source: HFCS, wave II.
Managers achieved a fairly high level of absolute and relative accumulation, leading to a median WIR of 3 years. The median household of each intermediate ESeG group also managed to save a substantial amount of net assets, with a ratio from 1.4 years to nearly 2 years of gross income, a result highly reminiscent of Piketty’s “patrimonial middle class.” Last but not least, we found our last group at a considerably lower level of relative accumulation, with a median net WIR equal or lower to 1 year of gross annual income.
Hence, half of the low status workers had a WIR of less than 0.9, and a large heterogeneity was observed among the ESeG (Table i). Excluding the specific case of small entrepreneurs, the intragroup dispersion increased when we climb down the social scale, from an interquartile ratio of 5.9 (managers and professionals) to a ratio of 31.8 (low-status workers).
Table I Intragroup dispersion of total net WIR

Note: Interquartile gap and ratio refer to the difference and ratio between the 3rd and the 1st quartile, calculated for each ESeG. Household net wealth expressed in number of years of household current gross income. The vertical lines specify the 95% confidence intervals.
Population: People in the labor force aged 18 or over living in Germany, Finland, Metropolitan France, Ireland, or Spain.
Source: HFCS, wave II.
The quite similar interquartile gap of around 4 for all employees but managers and professionals indicated that the weight of workers with a very low net wealth in each included ESeG was a key analytical point. Most managers and technicians succeeded in accumulating a substantial amount of economic resources or were on their way to doing so, whereas half of the low-status workers, and a quarter of the skilled service workers, skilled industrial workers, and technicians, faced much more significant obstacles in accumulating a net wealth of any significant amount through their annual income.
After having highlighted between-group inequality and within-group heterogeneity in relative wealth accumulation, we turn our attention to wealth as a buffer against economic shocks. This dimension, central in the social functions of wealth before the rise of the welfare state, is once again becoming key in an era of “permanent austerity” [Pierson Reference Pierson2002], where savings become necessary to smooth out the restrictions of welfare protection against social risks. Thus, we aim to provide a clearer picture of the contribution of wealth to economic well-being and security. Gross wealth, excluding household main residence and valuables, could be taken into account to provide insight into the “disposable wealth” relative to annual income, an indicator that may be a better proxy than the total net WIR to analyze the buffer provided by economic accumulation.
The findings are convergent with the ones put forward in the first step of our empirical analysis. This median gross disposable WIR showed a similar pattern to the total net WIR. A four-level structure differentiated small entrepreneurs (2.5), managers and professionals at a level that was half that of the former group (1.2), technicians and skilled workers (0.4 to 0.6) and, finally, low status workers and the unemployed with nearly no gross disposable wealth compared to their annual income (0.2 and 0.1) (Figure 4). As for total net WIR, the heterogeneity shown by the interquartile ratio grew when we climbed down the social scale, and the interquartile gap remained close for all wage-earners (around 1.3), except for managers and professionals (Table ii).

Figure 4 Median gross disposable WIR by ESeG
Note: Gross household disposable wealth (gross wealth excluding household main residence and valuables), expressed in number of years of household current gross income. The vertical lines specify the 95% confidence intervals.
Population: People in the labor force aged 18 years or older living in Germany, Finland, Metropolitan France, Ireland, or Spain.
Source: HFCS, wave II.
Table II Intragroup dispersion of gross disposable WIR

Note: Interquartile gap and ratio refer to the difference and the ratio between the 3rd and the 1st quartile calculated for each ESeG. Gross household disposable wealth (gross wealth excluding household main residence and valuables) expressed in number of years of household current gross income. The vertical lines specify the 95% confidence intervals.
Population: People in the labor force aged 18 years or older living in Germany, Finland, Metropolitan France, Ireland, or Spain.
Source: HFCS, wave II.
For all ESeG, the WIR considerably fell when the main residence and valuables were excluded from the considered types of assets. The picture drawn in terms of a safety net noticeably differed from the one based upon total net wealth: nearly half of the technicians, and an even lower share of the skilled white-collar or blue-collar workers, held a sufficient amount of gross wealth to endure the loss of 6 months of their current gross income (Table iii). The median disposable WIR for low status workers barely reached 0.2, i.e. equivalent to around 10 weeks of their gross household income.
Table III Horizon scale

Note: Results from figure XII. Median gross disposable WIR of six months or less are located below the grey cells; above the grey cells: median gross disposable WIR higher than one year.
Population: People in the labor force aged 18 years or older living in Germany, Finland, Metropolitan France, Ireland, or Spain.
Source: HFCS, wave II.
International Variations in Class-Relative Wealth Accumulation
A relevant part of the aforementioned intragroup heterogeneity may be due to the different positions of the households within their life course. Given the sample at our disposal and the level of international variations in socioeconomic contexts and institutional arrangements, it was, however, of crucial importance to address the national dimension before considering the issue of an unequal accumulation trajectory among the social structure in general.
The low number of small entrepreneurs in each country and the very high dispersion of their income and wealth led to very large confidence intervals. Therefore, we focused our further analyses on our six wage-earner groups. Thus, our analysis clearly followed the analytical path of Golthorpe’s class schema where the divide between small entrepreneurs and wage-earner groups coexists with internal divides within the latter group.
Most of our five national samples revealed the previously identified structure, distinguishing managers and professionals, skilled workers and technicians, and low status workers and the unemployed.
The overall level and ESeG structure of the median net WIR nevertheless allowed us to differentiate between three kinds of national contexts: the main group of three countries (Finland, France, and Germany), with a pattern similar to the overall results; Ireland, where the median WIR was considerably lower than in the other four countries, with results ranging from 0.5 (managers) to 0 (low status workers and the unemployed), and a median net WIR of 0.2 for skilled white and blue-collar workers (Figure 5); lastly, Spain, where the median WIR seemed to be far higher and the between-ESeG inequality much lower than in the other countries. Even neglecting the overlapping confidence intervals, the observed between-ESeG differences were considerably lower in Spain than in the other national samples.

Figure 5 Total net WIR by ESeG and country (median)
Note: Household net wealth expressed in number of years of household current gross income. The vertical lines specify the 95% confidence intervals.
Population: People in the labor force aged 18 years or older living in Germany, Finland, Metropolitan France, Ireland, or Spain.
Source: HFCS, wave II.
Consistent with the results observed for the net WIR, the rate of household main residence (HMR) ownership was positively correlated with the position within the occupational hierarchy, with a difference of 20 to 30 points between managers and low-status workers, except in Spain. In Finland, the HMR ownership rate was noticeably higher than in France or Germany, whereas this indicator tended to be lower in Germany than in France, above all for the higher-wage-earner categories (Figure 6). Germany was the only country where just over half of managers and technicians own their main residence. The disposable WIR, however, indicated the existence of a certain substitution effect between HMR ownership and disposable wealth, the disposable WIR in Finland being lower than in France or Germany for all considered ESeG, and the disposable WIR being higher in Germany than in France or Finland for technicians and skilled service or industrial workers (Figure 8).

Figure 6 Household main residence ownership by ESeG and country
Population: People in the labor force aged 18 years or older living in Germany, Finland, Metropolitan France, Ireland, or Spain.
Source: HFCS, wave II.
The international variations of the main residence ownership rate and of the credit market structure are two critical dimensions necessary to understanding the differences observed in the net WIR at a comparative level. The high level of HMR ownership (Figure 6) and very low net WIR in Ireland did not result from a particularly high household income (Figure i) but from the high debt levels prevailing in this country, superior to those registered in Germany, France, or Finland for all currently employed ESeG individuals (Figure 7).

Figure 7 Median total debt by ESeG and country (ppp)
Note: Values expressed at purchase parity power. The vertical lines specify the 95% confidence intervals.
Population: People in the labor force aged 18 years or older living in Germany, Finland, Metropolitan France, Ireland, or Spain.
Source: HFCS, wave II.
The specific features of Spain were linked to relatively low income levels (Figure i) and, above all, the widespread ownership of the HMR in most social classes: 80% of managers or any of the skilled worker groups own their main residence. This was even the case for nearly three-quarters of the low-status workers and two-thirds of the unemployed (Figure 6), leading to considerably less inequality, as far as the total net WIR was concerned. As for Ireland, this situation nevertheless rested upon high levels of private debt and a debt-to-income ratio even higher for lower-status workers than for managers and professionals (Figure 8). This country-specific result led us to qualify the social consequences associated with wealth accumulation: the Spanish popular classes had to challenge a “debt wall” that made them particularly vulnerable to income shocks and real estate crises. Property did not always set people free.

Figure 8 Median debt to income ratio by ESEG and country
Note: Household total debt expressed in number of years of household current gross income. The vertical lines specify the 95% confidence intervals.
Population: People in the labor force aged 18 years or older living in Germany, Finland, Metropolitan France, Ireland, or Spain.
Source: HFCS, wave II.
The ambivalence of HMR ownership mentioned in the discussion of the Spanish results made the disposable gross WIR particularly relevant to the issue of economic insecurity and wealth accumulation. The inter-country differences for unskilled and skilled workers (including technicians and associate professionals) were considerably lower than those for the total net WIR (Figure 9). In France, Ireland, and Finland, half of this group had a gross wealth equivalent to less than three months of gross income at their disposal. Due to their relatively more liquid saving portfolio, their German counterparts reached almost 6 months of their annual income, except for low status workers and the unemployed.

Figure 9 Median disposable WIR by ESeG and country
Note: Household net wealth expressed in number of years of household current gross income. The vertical lines specify the 95% confidence intervals.
Population: People in the labor force aged 18 years or older living in Germany, Finland, Metropolitan France, Ireland, or Spain.
Source: HFCS, wave II.
Intergenerational co-residence practices and, above all, a later departure from the parental home led to differences in the age profile of the national sample, specifically between Spain and the remaining countries. The structural effect associated with the age of the reference person explained about one-third of the observed difference between the median disposable WIR in Spain and the French, Finnish, or Irish oneFootnote 10. For the moment, the uncertainty of the estimates for Spain made it difficult to proceed any further in the study of this specific result.
Lifecycle dimension of relative wealth accumulation inequalities by class
The gap in net WIR between the two poles of the social structure grew during the life course from 7 months of household income at 18-34 years to 3 years at 50-64 years, even if low status workers entered the labor market much earlier than managers and professionals (Figure 10). Having rather stable life conditions and entering the labor market earlier, the HMR ownership rate of young technicians was higher than the observed rate for young managers (32% versus 24%) (Figure 11). The low status workers achieved a median net WIR of 2.1 at the last stage of their working life (Figure 10), a feature which indicated that half of this group acquired ownership of their main residence (Figure 11).

Figure 10 Median total net WIR by age and ESeG
Note: Household net wealth expressed in number of years of household current gross income. The vertical lines specify the 95% confidence intervals. The estimated medians for small entrepreneurs were higher than for managers and professionals, with quite large confidence intervals (18-34 years: 2.05; 35-49 years: 4.40 and 50-64 years: 7.85).
Population: People in the labor force aged 18 years or older living in Germany, Finland, Metropolitan France, Ireland, or Spain.
Source: HFCS, wave II.

Figure 11 Household main residence ownership by ESeG and age
Population: People in the labor force aged 18 years or older living in Germany, Finland, Metropolitan France, Ireland, or Spain.
Source: HFCS, wave II.
The gross disposable WIR clearly showed that young workers of all ESeG were highly exposed to economic shocks and variations of their access to public or familial transfers: young managers had 6 months of their current income at their disposal, with the perspective of crossing the 1-year line between 35 and 49 years of ageFootnote 11. For the young adults of all other ESeG, the disposable WIR was even lower, corresponding to 3 months of income among the skilled white and blue-collar workers, 5 weeks for the low status workers, and 3 weeks and a half for the unemployed.
Ultimately, only managers and small entrepreneurs succeeded in obtaining economic security independently of public safety nets or formal or de facto job security. The median gross disposable wealth of the three categories of skilled workers was around 9 months between 50 and 64 years of age and about six months for the low status workers. The contrast observed between the median net WIR and the disposable WIR for the older unemployed workers showed that nearly all of their accumulated economic resources depended upon their HMR in the case where they were owners.
Consistency between received and expected inter-household transfers and relative wealth accumulation
As far as the relationship with economic insecurity was concerned, the Odds Ratio of having a disposable WIR of more than 1 year (39% of the labor force) rather than a disposable WIR of less than 1 month (22% of the labor force) showed deep inequalities between the three strata of our sample (Table iv): higher than 10 for small entrepreneurs (25.6) and managers (13.5), between one and three for technicians (3.3), skilled service employees (1.5), and skilled industrial employees and, finally, largely lower than one for low status workers (0.6) and the unemployed (0.4).
Table IV Received/expected inheritance and disposable WIR by ESeG

These results are consistent with indicators of inter-household financial transfers. Received and expected inheritance and large gifts, and the ability to access financial assistance from friends and relatives: regardless of which variable was considered, the ESeG typical for strong wealth accumulation remained at the top of the probability distribution, and their lower counterparts remained at the lowest level of the scale. Managers and professionals appeared to be in a particularly privileged position, with two-fold differences between them and low-status workers or the unemployed.
The rate of small entrepreneurs or managers who received a large gift or an inheritance within the last 3 years (4 of 10) was markedly higher than that of other ESeG (between 19% and 28%). Among managers or small entrepreneurs who received such financial transfers, the median value of their inheritance or large gifts (about €40,000) was twice as high as the median amount declared by others considered ESeG (about €20,000)Footnote 12. Yet, expected inheritances were still more frequent among managers than among other ESeG, even if the gap was slightly smaller than that for other variables.
Perhaps due to a rather more popular ascendency than skilled service employees, skilled industrial workers showed results similar to those of low status workers and the unemployed, as far as intergenerational transfers were concerned. On the contrary, regarding the ability to access financial assistance from their friends and relatives, which was potentially less reliant on intergenerational transfers and referred to lower amounts of money, skilled industrial workers seemed closer to skilled white-collar workers than to low status workers. More or less, four in ten low status workers and unemployed individuals had less than 1 month of income at their disposal, and 64% of them moreover thought they could not access financial assistance from friends or relatives: this was 40 points below the estimated result for managers and professionals.
To conclude with our empirical results, the disposable wealth-to-income ratio clearly converged with various indicators of actual or expected inter-household transfers (Table v). The financial insecurity of households with a disposable WIR lower than 1 month of their annual income was confirmed: 32% of them could count on private financial support, and 19% thought they would receive an inheritance in the future, whereas 68% of those with a disposable WIR higher than one year and 32% of those with a disposable WIR lower than one year of their annual income were in this situation, respectively. The link between the reception of large gifts or inheritances and the level of disposable WIR also appeared clearly: 42% of those with a disposable gross wealth superior to 1 year of their gross income received an inheritance or a large gift within the past 3 years, compared to 11% of those with a disposable WIR of less than 1 month.
Table V Main residence ownership and effective/potential interhousehold transfers by level of disposable Wealth-to-Income Ratio

Note: 42% of those who have disposable WIR greater than one year have received a large gift
Population: People in the labor force aged 18 years or older living in Germany, Finland, Metropolitan France, Ireland, or Spain.
Source: HFCS, wave II. 42% of those who have disposable WIR greater than one year have received a large gift.
Towards a Dynamic Analysis of Between-Groups Wealth Inequality
Representing the class structure
In this paper, we have developed a strategy intended to show that the study of wealth’s relative weight compared to income leads to a more finely grained picture of class inequality in Europe than available typologies. Our purpose was to contribute to overcoming a key feature of contemporary sociology, most clearly put forward by Chauvel et al. [2021]. He argued that “although many scholars conceptualized mixed occupational and resource approaches, social class today is—for both men and women—more a question of what one does than of what one owns. In this context, the role of wealth is more systemic than the role of labor income; as the result of accumulated incomes over a lifetime and as a source of investments in the future, wealth can be transmitted from one generation to the next.” Yet, this stance faced a lack of empirical operationalization, and there was a risk of shifting from one focus (occupation) to another (resources). To the contrary, we argue that both occupation and resources interplay in the framing of class structure. Our analysis was centered on a strategy aimed at measuring between-groups inequality in relative wealth accumulation. This empirical strategy was aimed at putting forward a renewed picture of the class structure––one that made room for the dynamic dimension embedded in wealth. Usually, this life-cycle dimension of wealth prevents it from being objectively recorded, contrary to the high visibility and measurability of the occupation-based structure. Thus, we argue that some of the theoretical dilemmas of class analysis can, at least partially, be overcome by such an empirical strategy.
The main result of our paper was to distinguish between three class clusters that appeared to have highly unequal wealth accumulation paths. As expected, small entrepreneurs are in a specific situation in our capitalist societies, situated between employers and employees, and detaining a share of professional capital. Managers and professionals follow dynamic accumulation patterns along the life-cycle. Technicians, skilled service employees, and skilled industrial workers have access to moderate yet genuine opportunities to accumulate wealth, whereas most low-status employees and the unemployed do not have such opportunities and remain trapped with very low relative levels of wealth. In decomposing class by age groups, sharp differences in relative wealth accumulation appear. This was even clearer when the main residence and valuables were taken out of the wealth portfolio (disposable wealth); only managers and professionals at intermediate and older ages had accumulated more than 1 year of income, whereas median to low-status employees and the unemployed have less than 6 months of their income at their disposal (Figure 12). In disposable wealth, technicians, skilled service employees, and skilled industrial workers had accumulated between 6 months and a year of their income at their intermediate and older ages.

Figure 12 Median disposable WIR by age and ESeG
Note: Household net wealth expressed in number of years of household current gross income. The vertical lines specify the 95% confidence intervals.
Population: People in the labor force aged 18 years or older living in Germany, Finland, Metropolitan France, Ireland, or Spain.
Source: HFCS, wave II.
The picture of social divisions that has emerged from the empirical analysis highlights two opposite features. On the one hand, service class members are in a position to accumulate wealth over the entirety of their life-cycle. Lower intra-group heterogeneity among managers and professionals demonstrates that long-term benefits associated with the salariat are key to entering a cumulative advantage process where a stable position in the labor market allows one to enter or maintain a position in the patrimonial middle-class. On the other hand, the divide between the lower classes and the relative as well as absolute disadvantage of non-skilled manual workers and the unemployed highlight that a massive new precariat has emerged, particularly among younger generations [Mayer, Reference Mayer2009]. The destabilization of labor markets and the return to market-based provision leads to vulnerabilities over the entirety of the life-cycle [Spini, Bernardi and Oris Reference Spini, Bernardi and Oris2017].
This element of context helps us understand why we have given so much attention to the sense of security provided by wealth across and among groups. Thus, our analysis has made room for a key concept in a context that is not only useful for the study of wealth inequality [Ballestra and Tonkin Reference Ballestra and Tonkin2018] but also for capturing the unequal effects of collective life-cycle destabilization and the dynamic dimension of jobs and family break-ups along the life span [Western et al. Reference Western, Bloome, Sosnaud and Tach2012]. Our decomposition of wealth into disposable and non-disposable wealth indicated that wealth can play the role of a buffer for various class members and age groups. A strict social and age gradient appeared to be a way of addressing the issue of insecurity through a strict comparison between classes and age groups. The huge differences in the time horizon induced by the relative wealth accumulation (WIR) between older managers, professionals, small entrepreneurs, and the precariat composed of the unemployed and lower-status workers was highly meaningful. The capacity of a large proportion of employees to maintain their standard of living independently of social assistance was highly vulnerable to individual or collective economic shocks. These results were all the more important given that work casualization goes hand to hand with the rewealthization [Chauvel et al. Reference Chauvel, Bar Haim, Hartung and Murphy2021] in industrial societies.
A final aspect that the richness of the data clearly highlighted was the opportunity it provides to compare objective and subjective variables. Our results confirmed that the class hierarchy of wealth accumulation, on the one hand, and anticipated inheritances or gifts, on the other, were closely related, suggesting a rigidity key to the study of the wealth component of inequality. Subjective data confirmed the relevance of an interpretation of the data and the results in a dynamic way; people’s actual power and control over wealth was a good indicator of their anticipation of control and power in the future, for them as well as their offspring. Here, we followed and distinguished ourselves from Piketty quite clearly. We confirmed his stance that inheritance expectations go hand in hand with an increasing rigidity of the social structure. The higher the location within the ESeG hierarchy, the more often one expects an inheritance in the future. This was an illustration of the contemporary relevance of Balzac’s character Rastignac’s dilemma: inherit or work. Yet, our data revealed a more complex picture than this binary choice. Precisely because the patrimonial middle class has risen, anticipations to receive a gift have developed along the class spectrum. Inequalities matter, of course, but in a quite different way than in terms of an opposition between becoming a rentier and having nothing else but one’s work. This led us to consider an objective position with a sense of security and control over the future that is increased and not radically changed by inheritance. To inherit further increased the sense of security or insecurity that characterized a given position; it did not only matter as a distributive concern.
A dynamic approach to class: Bridging a twofold disciplinary gap and opening new roads for research
Our findings illuminated two disciplinary debates. On the one hand, we highlighted the value of an integrated picture of both economic and occupational dimensions of class. Striking disparities in the relative wealth accumulation structure and class inequalities emphasized the importance of a genuinely multidisciplinary approach to inequality. Yet, we were able to make differences and capture the fact that lower-middle-class households could have access to a limited but real wealth accumulation through their main residence. This was highly convergent with the historical finding regarding the rise of a patrimonial middle class in the 20th century. Not only did our empirical work shed new light on the class dynamics at play but it also allowed us to capture some of the consequences of this major social transformation.
On the other hand, if our main target was to bridge the gap between economic and sociological approaches to the study of socioeconomic inequality, our research also addressed theoretical issues at play within the sociological field. As seen in the literature section, the growing importance of wealth in inequality patterns has led Savage and Li [2021] to propose a new class map, theoretically based on assets and resources. This criticism of the occupation-centered vision of class has the great advantage of making room for the consideration of wealth and age in the study of contemporary inequality. Yet, it rests on inductive methods that do not fit with cross-country comparisons. Our analysis of the wealth-to-income ratio seemed to be the best possible approach to combining comparability and richness of perspectives on class. Thanks to the combined analysis of wealth relative to the income importance across class and age groups, we addressed what they called “the significance of wealth inequality,” i.e. “the way that its accumulation takes place over time, often long periods of time. Wealth thereby requires us to understand temporal dynamics over a long time period, moving away from cross-sectional analyses of social relationships” [Savage and Li Reference Savage and Li2021].
To conclude on this aspect, we argue that the occupation/resource debate in class analysis can be advanced by distinguishing three aspects. First, in terms of criteria, wealth matters in framing the class structure in our times. This is Piketty’s key assumption, until now awaiting a close empirical examination by sociologists. It is at odds with a purely occupation-based analysis of class structure. In terms of criteria, we tend to favor Savage and Li’s vision that makes room for the consideration of wealth and age. Yet, in terms of methodology and of ability to provide hypotheses that are fit for cross-country comparison, Golthorpe’s class schema proved to be not only useful but of absolute necessity. When the prospective rewards associated with a service class position are taken seriously, they appear to be a key element of the theory-driven class schema that is highly predictive of the overall ability of managers and professionals to accumulate wealth.
From a theoretical perspective, our class picture, even if it is firmly anchored in occupational class, makes room for a dynamic approach in which wealth accumulation patterns by class, as anticipated by inheritance expectations, available assistance, and the fate of older members of one’s group provide a sense of potential future outcomes. This dynamic vision of class, strongly related to one’s actual and potential economic resources, resonates with Bourdieu’s early works on Algeria. In these, he argued that class is not a fixed set of resources but a sense of the potential economic outcomes that are strongly related to one’s actual resources and ability to convert them into accumulation strategies of different types of capitals [Bourdieu Reference Bourdieu1974]. This reference is all the more important and illuminating that Bourdieu argues that actual resources and future outcomes coincide if, and only if, structural conditions do not change. The naturalized adaptation or adjustment of aspirations and outcomes is a particular case of a wider range of possible situations. This reminder is particularly important given that structural conditions in terms of wealth accumulation have changed over the past few decades. As Chauvel et al. [2021] recently put it: “loss of stability in careers and fluctuations in the labor market generate wage uncertainty and thus difficulties to make plans for the middle class […] One of the strongest transformations of the middle class is its relation to security, in terms of lifelong control of adverse events.” One has to remember that the data we used are not panel data, so the older members of each class group display only the opportunities open to their respective generations. Given job casualization and booming housing prices, it is very probable that their accumulation trajectories will not be available for younger members of the same classes.
Three distinct research directions could be envisioned to enrich the empirical elements we have gathered. First, the discrepancy between aspirations nurtured in different class settings and their actual opportunities has emerged as a decisive feature of contemporary European societies; its study would be a next step in the analysis. Secondly, studying the actual mechanisms at play in the framing of categorical inequalities in wealth accumulation over time would be a promising research direction. Bessière and Gollac [2020] have highlighted the extent to which the gender wealth gap was related to “reverse accountability” practices among layers. Such mechanisms of selective inclusion are at play in credit markets, and analyzing them could be conducive to understanding the institutional underpinnings of cross-country differences. Lastly, panel data are increasingly in use in cross-country comparisons. An EU-SILC data set could, for example, be used to capture dynamic aspects of class inequality among and between countries at EU levels, drawing attention to the national and class framing of trajectories [Blavier and Lebaron, Reference Blavier and Lebaron2017].
Appendix 1 ESEG national distribution of the sample
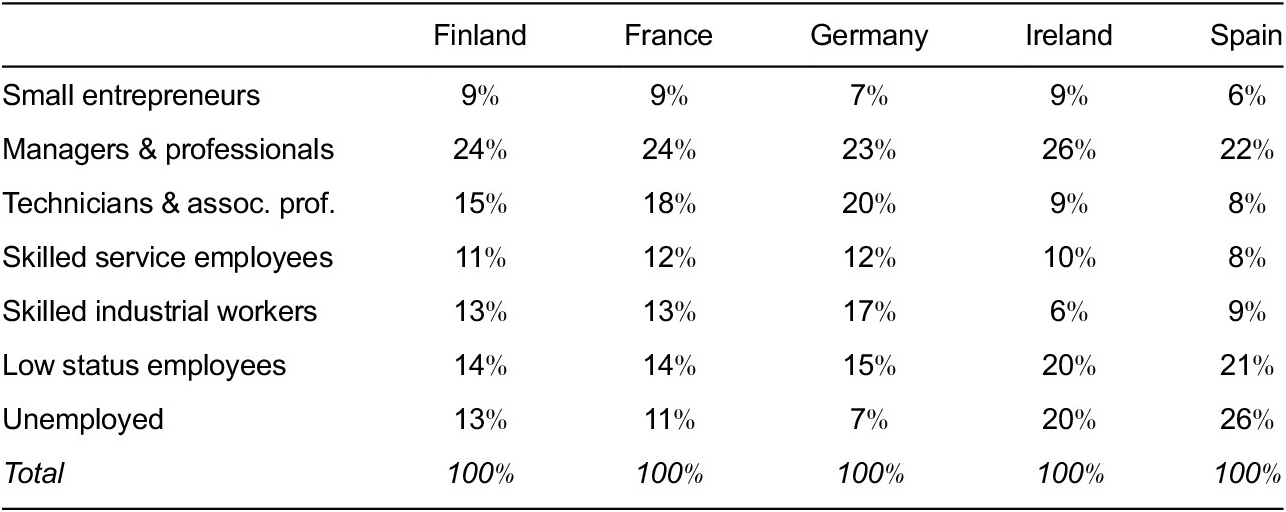
Population: People in the labor force aged 18 or over living in Germany, Finland, Metropolitan France, Ireland, or Spain.
Source: HFCS, wave II.
Appendix 2 Received large gift/inheritance during past 3 years

Two figures are in the file: one B&W and one in color to be on line
Population: People in the labor force aged 18 years or older living in Germany, Finland, Metropolitan France, Ireland, or Spain.
Source: HFCS, wave II.
Appendix 3 Gross and net Wealth-to-Income-Ratio by ESeG and Age
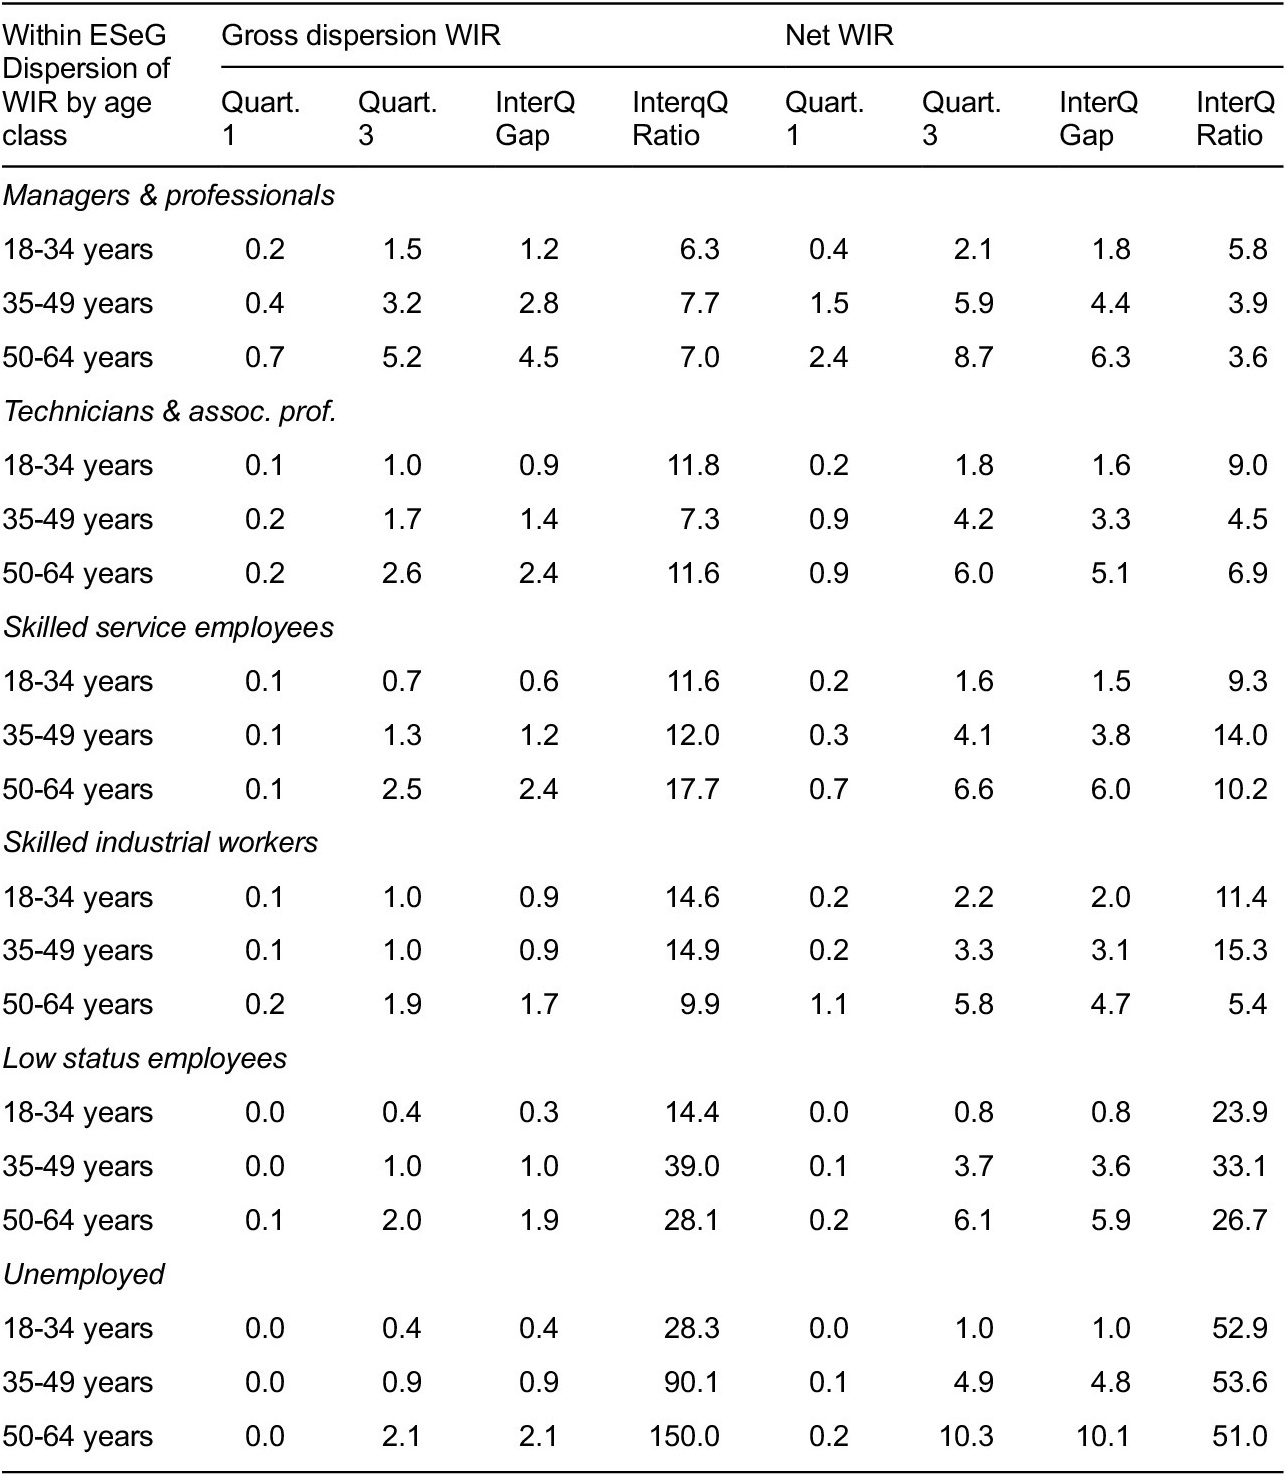
Note: Interquartile gap and ratio refer to the difference and the ratio between the 3rd and the 1st quartile calculated for each ESeG. Gross household disposable wealth (gross wealth excluding household main residence and valuables), expressed in number of years of household current gross income. The vertical lines specify the 95% confidence intervals.
Population: People in the labor force aged 18 years or older living in Germany, Finland, Metropolitan France, Ireland, or Spain.
Source: HFCS, wave II.


 Open access