


No CrossRef data available.
Article contents
X-Ray Fluorescence Analysis of a Manganese Ore
Published online by Cambridge University Press: 06 March 2019
Abstract
To replace time-consuming chemical analysis, a procedure was developed for applying X-ray fluorescence to the analysis of a manganese ore. This X-ray fluorescence method is rapid; the total time for both sample preparation and analysis is ½ hr. The method is also simple enough for routine laboratory use. The components determined, the concentration ranges, and the agreement between chemical and X-ray analysis in terms of standard deviation are:
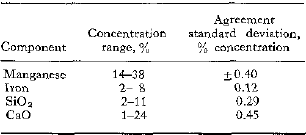
The agreements between chemical and X-ray analysis noted for manganese and iron are obtained by correcting for CaO concentration when determining the manganese and for manganese and SiO2 concentrations when determining the iron. The corrections employ empirical equations developed by a multiple regression technique.
Sample preparation is reduced to a minimum because it consists of only two steps, pulverization of the manganese ore followed by briquet ring. Four minutes of grinding with Boraxo as the grinding aid gives sufficient uniformity to minimize the effect of particle size variation. The ground mix of manganese ore and Boraxo is pressed into 1.25-in. briquettes for analysis.
- Type
- Research Article
- Information
- Copyright
- Copyright © International Centre for Diffraction Data 1967
References
1.
Hanon, J. and Winand, R., “Analysis of a Manganese Ore by X-ray Fluorescence. Calibration of the Method by Synthetic Mixtures,” Mem. Sci. Rev. Met.
62: 45, 1965.Google Scholar
2.
Mitchell, B. J. and O'Hear, H. J., “General X-ray Spectrographs Solution Method for Analysis of Iron-, Chromium-, and/or Manganese-Bearing Materials,” Anal. Chem.
34: 1620, 1962.Google Scholar
3.
Carl, H. F. and Campbell, W. J., “The Fluorescent X-ray Spectrographs Analysis of Minerals,” ASTM Spec. Tech. Publ.
157: 63, 1954.Google Scholar
4.
Rose, H. J., Adler, I., and Flanagan, F. J., “Suggested Method for Specuochernical Analysis of Rocks and Minerals Using an X-ray Spectrometer,” in: Methods for Emission Spectrovhtmical Analysis, ASTM, Philadelphia, 1964. p. 814.Google Scholar
5.
Alley, B. J. and Myers, R. H., “Corrections for Matrix Effects in X-ray Fluorescence Analysis Using Multiple Regression Methods,” Anal. Chem.
37: 1685, 1965.Google Scholar
6.
Mitchell, B. J. and Hopper, F. N., “Digital Computer Calculation and Correction of Matrix Effects in X-ray Spectroscopy,” Appl. Spectry.
20: 172, 1966.Google Scholar