


Implications
Vorderwald cattle have an extremely high proportion of introgressed genetic material (61.3%). The breeding organization of Vorderwald cattle is aware of this characteristic and wants to conserve the remaining native genetic material and consolidate the breed. Economical disadvantages of a breed contribute to its probability of extinction. Thus, advanced OCS seems to be the method of choice to retain native genetic material, genetic diversity and native genetic diversity while achieving a moderate rate of genetic gain to reduce the risk of extinction.
Introduction
In the middle of the 20th century, increasing inbreeding rates (ΔF) were identified as a threat to livestock breeding. The inbreeding rates were almost unsupervised, while the main aim was to maximize the genetic gain (ΔG) in most breeds. Consequences include reduced fertility and fitness as well as phenotypic expression of lethal alleles. Management of the ΔF and possibilities for its reduction have been widely discussed. Since its invention, optimum contribution selection (OCS) has been the gold standard for maximizing the ΔG while restricting the ΔF to a predefined level (Meuwissen, Reference Meuwissen1997; Meuwissen and Sonesson, Reference Meuwissen and Sonesson1998). Several authors have confirmed the superiority of OCS over truncation selection (Sonesson and Meuwissen, Reference Sonesson and Meuwissen2000; Weigel, Reference Weigel2001; Avendaño et al., Reference Avendaæo, Villanueva and Woolliams2003; Kearney et al., Reference Kearney, Wall, Villanueva and Coffey2004; Koenig and Simianer, Reference Koenig and Simianer2006; Gandini et al., Reference Gandini, Stella, Del Corvo and Jansen2014). Other authors have shown that introgression from commercial breeds endangers the originality of regional breeds (Hartwig et al., Reference Hartwig, Wellmann, Hamann and Bennewitz2014). In breeds with historical introgression, a standard OCS approach would lead to reinforced selection on introgressed alleles since carriers of introgressed alleles are less related to the population and superior in terms of breeding values (Wellmann et al., Reference Wellmann, Hartwig and Bennewitz2012). Consequently, regional breeds may become genetically extinct if a standard OCS method is used. Thus, Wellmann et al. (Reference Wellmann, Hartwig and Bennewitz2012) developed an advanced OCS (aOCS) method. aOCS facilitates the simultaneous management of the ΔG, ΔF, rate of native inbreeding (ΔFnat ) (Wellmann et al., Reference Wellmann, Hartwig and Bennewitz2012) and introgressed genetic material, that is, the migrant contribution (MC). In breeds under conservation, the major goals are originality, genetic diversity and uniqueness. At the same time, these breeds have economic disadvantages compared to commercial breeds. However, the profitability of a breed will contribute to its chances of conservation (Meuwissen, Reference Meuwissen2009). Therefore, aOCS is of great interest for breeds under conservation. Basic research on the appropriate exploitation of aOCS procedures has already been carried out (Wellmann et al., Reference Wellmann, Hartwig and Bennewitz2012; Wang et al., Reference Wang, Bennewitz and Wellmann2017a and Reference Wang, Segelke, Emmerling, Bennewitz and Wellmann2017b). Thus, this study will examine the possibilities of implementing aOCS in the actual breeding scheme of Vorderwald cattle, a model population with historical introgression. Our aim was a comparison with real data. Hence, a simulation study was carried out based on a breeding population that was actually available in the past. Advanced OCS was designed to maximize the ΔG under side constraints. A young sire breeding scheme was adopted for stochastic simulations. Similar schemes have been modeled by Gandini et al. (Reference Gandini, Stella, Del Corvo and Jansen2014). Various annual flows of replacement of proven sires (FoR strategy) will be examined, assuming that this factor will have an impact on the ΔG (Gandini et al., Reference Gandini, Stella, Del Corvo and Jansen2014). Additionally, we tested whether the extent of progeny testing of mature bulls (PT strategy) impacts the ΔG (Gandini et al., Reference Gandini, Stella, Del Corvo and Jansen2014) when applying aOCS. All simulation scenarios were carried out for overlapping generations. The major goals of this study were to (i) gather key information on the feasibility of aOCS under practical conditions of the actual breeding scheme of Vorderwald cattle, (ii) identify a superior FoR strategy and PT strategy combination that can be used in the actual scheme and (iii) examine whether historical breeding decisions to increase the ΔG by introgression from commercial breeds could have been avoided by using aOCS.
Material and methods
Base population
The raw data set, provided by the State Agency for Spatial Information and Rural Development Baden-Württemberg, consisted of 348 020 individuals with information on sex, breed, date of birth and estimated breeding values ( EBVs ) for the total merit index ( TMI ). In Germany, EBVs are standardized with a mean of 100 and a genetic SD of 12. We processed the raw data set for individuals with known EBVs and at least three equivalent complete generations (MacCluer et al., Reference MacCluer, Boyce, Dyke, Weitkamp, Pfenning and Parsons1983). Pruning the raw data set for these individuals resulted in a pedigree of 94 457 individuals born between 1938 and 2014. Individuals with an unknown pedigree and born before 1970 were defined as native founders with an MC of 0%. Individuals from foreign breeds or with an unknown pedigree and born after 1970 were defined as migrant founders with an MC of 100%. This assumption is based on the results of Hartwig et al. (Reference Hartwig, Wellmann, Hamann and Bennewitz2014). The authors’ results show that extensive introgression from foreign breeds to Vorderwald cattle started in 1970. After defining native and migrant founders, the MC was calculated with optiSel (Wellmann, Reference Wellmann2019) for all individuals included in the pedigree. The resulting pedigree was used for population analyses of the real population. To start the simulation process with the breeding population that was available in 1984, the real pedigree was cropped at that point in time.
General simulation process
The simulation process is visualized in Figure 1. Birth cohorts from 1985 to 2014 consisted of 3512 individuals on average. Thus, the simulation process was modeled with 3512 progeny per iteration to create a comparable population. The simulation process was carried out for 30 iterations to reflect 30 years. In Iterations 1 and 2, there was a lack of male descendants for restocking of proven sires (Figure 1). The cropped pedigree included solely proven sires, and the first fictitious male descendants could not be assumed to be mature. Thus, we subdivided the process into two stages. Stage 1 was carried out for two iterations to create fictitious male descendants. Fictitious males of the first iteration were assumed to be mature in Iteration 3 (Iteration 1 – pregnancy of dam; Iteration 2 – rearing). Hence, Stage 2 comprised an additional section to visualize the selection of mature bulls and subsequent progeny testing. Stage 2 was carried out for the 28 missing iterations. Both stages were carried out for overlapping generations. Each step in the iterative simulation procedure will be described in a separate section below (cf. Figure 1).
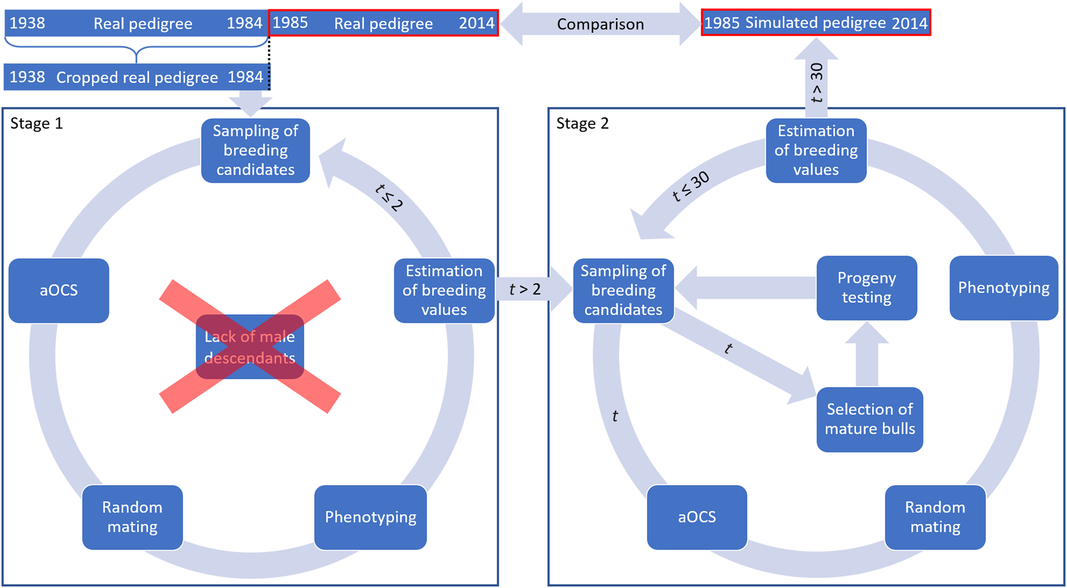
Figure 1 (Colour online) Schematic structure of the simulation process to create Vorderwald cattle populations comparable to real data – to start the simulation process, the available base population in 1984 was derived by cropping the real pedigree at that point in time. The simulation process was carried out for 30 iterations, equaling 1 year in reality. Thus, a fictitious pedigree was created by using aOCS that was comparable to real data. aOCS=advanced optimum contribution selection.
Sampling of breeding candidates
Each iteration of the simulation process started with the sampling of additional individuals to be labeled as deceased. This process was modeled to facilitate a realistic deployment of females. Sampling depended on an age distribution that reflected the demography of a cattle population and was carried out for discrete birth cohorts of 1 year. Birth cohort Bt consisted of all individuals born in the latest iteration t. Sampled living females belonged to birth cohorts Bt −Bt −8. Subsequently, dams were defined as breeding candidates in birth cohorts Bt −1−Bt −8.Available proven sires belonged to birth cohorts Bt −3−Bt −14, assuming that they were progeny tested and produced semen before deployment in the breeding population.
Advanced optimum contribution selection
Advanced OCS is implemented in the open-source R package optiSel (Wellmann, Reference Wellmann2019) and allows for simultaneous management of the ΔG, ΔF, ΔFnat and MC (Wang et al., Reference Wang, Bennewitz and Wellmann2017a; Wellmann et al., Reference Wellmann, Hartwig and Bennewitz2012). Advanced OCS was used solely for the selection of proven sires for deployment in the breeding population. The result of an aOCS approach for overlapping generations is a vector c with genetic contributions cit of each individual i to the next birth cohort t. The genetic contribution of each individual i cannot be negative, that is, cit ≥ 0. This is a general constraint of OCS approaches. As a second constraint, the genetic contributions of each sex equal 0.5 since the proportion of genes of diploid species originates half from sires and half from dams, that is, ct′s =0.5 and ct′d =0.5, where s and d are vectors indicative of sex (0 /1). Due to the limited number of progeny per cow and year, the female contributions were forced to be equal, that is, ct′d 1 = ct′d 2 = … = ct′dn . Since we chose a breeding scheme with a substantial amount of natural service (50.2%), the maximum genetic contribution per sire and year was forced not to exceed 0.05, that is, cit ≤ 0.05. As a result, the aOCS procedure selected at least 10 sires per year (i.e., ct′s/10=0.05) to satisfy the population under natural mating. According to the absolute number of progeny per birth cohort, a single sire could service a maximum of 351 females on an annual basis (3512/10 ≈ 351). As an objective function, aOCS was designed to maximize the ΔG by maximizing cit ´EBV, where EBV is a vector of EBVs of selection candidates. The maximization of cit ´EBV was performed under constraints. Effective population sizes of 50–100 have been suggested in the literature to keep a breed vital in the long term (Meuwissen, Reference Meuwissen2009). Thus, we chose an Ne and a native effective population size (Ne(nat) ; (Wellmann, Reference Wellmann2019)) of 100 to restrict the ΔF. We calculated the ΔF for overlapping generations per year as
 $$\Delta F = {1 \over {2\,{\rm{*}}\,{N_e}\,{\rm{*}}\,L}} = 0.092{\rm{\% }}$$
where L is the generation interval of 5.41 (Hartwig et al., Reference Hartwig, Wellmann, Hamann and Bennewitz2013). The first constraint of the aOCS procedure was defined as an upper bound for the average classical kinship in birth cohort t+1:
 $$ub.classKi{n_{t + 1}} = {\rm{\phi}}classKin + \left( {t - 1983} \right)\,{\rm{*}}\,\Delta F$$
where ØclassKin is the average classical kinship of living individuals in 1984 (0.017), sampled from the age distribution of the simulation process, and t is the year of optimization. We calculated the ΔFnat for overlapping generations per year as
 $$\Delta {F_{nat}} = {1 \over {2\,{\rm{*}}\,{N_{e\left( {nat} \right)}}\,{\rm{*}}\,L}} = 0.092{\rm{\% }}$$
The second constraint of the aOCS procedure was defined as an upper bound for the kinship of native alleles in birth cohort t+1:
 $$ub.natKi{n_{t + 1}} = {\rm{\phi }}natKin + \left( {t - 1983} \right)\,{\rm{*}}\,\Delta {F_{nat}}$$
where ØnatKin is the average kinship of native alleles of living individuals in 1984 (0.019). Based on pedigree data, the MC is the expected percentage of introgressed alleles carried by an individual i. The MC was managed by introducing an additional upper bound for the average MC of the next birth cohort t+1:
 $$ub.M{C_{t + 1}} \le {\rm{\phi }}M{C_t}$$,
where ØMCt is the average MC of breeding candidates in year t. Computation of the genetic parameters MC, classKin and natKin was carried out by optiSel. The estimated optimum contributions of sires were allocated randomly across females (cf. Figure 1; ‘Random mating’) since selection of dams is a key competence of breeders.
Phenotyping
Phenotypes were allocated to females belonging to birth cohort Bt −2, assuming a performance test at their first lactation. The phenotype of female i was defined as its true breeding value TBVi, plus an environmental effect. As the TBVs are unknown in reality, we assumed the EBVs in 1984 to be true (EBV 1984 = TBV 1984, where EBV 1984 is a vector of EBVs of individuals in 1984 and TBV 1984 is a corresponding vector of TBVs):
 $$Phenotyp{e_i} = TB{V_i} + {E_i}$$
The environmental effect followed a normal distribution:
 $${E_i} \sim N\left( {0,V{A_t}\,{\rm{*}}\,\left( {{{1 - {h^2}} \over {{h^2}}}} \right)} \right)$$
with VAt being the additive genetic variance assessed through the mean inbreeding of the population at time t (ØFt):
 $$V{A_t} = {\rm{\phi }}{F_t}{\rm{*}}{12^2}$$
Vorderwald cattle are a dual-purpose breed with an emphasis on milk yield and fitness. The actual breeding objective comprises performance traits, equaling 44%, 44% and 12% for milk yield, fitness and meat production, respectively. According to documentation of historical breeding decisions in Vorderwald cattle (Brodauf, Reference Brodauf1996), we derived the historical breeding objective. In 1965, this objective comprised solely performance in milk yield and meat production. For 1996, the objective was 5000 kg of milk per cow and year, 4.0% milk fat and 3.6% milk protein (Brodauf, Reference Brodauf1996). In comparison with the actual breeding objective, the direction of selection was amended toward fitness to the disadvantage of meat production. We hypothesized a TMI based on an individual’s performance, which is equivalent to a simulated trait with a heritability of h 2 = 0.25. This value should be similar to the h 2 in reality since the historical breeding objective comprised no fitness traits. Fitness traits are known to be less heritable than performance traits in the meat production of cattle (Knapp and Nordskog, Reference Knapp and Nordskog1946; Utrera, Reference Utrera2004; Andersen-Ranberg et al., Reference Andersen-Ranberg, Klemetsdal, Heringstad and Steine2005). The TBVs of individuals in ongoing iterations were estimated with the following equation:
 $$TB{V_i} = 0.5TB{V_{Sire\,i}} + 0.5TB{V_{Dam\,i}} + M{S_i}$$
where TBVSirei is the true breeding value of the sire and TBVDami is the true breeding value of the dam of individual i. MSi represents the Mendelian sampling term of individual i, chosen from a normal distribution:
 $$M{S_i} \sim N\left( {0,0.5\,{\rm{*}}\,V{A_t}} \right)$$
Estimation of breeding values
Estimation of breeding values was carried out with ASReml-R (Butler et al. Reference Butler, Cullis, Gilmour and Gogel2009). The mixed linear model was as follows:
 $${y_i} = \mu + {a_i} + {e_i}$$
where yi is the phenotype of individual i; μ is the intercept, modeled as a fixed effect; a i is the random animal effect, which equals the TBV of individual i; and ei is the environmental effect for individual i. Breeding value estimation was incorporated into simulations to enable changes in EBVs due to increasing accuracies (r) over time. Otherwise, the results would be incomparable with real data.
Selection of bull calves (exclusively Stage 2)
Bull calves were selected as candidates for progeny testing in birth cohort Bt . Selection was limited to male descendants of 10 sires with the greatest optimum contributions in iteration t − 1. Selection was performed by truncating the best 1, 3 or 5 half brothers per sire on the basis of EBVs. In this part, aOCS was omitted as discussed later on (cf. Discussion – aOCS scenarios). As a result, we examined three FoR strategies with 10, 30 or 50 young sires for annual restocking (FoR10, FoR30 and FoR50 strategies, respectively).
Progeny testing (exclusively Stage 2)
We assumed that bull calves became mature at the end of Bt . Thus, the calves were progeny tested in Bt −1. Matings for progeny testing were allocated randomly across female candidates belonging to Bt −2−Bt −8. We examined three strategies for annual progeny testing of young bulls with 300, 600 or 900 matings for progeny testing in total (PT300, PT600 and PT900 strategies, respectively). Combining FoR strategies and PT strategies resulted in nine different scenarios of the simulation process, as shown in Table 1. Subsequently, young sires became available for deployment in the breeding population when they belonged to Bt −3.
Table 1 Different simulation scenarios are defined by combinations of the flow of replacement of sires (FoR strategy) and extent of progeny testing of young sires (PT strategy) of Vorderwald cattle
Scenarios=different scenarios consisting of combinations of the FoR strategy and PT strategy; FoR=annual flow of replacement of sires; PT=extent of progeny testing of young sires; PT/YS=matings for progeny testing per young sire; n=replicates per scenario; ΔG=annual genetic gain, measured as the improvement in mean estimated breeding values (EBVs) for the total merit index (TMI) among birth cohorts B 1984–B 2014; ΔF=rate of inbreeding for overlapping generations (in %); ΔFnat =rate of native inbreeding for overlapping generations (in %); MC 2014=average migrant contribution of birth cohort 2014 as a final value; ØSires=average number of deployed sires per iteration among birth cohorts B 1984–B 2013.
a Three different FoR strategies were examined with 10, 30 or 50 young sires for restocking of proven sires per year.
b Three different PT strategies were examined. These strategies included 300, 600 or 900 matings for progeny testing of all young sires in total.
c Genetic gain was defined as the annual improvement in the mean EBV of birth cohorts.
d According to personal communication (Dr Franz Maus, 22 February 2018).
e According to (Hartwig et al. Reference Hartwig, Wellmann, Hamann and Bennewitz2013).
A,B Different superscripts indicate significantly different values (P <0.01) between the FoR strategies.
Genetic gain
To compare the simulation scenarios and reality, we defined ΔG as the average annual improvement in the mean EBVs of birth cohorts within a given time period of n years:
 $$\Delta {G_{t\,{\rm{}} - {\rm{}}\left( {t + n} \right)}} = {{{\rm{\phi }}EB{V_{t + n}} - {\rm{\phi }}EB{V_t}} \over n}$$
where ØEBV t is the average EBV of a given birth cohort t averaged over five replicates. To verify the average value differences, we performed a two-factorial ANOVA and Tukey’s Honestly Significant Difference (HSD) test. The response variable was ΔG 1984–2014. We included the FoR strategy and PT strategy as factor variables.
Rates of inbreeding
For a better understanding of time-specific developments, we defined the ΔF and ΔFnat in a given time period of n years, averaged over five replicates, as
 $$\Delta {F_{t\,{\rm{}} - {\rm{}}\left( {t + n} \right)}} = {{{\rm{\phi }}classKi{n_{t + n}} - {\rm{\phi }}classKi{n_t}} \over n}$$
and
 $$\Delta {F_{nat\left( {t\, - \left( {t + n} \right)} \right)}} = {{{\rm{\phi }}natKi{n_{t + n}} - {\rm{\phi }}natKi{n_t}} \over n}$$
Migrant contribution
Furthermore, we defined the ΔMC as the average annual increase in the mean MC of birth cohorts within a given time period of n years:
 $$\Delta M{C_{t - \left( {t + n} \right)}} = {{{\rm{\phi }}M{C_{t + n}} - {\rm{\phi }}M{C_t}} \over n}$$
where ØMCt is the average MC of a given birth cohort t averaged over five replicates.
Number of deployed sires
Since natural service is the dominant reproductive mode in Vorderwald cattle, the number of annually deployed sires will influence the feasibility of a breeding scheme. Thus, we chose an average number of annually deployed sires for each scenario as
 $${\rm{\phi }}Sire{s_{1984 - 2013}} = {{\mathop \sum \nolimits_{1984}^{2013} {\rm{\phi }}Sire{s_t}} \over {29}}$$,
where ØSirest is the average number of deployed sires in a given year t averaged over five replicates.
Results
Restricted parameters
With regard to a feasibility study that considers practical conditions, there was marginal variation in the values of the constraint parameters MC, classKin and natKin (cf. Table 1 for SDs). Hence, the results will be visualized exemplarily for scenario For30 + PT300. The development of the mean MC in birth cohorts is shown in Figure 2. In reality, ΔMC 1984–1996, ΔMC 1996–2005, ΔMC 2005–2014 and ΔMC 1984–2014 were 0.73%, 2.0%, 0.88% and 1.15%, respectively. Between 1984 and 2005, the MC increased by 27.3%, since ΔMC 1996–2005 was 2.7- and 2.3-fold higher than ΔMC 1984–1996 and ΔMC 2005–2014, respectively. In the simulation scenarios, ΔMC 1984–1985 was −14.8% (±0.0004) across all scenarios, reducing MC 1985 to 11.8% (±0.0004). Subsequently, the MC was conserved at a final value of 15.3% (±0.78) (cf. Table 1 for values of specific scenarios). As a result, ΔMC 1984–2014 was −0.38%. The development of the classKin and natKin is visualized in Figure 3. ClassKin developed with an irregular pattern in the real population; ΔF 1984–1996, ΔF 1996–2005 and ΔF 2005–2014 were 0.09%, −0.008% and 0.13%, respectively. Overall, ΔF 1984–2014 was 0.067%. In contrast, the natKin increased steadily, with a ΔFnat (1984–2014) of 0.184%. Across all simulation scenarios, the classKin and natKin decreased in 1985 with a ΔF 1984–1985 of −0.2% and a ΔFnat (1984–1985) of −0.05%. In subsequent iterations, both values increased linearly, with a ΔF 1984–2014 of 0.082–0.087% and a ΔFnat (1984–2014) of 0.087–0.088%. The constraints on inbreeding rates (ub.classKin and ub.natKin) and corresponding developments in the classKin and natKin in the simulation scenarios are visualized in Figure 4. Generally, ΔFnat (1984–2014) (0.087–0.088%) approximated ub.natKin (0.092%). However, ΔF 1984–2014 was lower (0.082–0.087%) across all scenarios and constrained to the same value (ub.classKin =0.092%).
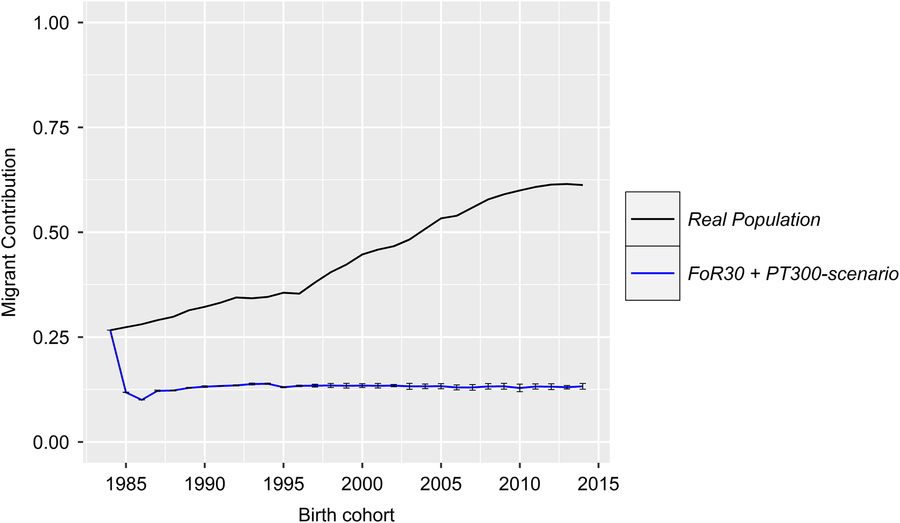
Figure 2 (Colour online) Development of the MC in the birth cohorts of the real and the simulated Vorderwald cattle populations – we examined nine different scenarios. The scenarios consisted of combinations of strategies for the flow of replacement of sires (FoR strategy) and number of matings to test young sires for restocking (PT strategy). The presented graphs visualize the mean MC of birth cohorts in the real population (black) and simulated populations averaged over five replicates with the SD (blue). Variation in the development of the MC was virtually negligible across the simulation scenarios (Table 1). Thus, the results are presented exemplarily for the FoR30 + PT300 scenario (30 young sires for restocking with 300 matings for annual progeny testing) for clarity. MC=migrant contribution.
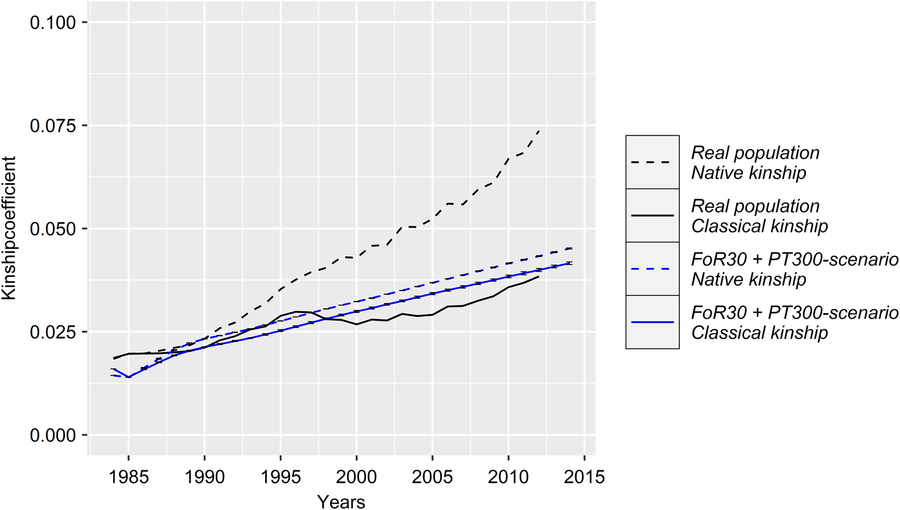
Figure 3 (Colour online) Development of the classical and native kinship of the real and the simulated Vorderwald cattle populations – we examined nine different scenarios. These scenarios consisted of combinations of strategies for the flow of replacement of sires (FoR strategy) and number of matings to test young sires for restocking (PT strategy). The graphs present the mean classical kinship coefficient (classKin, solid lines) and native kinship coefficient (natKin, dashed lines) of birth cohorts in the real population (black) and simulated populations averaged over five replicates with the SD (blue). Variation in the development of classKin and natKin was virtually negligible across simulation scenarios (Table 1). Thus, the results are presented exemplarily for scenario FoR30 + PT300 (30 young sires for restocking with 300 matings for annual progeny testing) for clarity.
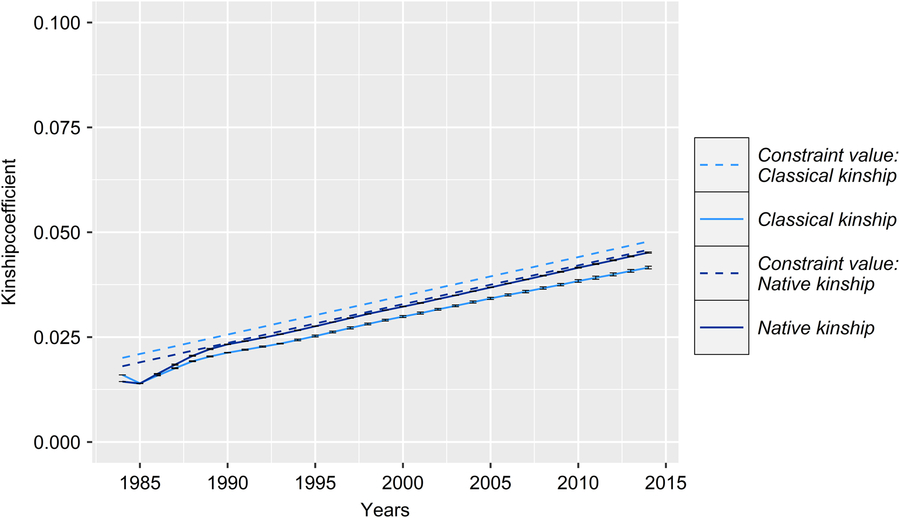
Figure 4 (Colour online) Development of the classical and native kinship with corresponding upper bounds of the real and the simulated Vorderwald cattle populations – average classical kinship coefficient (classKin, light blue) and native kinship coefficient (natKin, dark blue). Dashed lines represent corresponding upper bounds in respective iterations. Variation in the development of classKin and natKin was virtually negligible across simulation scenarios (Table 1). Thus, the results are presented exemplarily for scenario FoR30 + PT300 (30 young sires for restocking with 300 matings for annual progeny testing) for clarity.
Genetic gain
The development of the ΔG is visualized in Figure 5. Differences in ΔG were not significant across PT strategies (P =0.29). Thus, the ΔG is exclusively visualized for scenarios with the fewest number of matings for progeny testing (i.e., the PT300 strategy). In reality, ΔG 1984–2014 was highest (1.56), with ΔG 1984–1997, ΔG 1997–2006 and ΔG 2006–2014 equaling 1.21, 2.26 and 1.36, respectively. All scenarios of the simulation show a strong increase in ΔG 1984–1985 (8.8 ± 0.1). Thereafter, the ΔG develops almost linearly. Values for the ΔG 1984–2014 (1.12–1.40) of specific scenarios are presented in Table 1. The impact of FoR strategies on the ΔG is significant at P =3 × 10⁻¹⁶. The results of Tukey’s HSD test on FoR strategies averaged over PT strategies are visualized in Figure 6 and presented in Table 1. The ΔG 1984–2014 of the FoR10 scenarios (1.12–1.18) was significantly lower (P =0.05) than that of the FoR30 scenarios (1.35–1.37) and FoR50 scenarios (1.35–1.40).
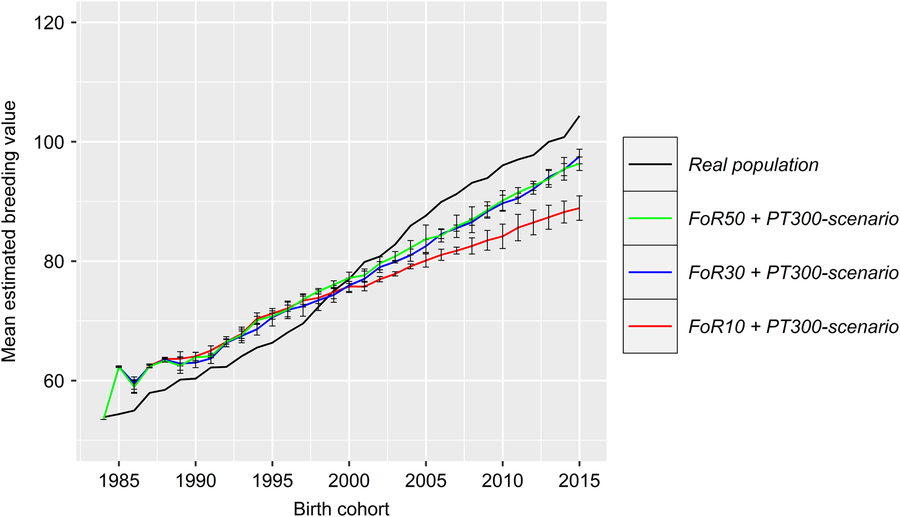
Figure 5 (Colour online) Development of the genetic gain of the real and the simulated Vorderwald cattle populations – we examined nine different scenarios. These scenarios consisted of combinations of strategies for the flow of replacement of sires (FoR strategy) and number of matings to test young sires for restocking (PT strategy). Graphs present the development of the mean EBV for the TMI of birth cohorts. Differences were not significant across PT strategies (Table 1). Thus, graphs are presented for scenarios with the smallest number of matings for progeny testing (300 in total) but various numbers of young sires for annual restocking of proven sires (50, 30 or 10; FoR50, FoR30 and FoR10, respectively; colored) and the real population (black). The results were averaged over five replicates. The graphs include SDs. EBV=estimated breeding value ; TMI=total merit index.
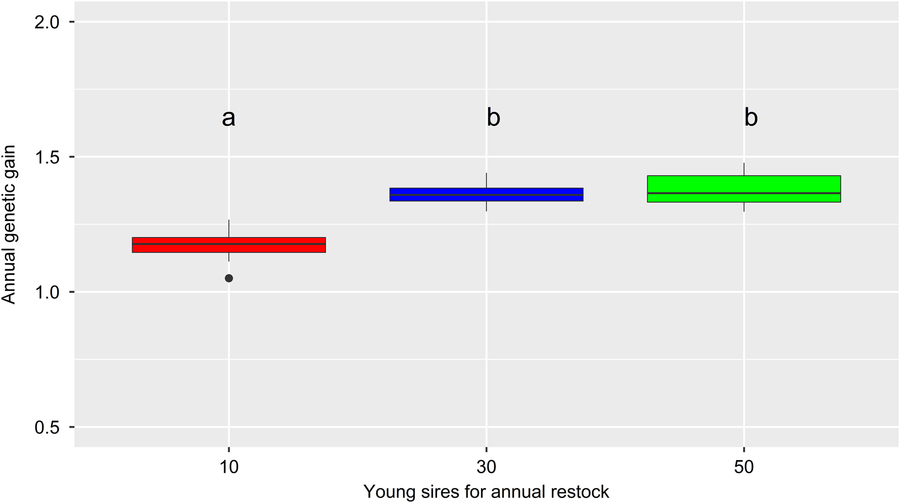
Figure 6 (Colour online) Average annual genetic gain of different simulated Vorderwald cattle populations over 30 iterations of the simulation process – box plot of annual genetic gain, measured as the improvement in mean EBVs for the TMI between pairs of birth cohorts from B1984 (starting point of the simulation) to B2014 (end point of the simulation). Different colors indicate different flows of replacement of proven sires, with levels of 10, 30 or 50 young sires for annual restocking (FoR10, FoR30 and FoR50 strategies, respectively). Additionally, three strategies for progeny testing of young sires were examined, with levels of 300, 600 or 900 matings for progeny testing in total (PT300, PT600 and PT900 strategies, respectively). The results of different FoR strategies were averaged over PT strategies, with five replicates per strategy combination. Different letters indicate significant differences at P < 0.01. EBV=estimated breeding value; TMI=total merit index.
Deployed proven sires
The numbers for øSires 1984–2013 are presented in Table 1. Across all simulations, øSires 1984–2013 varies between 53.2 and 72.7. In reality, 77.9 ± 30.2 sires were deployed annually.
Discussion
This discussion will provide an analysis of the performance and limitations of the given aOCS procedure in connection with the designed young sire breeding scheme. Subsequently, simulation scenarios will be compared in terms of the ΔG, MC, classKin and natKin. First, ideas for improvements in the actual breeding scheme of Vorderwald cattle will be derived. Furthermore, a comparison of simulation scenarios with real data will identify opportunities and limitations of the implementation of aOCS and clarify whether historical breeding decisions could have been avoided. Subsequently, we will select superior scenarios and provide ideas for practical implementation in a young sire breeding scheme. Finally, we will discuss efforts to add genomic information to optiSel. The SDs of all parameters (MC, ΔG, ΔF and ΔFnat ) were marginal. Thus, our study was based on merely five replicates per scenario.
Breeding schemes
The actual breeding scheme of Vorderwald cattle is illustrated in Figure 7. All figures are long-term averages from the last 10 years (Dr Franz Maus, personal communication, 22 February 2018). The active breeding population consists of 6300 dams in total. However, 3160 dams are serviced naturally by 80 unproven sires, and 3140 dams are serviced by artificial insemination by 10 proven sires. Thus, assuming an even distribution of born males and females, 3150 bull calves are born in the breeding population. Of these 3150 bull calves, 42 bull calves are selected for a performance test on station. Selection is performed by the breeding director on the basis of pedigree-based EBVs (Dr Franz Maus, personal communication, 26 February 2019). Subsequently, 37 of the 42 young bulls do not have sufficient performance to justify a progeny test. However, the bulls replace the sires for natural mating without passing a progeny test. Additionally, 40 young bulls for replacement of sires for natural mating originate from field testing. Field testing involves the measurement of daily gain and a rating of conformation. As a result, five young bulls have sufficient performance on station to justify a progeny test. Subsequently, two to three of these five young bulls successfully pass the progeny test and become available for restocking of proven sires for artificial insemination in the breeding population. A time frame of usage of proven sires for artificial insemination is not clearly defined. Young sires that do not pass the progeny test successfully (2–3) will be used to restock sires for natural mating. Directed mating is planned but has not yet been introduced. Gandini et al. (Reference Gandini, Stella, Del Corvo and Jansen2014) carried out stochastic simulations of young sire breeding schemes and similar population sizes (500–6000 dams) ‘according to criteria of the European Commission’ (Gandini et al., Reference Gandini, Ollivier, Danell, Distl, Georgoudis, Groeneveld, Martyniuk, van Arendonk and Woolliams2004) on ‘population sizes of local dairy cattle breeds designated as endangered’. Their simulations were carried out by implementing a standard OCS strategy. The breeding scheme for stochastic simulations in our study was based on the actual Vorderwald cattle population and used the young sire breeding schemes of Gandini et al. (Reference Gandini, Stella, Del Corvo and Jansen2014) as a template. The first major difference between the modeled schemes is the existence of progeny testing of young bulls in our study. This testing reportedly has an impact on the ΔG (Meuwissen and Sonesson, Reference Meuwissen and Sonesson1998). Additionally, FoR strategies should have an impact on the ΔG (Gandini et al., Reference Gandini, Stella, Del Corvo and Jansen2014). Thus, we examined three FoR strategies in combination with three PT strategies. Furthermore, Gandini et al. (Reference Gandini, Stella, Del Corvo and Jansen2014) did not consider reasonable amounts of natural service. In comparison to the actual breeding scheme, the scheme in this study omitted performance records as an additional selection criterion for young bulls. Finally, progeny testing of all selected mature bulls was a major difference since sires for natural mating in the actual scheme did not pass a progeny test.
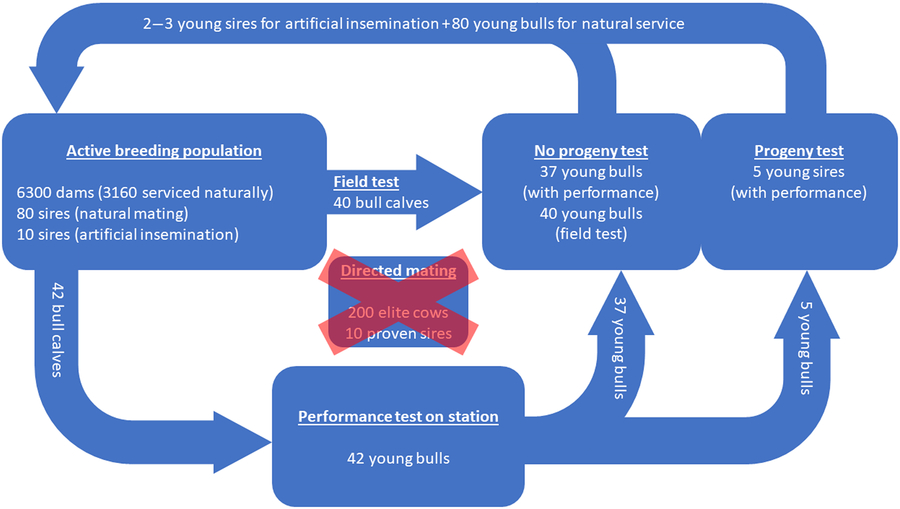
Figure 7 (Colour online) Actual breeding scheme of Vorderwald cattle – the presented figures are long-term averages (10 years) and presented on an annual basis (Dr Franz Maus, personal communication, 22 February 2018). A total of 6300 dams are available; therefore, 3160 dams are serviced naturally. Forty-two bull calves are selected from the breeding population for a performance test on station. Thirty-seven of those calves will restock sires for natural mating without passing a progeny test. The missing 40 bull calves for restocking of sires for natural mating originate from field tests. Five young bulls successfully pass the performance test on station and are subsequently progeny tested. A total of two to three bulls pass the progeny test successfully and will restock proven sires for artificial insemination. Directed mating is planned but has not yet been introduced.
The introduction of subsidies for registered breeding animals of Vorderwald cattle has led to heavy registration in the herdbook in recent years. Thus, a breeding population of 6300 dams (Figure 7) was established. Since all dams are registered breeding animals, a nucleus is non-existent. Therefore, we did not consider a breeding scheme based on a nucleus.
Advanced optimum contribution selection scenarios
All simulation scenarios showed a strong increase in ΔG 1984–1985 (+8.8 ± 0.1) after the first iteration, while the MC was greatly reduced (ΔMC 1984–1985 = −14.8% ± 0.0004) (Figures 2 and 5). Additionally, the classKin and natKin decreased (ΔF 1984–1985 = −0.2% and ΔFnat (1984–1985) = −0.05%) (Figure 4). This result might be explained by the identical base population of all simulation scenarios in combination with the optimization opportunities when aOCS is implemented for the first time. Deployed proven sires of the first iteration had an average MC of only 11.1% ± 0.2 (26.6% in the breeding population) and an average EBV of 71.3 ± 0.3 (53.5 in the breeding population) and were by chance not closely related across any scenarios (results not shown). In subsequent iterations, all simulation scenarios produced a final MC 2014 value of 15.3% ± 0.78. This result was due to the lack of the upper bound for MC. The upper bound was expressed as ub.MCt + t ≤ ØMCt . Thus, the average MC of population t+ 1 was constrained by the smallest value achieved at any given point of the simulation process since ub.MCt +1 ≥ ub.MCt +2 ≥ ub.MCt + n . An ub.MC fixed to a starting value of 26.6% in the base population would have been preferable. However, aOCS roughly satisfied the upper bound for ΔFnat (ub.natKin =0.092%), at 0.087–0.088% across all scenarios. Simultaneously, ub.classKin (0.092%) was not fully exploited, with a ΔF of 0.082–0.087% across all scenarios (Table 1). Native alleles are a subset of all alleles in a given population. Assuming a closed population of Vorderwald cattle in former times, selection within native alleles (domestication and breeding) resulted in related individuals. As soon as foreign alleles (i.e., the MC) were introgressed, carriers of those alleles were less related to the population. As an artifact, the classKin will always be smaller than the natKin, and restricting the natKin by an upper bound will automatically restrict the classKin to a lower level. This finding is in line with the results of scenario maxEBV.A.D.MC of (Wang et al. Reference Wang, Bennewitz and Wellmann2017a). The constraint setting of the authors’ simulation was the same as ours, with upper bounds for the MC, ΔF and ΔFnat . We agree with Wang et al. (Reference Wang, Bennewitz and Wellmann2017a) that restriction of the classKin can be omitted when the MC and natKin are restricted. Both parameters classKin and natKin show a linear and parallel increase across all scenarios (Figure 4). We conclude that aOCS can stop the increasing deviation of the classKin and natKin in the actual population and simultaneously conserve (or even reduce) the MC. Conserving or reducing the MC is of special interest for the actual population, with an MC 2014 of 61.3% (Table 1). Since increasing the extent of progeny testing per mature bull positively influences the accuracies of EBVs, we assumed the PT strategy to have an impact on the ΔG. However, a significant impact was not observed (P =0.29). The extent of progeny testing per mature bull varied between 6 (FoR50 + PT300) and 90 (FoR10 + PT900). Thus, the corresponding r was in the range of 0.4–0.75 across all scenarios (results not shown) when young sires were available for broad deployment in Bt −3. At a population level, fluctuation of EBVs should be compensated for all deployed sires. This compensation might explain the non-significant impact of PT strategies on the ΔG. However, we must be aware of the realization of ΔG in single herds when deploying sires with r ≈ 0.5. This consideration is analogous to the spread of risk in genomic breeding schemes. Optimally, this spread of risk might be transferred by deploying optimum contributions of sires in each herd (Kohl and Herold, Reference Kohl and Herold2017). However, the feasibility of this approach is questionable since ØSires 1984–2013 was 53.2–67.9 across all scenarios. Hence, we suggest implementing a sufficient spread of risk in single herds, even if the optimum contributions of sires cannot be completely transferred. Increasing the accuracy of breeding value estimation might be an added value since broader deployment of sires would result in enhanced approximation of herd effects. Furthermore, the ΔG 1984–2014 in the FoR30 and FoR50 scenarios was superior (1.36 ± 0.01 and 1.37 ± 0.03, respectively) to that in the FoR10 scenarios (1.15 ± 0.03). We conclude that the FoR30 and FoR50 strategies are superior in terms of the ΔG with no drawbacks in terms of the MC, ΔF and ΔFnat .
Prior to the actual simulation process, we performed various other procedures that tested for enhanced results by selecting bull calves for progeny testing with an additional aOCS approach. However, the results did not improve in any aspect and required approximately twice the computational time. The idea of the actual simulation process was to conserve the genetic diversity and uniqueness of the breed by selecting mature bulls for progeny testing across all deployed proven sires in every year. To ensure a sufficient ΔG, mature bulls were selected by truncation.
Comparison with real data
In reality, strong introgression of Montbéliard genetic material was carried out between 1995 and 2005 to upgrade the breed in terms of daily gain (Hartwig et al., Reference Gandini, Stella, Del Corvo and Jansen2014). As a result, the ΔMC increased much faster than before (2.7-fold) and thereafter (2.3-fold), based on the ΔMC 1984–1996, ΔMC 1996–2005 and ΔMC 2005–2014 values of 0.73%, 2.00% and 0.88%, respectively. Furthermore, introgression from Montbéliard is directly reflected in the development of the ΔG. During introgression, ΔG 1996–2005 was 1.9- and 1.7-fold higher than ΔG 1984–1996 and ΔG 2005–2014, respectively. Additionally, introgression led to a decreasing classKin (with ΔF 1996–2005 = −0.008%), as explained in the previous section. Simultaneously, the natKin strongly increased (with ΔFnat = 0.184) due to replacement of native alleles by the MC and subsequent directional selection within the remaining native gene variants. These two opposing trends led to a growing deviation between the classKin and natKin in reality. The ΔG was higher in reality (1.56) than in any scenario of the simulation (1.12–1.40, Table 1). Four aspects might have contributed to this outcome: (i) Since this is a feasibility study, it is based on the actual breeding scheme of Vorderwald cattle and is designed to meet all practical constraints. One of these constraints is the absence of selection in the dam path. This avoidance is a core competence of breeders. Deducting this core competence would lead to the unwillingness of breeders to realize aOCS in their breeding scheme. However, breeders certainly select for superior dams. Such selection might have contributed to the higher rates of ΔG in reality. (ii) The ΔG increases as the heritabilities of traits increase (Gandini et al., Reference Gandini, Stella, Del Corvo and Jansen2014). We assumed a TMI, based on an individual’s own performance, equivalent to a simulated trait with an h 2 =0.25. With respect to a historical breeding objective comprising solely performance traits, this value might have been too low. (iii) Inbreeding has not been supervised in reality. However, the low ΔF 1984–2014 (0.067%) value compared to that obtained with simulations (0.082–0.087%) was due to the introgression of the MC since the real ΔF 1996–2005 was −0.008%. Woolliams et al. (Reference Woolliams, Berg, Dagnachew and Meuwissen2015) suggested a comparison of ΔG values at equal ΔF values because a larger ΔF inefficiently turns genetic variance in ΔG and increases risks. Thus, a comparison of the real ΔF 2005–2014 (0.13) and the ΔF 1984–2014 of the simulations seems more appropriate since introgression was stopped in 2005 and the gene pool was again closed. This termination of introgression resulted in a 1.5-fold higher ΔF in reality. Additionally, replacement of native alleles by the MC is undesired in regional breeds under conservation. Thus, a further comparison of ΔF(nat) 1984–2014 is advisable, with 0.184% and 0.087% in reality and across all simulations (2.1-fold higher), respectively. Hence, the ΔG in reality was achieved at the expense of genetic diversity and uniqueness. (iv) Introgression caused a larger ΔG in reality. Introgression from foreign breeds was avoided in the simulations. Additionally, the lack of ub.MCt +1, as described in the preceding section, entailed a substantial decline in the MC. However, the MC is known to be positively correlated with ΔG (Wellmann et al., Reference Wellmann, Hartwig and Bennewitz2012). Thus, simulation scenarios produced a ΔG out of the remaining 11.8% ± 0.0003 of the MC 1985 (compared to 26.3% in reality) and inferior native gene variants. Our aim was to clarify whether historical breeding decisions to increase the ΔG by introgression of commercial breeds could have been avoided by using aOCS. Thus, a comparison of the ΔG in reality and that from superior simulation scenarios seems most appropriate. The ΔG in reality was superior to that in the FoR30 and FoR50 strategies by 12.8% and 12.2%, respectively. However, a direct comparison was not possible because of the very large decline in MC 1985. A further comparison of ΔG was mandatory to demonstrate how poorly the MC was exploited after introgression was halted in 2005. The MC increased in reality by 27.3% in 1984–2005 (Figure 2). The additional MC resulted in a greater ΔG of only 12.4%, based on ΔG 1984–1997 (1.21, before introgression) and ΔG 2006–2014 (1.36, after introgression). Finally, the ΔG 1984–2014 in the FoR30 and FoR50 scenarios was superior to the ΔG 2006–2014 in reality (including the exploitable MC), at 3.7% and 4.4%, respectively. The final values of MC 2014 were 13.2–16.1% across the corresponding scenarios and 61.3% in reality. Therefore, historical breeding decisions could have been avoided with a loss of 12.2–12.8% in the ΔG but would have resulted in an almost unique breed of Vorderwald cattle.
Selecting the superior scenario
The FoR30 and FoR50 strategies are superior to the FoR10 strategy. The PT strategies had no significant impact on the ΔG. In practical terms, the selection of bull calves as well as husbandry and progeny testing of mature bulls is a financial issue faced by the breeding organization. The actual breeding scheme selects 42 bull calves for a performance test on station (Figure 7). Subsequently, five of the calves passed the progeny test. The breeding scheme of Vorderwald cattle takes into account the EBVs of young sires on the basis of 25–30 daughters (Hartwig et al., Reference Hartwig, Wellmann, Hamann and Bennewitz2013). Expecting an even distribution of born males and females, at least 50–60 matings are required to test 5 young sires. Eventually, this process results in 250–300 matings in total. The FoR30 and FoR50 strategies selected 30 and 50 bull calves for progeny testing, respectively. Since the differences in ΔG between the FoR30 and FoR50 strategies were not significant, we recommend implementing the FoR30 strategy in combination with the PT300 strategy. As a result, the number of matings for progeny tests (300) is comparable to the actual numbers. This combination will cause the lowest costs in selection, husbandry and progeny testing while maximizing benefits (ΔG).
Improving the breeding scheme
The actual breeding scheme of Vorderwald cattle is confounded by three factors. (i) Sires for natural mating do not pass a progeny test. (ii) Only half of the sires have performance records. (iii) Directed mating has not yet been introduced. Therefore, bull calves have been selected from the breeding population of 6300 dams (Figure 7). This process is cost-effective, but the risk of losing promising young sires due to the immediate dropout of bull calves is high (sale and culling). Restructuring the breeding scheme might improve population parameters, even before introducing aOCS. Consequent selection of half brothers over sires, on the basis of EBVs, is new and organizationally challenging. To simplify this task, we recommend accelerating the implementation of directed mating. An additional aOCS approach could optimize and allocate matings among elite cows. This approach might result in further enhanced population parameters (Gandini et al., Reference Gandini, Stella, Del Corvo and Jansen2014). As an added value, the risk of losing valuable genetic material due to the immediate dropout of bull calves would be minimized. However, the establishment of a nucleus is not possible at the moment. One assumption of the simulation process was that all female descendants of young sires reached the performance test. This assumption is unrealistic because some of these descendants will be unavailable. However, when applying the most cost-effective FoR30 + PT300 scenario, five daughters reached the performance test in the simulations. In combination with a realistic chance of survival of heifers of 72% (Wathes et al., Reference Wathes, Brickell, Bourne, Swali and Cheng2008), 14–15 matings are sufficient for progeny testing of mature bulls in reality. Thus, the absolute number of matings for progeny testing increases to 420–450 when the FoR30 strategy is implemented. The additional costs of extended progeny testing (420–450 compared to 250–300 in reality; cf. Table 1) might be compensated for fewer performance tests of bull calves on station (30 compared to 42 in reality, cf. Table 1). In reality, 77.9 ± 30.2 sires were deployed on an annual basis. The FoR30 + PT300 scenario deployed 67.9 ± 14.0 sires. Thus, fewer sires will be available to naturally service 3160 dams. Additionally, realizing optimum contributions in the naturally serviced dam population is an obstacle to overcoming associated challenges (Kohl and Herold, Reference Kohl and Herold2017). Currently, sires for artificial insemination produce semen and are subsequently culled. However, it is mandatory to keep a sufficient proportion of sires to service dams naturally. As a solution, one half brother could be kept per half sibling group and year. The idea is to deploy a half brother if aOCS selects for a culled sire. In this way, at least the optimum contributions of the sire–sire path will be realized. From an organizational point of view, we recommend establishing a bull rotation program (Kohl and Herold, Reference Kohl and Herold2017) or re-establishing municipal husbandry of sires for natural mating.
Further studies
Following this study, we will examine the impact of applying identified superior strategies to the actual breeding population of Vorderwald cattle in combination with the designed young sire breeding scheme. We will clarify further possibilities of reducing the number of bull calves for the restocking of sires. Thus, the FoR50 strategy will be replaced by an FoR20 strategy. Additionally, we will test the effects of either equalizing or lowering the MC in the population. This test is of special interest, considering the alarming MC levels in the actual population. Finally, internal cost accounting and analyses of organizational efforts will clarify the financial issues associated with the breeding scheme.
Adding genomic data
Advanced OCS is available within the open-source R package optisel. Pedigree data are known to be biased (Oliehoek and Bijma, Reference Oliehoek and Bijma2009). Thus, the estimation of the classKin, natKin and MC is impeded. Adding genomic information to optiSel facilitates the estimation of all parameters based on shared haplotype segments (runs of homozygosity) (Wang et al., Reference Wang, Segelke, Emmerling, Bennewitz and Wellmann2017b). As a result, estimates are realized values rather than expected values and reflect enhanced selection decisions by the aOCS procedure. However, genomic data are not currently available. There are impending projects that aim to genotype a subpopulation of Vorderwald cattle, but the applicability of genome-based methods is unforeseeable.
Conclusion
This study assumes purposive and economically optimal actions of all parties. In reality, this assumption is frequently not the case (Kohl and Herold, Reference Kohl and Herold2017). Conviction of breeders is essential for effectively implementing aOCS in a given breeding scheme of Vorderwald cattle. Developed strategies should be openly discussed. In this way, a personal commitment might be achieved (Kohl and Herold, Reference Kohl and Herold2017). Furthermore, this study suggests that aOCS with optiSel is feasible for Vorderwald cattle, given the designed young sire breeding scheme. Selection of 30 bull calves per year, with subsequent progeny testing, was proposed for annual restocking of proven sires. Given the constraint setting of the aOCS procedure, a smaller ΔG arose in superior scenarios (1.35 ± 0.03 in FoR30 + PT300) than that observed in real data (1.56). However, there was a lack in the upper bound for the MC. Thus, MC 2014 was greatly reduced to 15.3% (± 0.78) across all simulation scenarios. In reality, MC 2014 rose to an alarming level (61.3%). Genetic diversity was conserved at a Ne(nat) of 100 with a ΔFnat of 0.087% ± 0.0005 in the FoR30 + PT300 scenario. Hence, the upper bound of ΔFnat was roughly satisfied (0.092%). Therefore, we conclude that historical breeding decisions could have been avoided by using aOCS with the FoR30 + PT300 scenario. As a result, ΔG would have been reduced by 12.2%, but the introgressed genetic material, genetic diversity and native genetic diversity would be more effective for a breed under conservation in safeguarding future changes in livestock breeding.
Acknowledgments
The authors thank the Rinderunion Baden-Württemberg e.V, the Ministry of Rural Affairs, Food and Consumer Protection Baden-Wuerttemberg, and the H. Wilhelm Schaumann Stiftung for financing the project; the State Agency for Spatial Information and Rural Development Baden-Württemberg for the workstation and data provisioning; and Prof. Dr Jörn Bennewitz and the Department of Animal Genetics and Breeding (460g) at the University of Hohenheim for their support. Special thanks are given to the reviewers during the peer review process. We appreciate your critical and helpful comments.
Sebastian Philipp Kohl, 0000-0002-4340-3921
Declaration of interest
None.
Ethics statement
None.
Software and data repository resources
The data and the simulation code will be archived at the State Agency for Spatial Information and Rural Development Baden-Württemberg at Kornwestheim, Germany. Access might be given after a consultation with the Rinderunion Baden-Württemberg e.V. and the Breeding Value Estimation Team Baden-Württemberg.


 Open access