


1 Introduction
1.1 Genetic susceptibility to disease and adverse selection
Genomic science is rapidly advancing and beginning to explain the heritability of many common diseases. Our understanding of the genetic basis of common diseases has been aided by rare familial forms of these disorders, which arise when an inherited variant in a single gene is responsible for the disease. In these Mendelian, or monogenic, forms of disease, variants have high penetrance, meaning that an individual carrying the variant is at substantially increased lifetime risk of developing the disorder. Common diseases, however, generally display multifactorial inheritance patterns, where risk is conferred by many genetic variants (polygenic) alongside environmental factors (Khera et al., Reference Khera, Emdin, Drake, Natarajan, Bick, Cook, Chasman, Baber, Mehran, Rader, Fuster, Boerwinkle, Melander, Orho-Melander, Ridker and Kathiresan2016). Coronary disease, diabetes and the majority of cancers are all examples of multifactorial disorders.
In clinical genetics, testing for high-penetrance single-gene Mendelian variants is commonly performed in individuals with a strong family history for a disorder. For example, some genetic variants in the BRCA1 and BRCA2 genes confer significantly increased risk for breast cancer (BC) and ovarian cancer (Antoniou et al., Reference Antoniou, Pharoah, Narod, Risch, Eyfjord, Hopper, Loman, Olsson, Johannsson, Borg, Pasini, Radice, Manoukian, Eccles, Tang, Olah, Anton-Culver, Warner, Lubinski, Gronwald, Gorski, Tulinius, Thorlacius, Eerola, Nevanlinna, Syrjäkoski, Kallioniemi, Thompson, Evans, Peto, Lalloo, Evans and Easton2003). Genetic variants with such high penetrance, however, are rare. The genetic architecture of most complex diseases is overwhelmingly polygenic, with multiple inherited DNA variants, each of small effect, cumulatively affecting disease risk (Yang et al., Reference Yang, Benyamin, McEvoy, Gordon, Henders, Nyholt, Madden, Heath, Martin and Montgomery2010). The increase or decrease in risk conferred by each variant is extremely small and offers no predictive power.
The most common type of variation in the genome is the single-nucleotide polymorphism (SNP). Most positions in the genome are invariant, with a single DNA base pair (A, C, G or T), while at SNPs, two or more different base pairs exist in the population (e.g. A, G). SNPs are tested for association with human diseases by comparing the frequencies of the two base pairs in individuals with the disease compared to those without the disease. These case–control studies are performed testing hundreds of thousands of SNPs in genome-wide association studies (GWAS) (Burton et al., 2007; Visscher et al., Reference Visscher, Wray, Zhang, Sklar, McCarthy, Brown and Yang2017). GWAS have identified many genetic variants that contribute to polygenic disorders. With large sample sizes in the GWAS, sufficient genetic signal is identified from SNPs to provide some prediction of an individual’s risk of disease. Risk is assessed using a polygenic risk score (PRS), a metric that condenses information from tens, hundreds, thousands or even millions of genetic variants into a single score that summarises the individual’s genetic predisposition to specific diseases or complex traits (Dudbridge, Reference Dudbridge2013). The PRS is calculated as a weighted sum (across SNPs) of the number of risk variants carried by an individual. The weight is extracted from the GWAS results, which estimate the effect on disease risk as an odds ratio (OR), which measures the increased (OR > 1) or decreased (OR < 1) effect of the SNP variant on disease risk. In a polygenic disease, each SNP has a modest effect on risk, with OR close to 1. In a population, PRS are approximately normally distributed, as expected under the central limit theorem, because they are the sum of small contributions to risk from each SNP. PRSs are often expressed as risk percentiles: an individual with a PRS at the 99th percentile for type 2 diabetes, for example, would be considered to have high genetic risk, while an individual with a PRS at the 50th percentile would have an average genetic risk.
Researchers have now developed PRSs for many common diseases and have shown their potential in risk prediction. For example, a PRS for coronary artery disease (CAD) risk has demonstrated that people with a PRS in the highest 5% have a threefold increased risk of experiencing the condition compared to individuals with lower PRSs (see Khera et al., Reference Khera, Chaffin, Aragam, Haas, Roselli, Choi, Natarajan, Lander, Lubitz, Ellinor and Kathiresan2018). In BC, Mavaddat et al. (Reference Mavaddat, Michailidou, Dennis, Lush, Fachal, Lee, Tyrer, Chen, Wang, Bolla, Yang, Adank, Ahearn, Aittomäki, Allen, Andrulis, Anton-Culver, Antonenkova, Arndt, Aronson, Auer, Auvinen, Barrdahl, Beane Freeman, Beckmann, Behrens, Benitez, Bermisheva, Bernstein, Blomqvist, Bogdanova, Bojesen, Bonanni, Børresen-Dale, Brauch, Bremer, Brenner, Brentnall, Brock, Brooks-Wilson, Brucker, Brüning, Burwinkel, Campa, Carter, Castelao, Chanock, Chlebowski, Christiansen, Clarke, Collée, Cordina-Duverger, Cornelissen, Couch, Cox, Cross, Czene, Daly, Devilee, Dörk, Dos-Santos-Silva, Dumont, Durcan, Dwek, Eccles, Ekici, Eliassen, Ellberg, Engel, Eriksson, Evans, Fasching, Figueroa, Fletcher, Flyger, Försti, Fritschi, Gabrielson, Gago-Dominguez, Gapstur, García-Sáenz, Gaudet, Georgoulias, Giles, Gilyazova, Glendon, Goldberg, Goldgar, González-Neira, Grenaker Alnæs, Grip, Gronwald, Grundy, Guénel, Haeberle, Hahnen, Haiman, Håkansson, Hamann, Hankinson, Harkness, Hart, He, Hein, Heyworth, Hillemanns, Hollestelle, Hooning, Hoover, Hopper, Howell, Huang, Humphreys, Hunter, Jakimovska, Jakubowska, Janni, John, Johnson, Jones, Jukkola-Vuorinen, Jung, Kaaks, Kaczmarek, Kataja, Keeman, Kerin, Khusnutdinova, Kiiski, Knight, Ko, Kosma, Koutros, Kristensen, Krüger, Kühl, Lambrechts, Le Marchand, Lee, Lejbkowicz, Lilyquist, Lindblom, Lindström, Lissowska, Lo, Loibl, Long, Lubiński, Lux, MacInnis, Maishman, Makalic, Maleva Kostovska, Mannermaa, Manoukian, Margolin, Martens, Martinez, Mavroudis, McLean, Meindl, Menon, Middha, Miller, Moreno, Mulligan, Mulot, Muñoz-Garzon, Neuhausen, Nevanlinna, Neven, Newman, Nielsen, Nordestgaard, Norman, Offit, Olson, Olsson, Orr, Pankratz, Park-Simon, Perez, Pérez-Barrios, Peterlongo, Peto, Pinchev, Plaseska-Karanfilska, Polley, Prentice, Presneau, Prokofyeva, Purrington, Pylkäs, Rack, Radice, Rau-Murthy, Rennert, Rennert, Rhenius, Robson, Romero, Ruddy, Ruebner, Saloustros, Sandler, Sawyer, Schmidt, Schmutzler, Schneeweiss, Schoemaker, Schumacher, Schürmann, Schwentner, Scott, Scott, Seynaeve, Shah, Sherman, Shrubsole, Shu, Slager, Smeets, Sohn, Soucy, Southey, Spinelli, Stegmaier, Stone, Swerdlow, Tamimi, Tapper, Taylor, Terry, Thöne, Tollenaar, Tomlinson, Truong, Tzardi, Ulmer, Untch, Vachon, van Veen, Vijai, Weinberg, Wendt, Whittemore, Wildiers, Willett, Winqvist, Wolk, Yang, Yannoukakos, Zhang, Zheng, Ziogas, Dunning, Thompson, Chenevix-Trench, Chang-Claude, Schmidt, Hall, Milne, Pharoah, Antoniou, Chatterjee, Kraft, García-Closas, Simard and Easton2019) showed that women whose PRSs were in the top 20% were shown to have a 17.2% lifetime risk of BC compared to a 5.3% lifetime risk for women whose scores were in the lowest 20%. Some studies suggest PRSs could be integrated into clinical risk tools in the near future. One application of PRSs could be to redefine cancer screening algorithms (see Mavaddat et al., Reference Mavaddat, Michailidou, Dennis, Lush, Fachal, Lee, Tyrer, Chen, Wang, Bolla, Yang, Adank, Ahearn, Aittomäki, Allen, Andrulis, Anton-Culver, Antonenkova, Arndt, Aronson, Auer, Auvinen, Barrdahl, Beane Freeman, Beckmann, Behrens, Benitez, Bermisheva, Bernstein, Blomqvist, Bogdanova, Bojesen, Bonanni, Børresen-Dale, Brauch, Bremer, Brenner, Brentnall, Brock, Brooks-Wilson, Brucker, Brüning, Burwinkel, Campa, Carter, Castelao, Chanock, Chlebowski, Christiansen, Clarke, Collée, Cordina-Duverger, Cornelissen, Couch, Cox, Cross, Czene, Daly, Devilee, Dörk, Dos-Santos-Silva, Dumont, Durcan, Dwek, Eccles, Ekici, Eliassen, Ellberg, Engel, Eriksson, Evans, Fasching, Figueroa, Fletcher, Flyger, Försti, Fritschi, Gabrielson, Gago-Dominguez, Gapstur, García-Sáenz, Gaudet, Georgoulias, Giles, Gilyazova, Glendon, Goldberg, Goldgar, González-Neira, Grenaker Alnæs, Grip, Gronwald, Grundy, Guénel, Haeberle, Hahnen, Haiman, Håkansson, Hamann, Hankinson, Harkness, Hart, He, Hein, Heyworth, Hillemanns, Hollestelle, Hooning, Hoover, Hopper, Howell, Huang, Humphreys, Hunter, Jakimovska, Jakubowska, Janni, John, Johnson, Jones, Jukkola-Vuorinen, Jung, Kaaks, Kaczmarek, Kataja, Keeman, Kerin, Khusnutdinova, Kiiski, Knight, Ko, Kosma, Koutros, Kristensen, Krüger, Kühl, Lambrechts, Le Marchand, Lee, Lejbkowicz, Lilyquist, Lindblom, Lindström, Lissowska, Lo, Loibl, Long, Lubiński, Lux, MacInnis, Maishman, Makalic, Maleva Kostovska, Mannermaa, Manoukian, Margolin, Martens, Martinez, Mavroudis, McLean, Meindl, Menon, Middha, Miller, Moreno, Mulligan, Mulot, Muñoz-Garzon, Neuhausen, Nevanlinna, Neven, Newman, Nielsen, Nordestgaard, Norman, Offit, Olson, Olsson, Orr, Pankratz, Park-Simon, Perez, Pérez-Barrios, Peterlongo, Peto, Pinchev, Plaseska-Karanfilska, Polley, Prentice, Presneau, Prokofyeva, Purrington, Pylkäs, Rack, Radice, Rau-Murthy, Rennert, Rennert, Rhenius, Robson, Romero, Ruddy, Ruebner, Saloustros, Sandler, Sawyer, Schmidt, Schmutzler, Schneeweiss, Schoemaker, Schumacher, Schürmann, Schwentner, Scott, Scott, Seynaeve, Shah, Sherman, Shrubsole, Shu, Slager, Smeets, Sohn, Soucy, Southey, Spinelli, Stegmaier, Stone, Swerdlow, Tamimi, Tapper, Taylor, Terry, Thöne, Tollenaar, Tomlinson, Truong, Tzardi, Ulmer, Untch, Vachon, van Veen, Vijai, Weinberg, Wendt, Whittemore, Wildiers, Willett, Winqvist, Wolk, Yang, Yannoukakos, Zhang, Zheng, Ziogas, Dunning, Thompson, Chenevix-Trench, Chang-Claude, Schmidt, Hall, Milne, Pharoah, Antoniou, Chatterjee, Kraft, García-Closas, Simard and Easton2019). For instance, women with PRSs indicating higher BC risk could be offered earlier and more regular cancer screenings, as with women with variants in BRCA1, BRCA2 and other high-risk genes. Advances in genetics are permitting more accurate disease risk predictions, and access to PRSs may become available through clinical services or direct-to-consumer testing. If consumers use this information in insurance purchasing, adverse selection becomes a possibility. Insurers wish to avoid information asymmetry as much as possible, but regulations limit the use of genetic information in individually underwritten insurance policies, including life, critical illness, long-term care and income protection (see Prince, Reference Prince2018). These regulations include complete legislative bans on use of the information, moratoria and limited use of the information, and entirely industry-led guidelines. The economic impact of any regulations on the use of genetic information depends on the utility of genetic information for risk prediction. Knowledge of one’s genetic susceptibility to disease could affect insurance purchasing behaviours. In particular, people who learn that they have a high risk for a disease may purchase life and protection insurance to ameliorate the risk. Equally, it is possible that people who learn that they have a low risk may be less likely to purchase insurance. Accordingly, the mortality and morbidity experience of an insured book could be significantly altered if the composition of these low- and high-risk groups is shifted because genetic information becomes widely available.
Presently, adverse selection from genetic testing may be seen as minimal, compared to a future where technological advances, the growth in genetic testing and our understanding of genomics make this information critical for risk prediction. An essential question is: how informative is genetic testing for major morbidities and mortality? To help answer this question, we have explored the predictive power of genetic information alongside traditional risk factors, including BMI, smoking and blood pressure, in the UK Biobank.
1.2 Modelling incidence of BC and myocardial infarction using PRSs in the UK Biobank
The UK Biobank is a health cohort study of 500,000 participants, which was established to identify the determinants of common life-threatening and disabling conditions. It has extensive clinical, genetic, environmental, socio-demographic and biomarker data, with thousands of collected variables and over 20 million genetic variants. The UK Biobank offers a unique opportunity to research mortality and major morbidity outcomes in the UK population using genetic and environmental risk factors. Detailed information on health, lifestyle and activity was collected at a baseline visit by each participant, and record linkages exist to the Hospital Episode Statistics, death registry and cancer registry – with linkage to primary care records in progress. The UK Biobank provides an unprecedented data source in which to build and test predictive models for common disorders, as well as uncover novel risk factors.
In this study we have investigated the UK Biobank genetic, environmental and clinical data to predict onset of BC and CAD. BC is the most common invasive cancer in women (McGuire et al., Reference McGuire, Brown, Malone, McLaughlin and Kerin2015), with roughly one in seven women in the United Kingdom born after 1960 developing the disease in their lifetime (Cancer Research UK, 2018). Globally, the number of cases has significantly increased in the past 50 years and this trend is expected to continue, in part, due to modern lifestyles. CAD refers to the accumulation of atherosclerotic plaque in the blood vessels that deliver oxygen to the heart. A myocardial infarction usually occurs when a blood clot is formed by a rupture in the plaque, which blocks blood flow downstream denying the heart muscle of oxygen causing cell death.
Both BC and CAD are long recognised to have a heritable component, and recent advances have started to unravel the genetic architecture of these diseases. Our focus in this research is on assessing the utility of genetic information in predicting these morbidity outcomes: does genetics add information to routinely collected clinical and socio-demographic data, and what role could genetics play in prediction algorithms?
2 Methods
Information on the UK Biobank genotype and phenotype can be found in Appendix A.
2.1 Incidence of CAD in the UK Biobank
To identify incident CAD events in the UK Biobank cohort, we used linked Hospital Episode Statistics (HES) and the national death registries. The HES definition of CAD was based on the reporting of non-fatal myocardial infarction (ICD9 410-412; ICD10 I21-I24, and I25.2) or coronary revascularisation operations (coronary angioplasty or coronary artery bypass graft; OPCS-4 K40-46, K49, K50.1 or K75). Fatal myocardial infarction cases were identified by the death registry ICD10 codes (I21-I24, and I25.2) as a primary or contributory cause of death. Additional prevalent cases were identified using self-reported data, collected at baseline during a verbal interview with a trained nurse. Data fields include heart attack (self-report code 1075) and coronary revascularisation operation (operation codes 1070, 1095, 1523). To define the age at first CAD event, the earliest HES date was used; if this was not available, then the self-reported dates were used. For individuals with fatal CAD and no previous self-reported or recorded HES, we used the date of death as the first occurrence. If CAD was reported but no dates provided, these individuals were removed from the analyses (N = 280). For survival analysis, individuals who did not experience a CAD event were censored at their age in 2016 (the date of the latest recorded CAD event). In total, there were 18,830 CAD cases in the UK Biobank (Table 1), of these 6,430 were incident cases used in our main analysis (Figure 1).
Table 1. Sample sizes for CAD and breast cancer with number of incident cases in full cohort and in healthy individuals
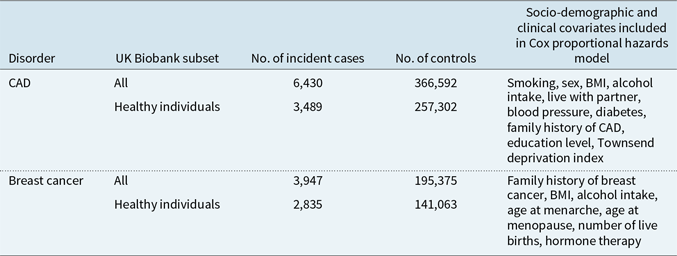
Note: Breast cancer analysis was performed in females only.
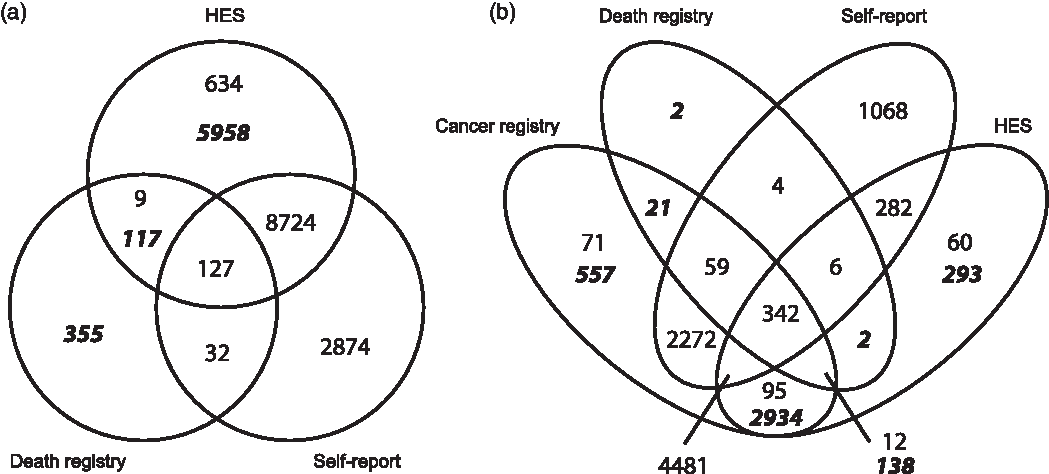
Figure 1 Data sources for prevalent and incident cases of (a) CAD and (b) breast cancer, from self-report (all prevalent cases), Hospital Episode Statistics (HES), cancer and death registries. Figures in italicised bold indicate incident cases used in the survival analysis, identified from cancer registry, death registry and HES. Non-bold figures indicate prevalent cases, predating the UK Biobank baseline visit, identified through self-report, cancer registry and HES.
2.2 Incidence of BC in the UK Biobank
To identify incident BC cases, we used data from HES, cancer registries and the national death registries (ICD9 1740-1749; ICD10 C50.0-C50.9). Prevalent cases were identified using self-reported data (code 1002). To define the age at first diagnosis of BC, the earliest cancer registry date was used; if that was unavailable, date from HES data was used, or otherwise from self-report information. Finally, the date of death was used if no previous record of BC was found. BC cases with no date provided were removed from analyses (N = 59).
2.3 Subsetting of the UK Biobank participants
To assess the importance of PRS for risk prediction, we explored model results in both the entire UK Biobank (UKB) population and a healthy subset of individuals. This healthy subgroup was derived in order to examine whether the PRS results were attenuated in this group. These individuals had no phenotypic markers for major ill-health (see Appendix A for markers considered) and therefore approximate a standard risk group for life insurance. In this way we aimed to explore the importance of genotypic information when the phenotypic/clinical information suggests no elevated risk. The phenotypic markers were chosen to broadly mirror standard underwriting criteria, noting it was not possible to precisely replicate the underwriting process.
2.4 Generation of PRSs and time-to-event analyses
For each UKB participant, PRSs were created using PRSice2 software (Choi & O’Reilly, Reference Choi and O’Reilly2019; https://github.com/choishingwan/PRSice), from
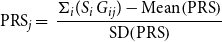 \begin{equation}{\rm{PR}}{{\rm{S}}_j} = \;\frac{{{\Sigma _i}({{S_i}\;{G_{ij}}}) - {\rm{Mean}}\!\left( {{\rm{PRS}}} \right)}}{{{\rm{SD}}\!\left( {{\rm{PRS}}} \right)}}\end{equation}
The PRS for individual j (PRS j ) sums the number of risk alleles (G ij = 0, 1, 2) carried by an individual, weighted by the logarithm of the OR for disease risk from the risk allele (S i ). The OR is extracted from GWAS for the increased risk of disease conferred by the genetic variant. The PRS is then standardised, to give a distribution with a mean of 0 and standard deviation (SD) of 1.
Summary statistics for the CAD GWAS were downloaded from the CARDIoGRAMplusC4D Consortium website (http://www.cardiogramplusc4d.org/data-downloads/; see Nikpay et al., Reference Nikpay, Goel, Won, Hall, Willenborg, Kanoni and Saleheen2015), and for BC from Michailidou et al. (Reference Michailidou, Lindström, Dennis, Beesley, Hui, Kar, Lemaçon, Soucy, Glubb, Rostamianfar, Bolla, Wang, Tyrer, Dicks, Lee, Wang, Allen, Keeman, Eilber, French, Qing Chen, Fachal, McCue, McCart Reed, Ghoussaini, Carroll, Jiang, Finucane, Adams, Adank, Ahsan, Aittomäki, Anton-Culver, Antonenkova, Arndt, Aronson, Arun, Auer, Bacot, Barrdahl, Baynes, Beckmann, Behrens, Benitez, Bermisheva, Bernstein, Blomqvist, Bogdanova, Bojesen, Bonanni, Børresen-Dale, Brand, Brauch, Brennan, Brenner, Brinton, Broberg, Brock, Broeks, Brooks-Wilson, Brucker, Brüning, Burwinkel, Butterbach, Cai, Cai, Caldés, Canzian, Carracedo, Carter, Castelao, Chan, David Cheng, Seng Chia, Choi, Christiansen, Clarke, NBCS Collaborators, Collée, Conroy, Cordina-Duverger, Cornelissen, Cox, Cox, Cross, Cunningham, Czene, Daly, Devilee, Doheny, Dörk, Dos-Santos-Silva, Dumont, Durcan, Dwek, Eccles, Ekici, Eliassen, Ellberg, Elvira, Engel, Eriksson, Fasching, Figueroa, Flesch-Janys, Fletcher, Flyger, Fritschi, Gaborieau, Gabrielson, Gago-Dominguez, Gao, Gapstur, García-Sáenz, Gaudet, Georgoulias, Giles, Glendon, Goldberg, Goldgar, González-Neira, Grenaker Alnæs, Grip, Gronwald, Grundy, Guénel, Haeberle, Hahnen, Haiman, Håkansson, Hamann, Hamel, Hankinson, Harrington, Hart, Hartikainen, Hartman, Hein, Heyworth, Hicks, Hillemanns, Ho, Hollestelle, Hooning, Hoover, Hopper, Hou, Hsiung, Huang, Humphreys, Ishiguro, Ito, Iwasaki, Iwata, Jakubowska, Janni, John, Johnson, Jones, Jones, Jukkola-Vuorinen, Kaaks, Kabisch, Kaczmarek, Kang, Kasuga, Kerin, Khan, Khusnutdinova, Kiiski, Kim, Knight, Kosma, Kristensen, Krüger, Kwong, Lambrechts, Le Marchand, Lee, Lee, Lee, Neng Lee, Lejbkowicz, Li, Lilyquist, Lindblom, Lissowska, Lo, Loibl, Long, Lophatananon, Lubinski, Luccarini, Lux, Ma, MacInnis, Maishman, Makalic, Malone, Kostovska, Mannermaa, Manoukian, Manson, Margolin, Mariapun, Martinez, Matsuo, Mavroudis, McKay, McLean, Meijers-Heijboer, Meindl, Menéndez, Menon, Meyer, Miao, Miller, Taib, Muir, Mulligan, Mulot, Neuhausen, Nevanlinna, Neven, Nielsen, Noh, Nordestgaard, Norman, Olopade, Olson, Olsson, Olswold, Orr, Pankratz, Park, Park-Simon, Lloyd, Perez, Peterlongo, Peto, Phillips, Pinchev, Plaseska-Karanfilska, Prentice, Presneau, Prokofyeva, Pugh, Pylkäs, Rack, Radice, Rahman, Rennert, Rennert, Rhenius, Romero, Romm, Ruddy, Rüdiger, Rudolph, Ruebner, Rutgers, Saloustros, Sandler, Sangrajrang, Sawyer, Schmidt, Schmutzler, Schneeweiss, Schoemaker, Schumacher, Schürmann, Scott, Scott, Seal, Seynaeve, Shah, Sharma, Shen, Sheng, Sherman, Shrubsole, Shu, Smeets, Sohn, Southey, Spinelli, Stegmaier, Stewart-Brown, Stone, Stram, Surowy, Swerdlow, Tamimi, Taylor, Tengström, Teo, Beth Terry, Tessier, Thanasitthichai, Thöne, Tollenaar, Tomlinson, Tong, Torres, Truong, Tseng, Tsugane, Ulmer, Ursin, Untch, Vachon, van Asperen, Van Den Berg, van den Ouweland, van der Kolk, van der Luijt, Vincent, Vollenweider, Waisfisz, Wang-Gohrke, Weinberg, Wendt, Whittemore, Wildiers, Willett, Winqvist, Wolk, Wu, Xia, Yamaji, Yang, Har Yip, Yoo, Yu, Zheng, Zheng, Zhu, Ziogas, Ziv, Lakhani, Antoniou, Droit, Andrulis, Amos, Couch, Pharoah, Chang-Claude, Hall, Hunter, Milne, García-Closas, Schmidt, Chanock, Dunning, Edwards, Bader, Chenevix-Trench, Simard, Kraft and Easton2017) (http://bcac.ccge.medschl.cam.ac.uk/bcacdata/oncoarray/gwas-icogs-and-oncoarray-summary-results/). These summary statistics, which make results of GWAS openly accessible, list for each genetic variant the p-value for testing each variant for association with disease and the OR for disease risk conferred by the variant (with OR = 1 indicating no effect). Technical details for calculating and validating PRS are given in Appendix A.
Survival analysis methods were used to evaluate the contribution of PRSs to risk of CAD and BC. The UK Biobank participants were stratified into quintiles by PRS, and then further grouped into those with the lowest (0–20%), mid (40–60%) and highest (80–100%) genetic risk. First, to confirm the role of PRSs in disease risk at a population level, we used cumulative incidence to visualise CAD and BC risk within the three PRS quintiles, including both incident and prevalent cases (CAD N = 18,830, BC N = 12,699), and stratifying CAD by sex. Differences in disease risk by PRS quintile were tested using log-rank tests.
Secondly, in our primary analysis, we tested for a role of PRSs in risk of incident disease with Cox proportional hazards regression using age as the time-dependent variable in
 \begin{equation}h\!\left( t \right) = {h_0}\!\left( t \right) \times {\rm{exp}}\!\left( {{b_1}{x_1} + {b_2}{x_2} + \cdots + {b_p}{x_p}} \right)\end{equation}
where the hazard function, h(t), is determined by a set of p covariates ( ${x_1},\;{x_2}, \ldots ,{x_p})$
with their impact measured by the coefficients (b
1, b
2,
…,b
p
). Age was recorded in whole years with 0.5 years added to each participant’s event/censoring age to ensure that individuals who experienced an event soon after baseline data collection were not given the same age as the assessment age. As standard in genetic models to remove any design or population effects, all analyses were adjusted for covariates of 20 ancestry-informative principal components, genotyping chip and batch. Incident cases were modelled by their age at onset/diagnosis, and prevalent cases at baseline were omitted. Controls were censored by their age in 2016. For each disorder, two UK Biobank subsets were analysed: the full cohort and the subset of healthy individuals, as defined above. Two regression models were fitted: an uncorrected model and a model correcting for standard risk factors available in the UK Biobank, which enabled us to test the role of PRSs in the presence of well-established socio-demographic and clinical risk factors for both CAD and BC. In all models, the outcome of interest was the hazard ratio (HR) for PRS quintiles, using the mid-PRS (40–60% quintile) as a reference category.
${x_1},\;{x_2}, \ldots ,{x_p})$
with their impact measured by the coefficients (b
1, b
2,
…,b
p
). Age was recorded in whole years with 0.5 years added to each participant’s event/censoring age to ensure that individuals who experienced an event soon after baseline data collection were not given the same age as the assessment age. As standard in genetic models to remove any design or population effects, all analyses were adjusted for covariates of 20 ancestry-informative principal components, genotyping chip and batch. Incident cases were modelled by their age at onset/diagnosis, and prevalent cases at baseline were omitted. Controls were censored by their age in 2016. For each disorder, two UK Biobank subsets were analysed: the full cohort and the subset of healthy individuals, as defined above. Two regression models were fitted: an uncorrected model and a model correcting for standard risk factors available in the UK Biobank, which enabled us to test the role of PRSs in the presence of well-established socio-demographic and clinical risk factors for both CAD and BC. In all models, the outcome of interest was the hazard ratio (HR) for PRS quintiles, using the mid-PRS (40–60% quintile) as a reference category.
2.5 Exploring PRSs and adverse selection
Using our PRS results for BC, we explored adverse selection under the simple assumptions that:
-
1. Everyone would have access to their genetic test results (BC PRS information and BRCA1/2 carrier status) at point of purchase.
-
2. Market participants change their insurance purchasing behaviour to reflect their genetic risk information.
-
3. Participants take no risk mitigating actions (such as lifestyle interventions to reduce their overall risk of disease).
We explored three simple scenarios for adverse selection by varying adjustments to assumption 2 only. Firstly, we assumed that the probability of insurance purchase was proportional to the HR for BC PRS (from the full cohort). In this model, a woman with a PRS HR of 2 would be twice as likely to purchase insurance as someone in the reference group, and a woman with HR of 0.5 would be half as likely to purchase insurance (scenario 1). In scenario 2, we assumed the PRS HR had half the effect, with the probability of purchasing insurance proportional to (HR + 1)/2. In scenario 3, we assumed that the insurance purchase behaviour of women at lower risk of BC (HR < 1) would not change, while those at high risk would behave as in scenario 2.
For each purchasing scenario, multiplying the relative probability of insurance purchase by the percentage of women in the general population in each PRS percentile group, we derive the proportion of women present in each PRS percentile group under the three scenarios. We can then ratio the total risk of BC in each scenario by the risk in the general population to estimate how BC incidence could increase within the insured population. BRCA1/2 mutations were modelled independently of PRS. We assume their prevalence is 0.2% in the general population and that they confer a HR of 5 for BC compared to non-carriers (Kuchenbaecker et al., Reference Kuchenbaecker, Hopper, Barnes, Phillips, Mooij, Roos-Blom, Jervis, Van Leeuwen, Milne, Andrieu and Goldgar2017; Mann et al., Reference Mann, Thorne, Balleine, Butow, Clarke, Edkins, Evans, Fereday, Haan, Gattas, Giles, Goldblatt, Hopper, Kirk, Leary, Lindeman, Niedermayr, Phillips, Picken, Pupo, Saunders, Scott, Spurdle, Suthers, Tucker and Chenevix-Trench2006). A similar analysis was performed for CD, using PRS only.
3 Results
3.1 PRS model results for CAD and BC
In an initial analysis of the role of PRSs in disease risk, cumulative incidence plots confirmed the impact of PRSs on the risk of developing CAD and BC in the UK Biobank (Figure 2). Males and females with PRSs in the highest quintile had a much higher risk of CAD than those with PRS in the mid-quintile (40–60% of PRS distribution) or the lowest quintile (0–20% of PRS distribution). The cumulative risk for CAD (Figure 2(a) and 2(b)) at age 75 was 2.8-fold higher in females and 2.7-fold higher in males when comparing the highest PRS quintile to the lowest. Similarly, cumulative risk for BC (Figure 2(c)) at age 75 in females was 2.8-fold higher in the highest PRS quintile versus the lowest. Log-rank tests confirm that the differences across the PRS groups were highly significant for both the disorders (all with p < 0.0001).
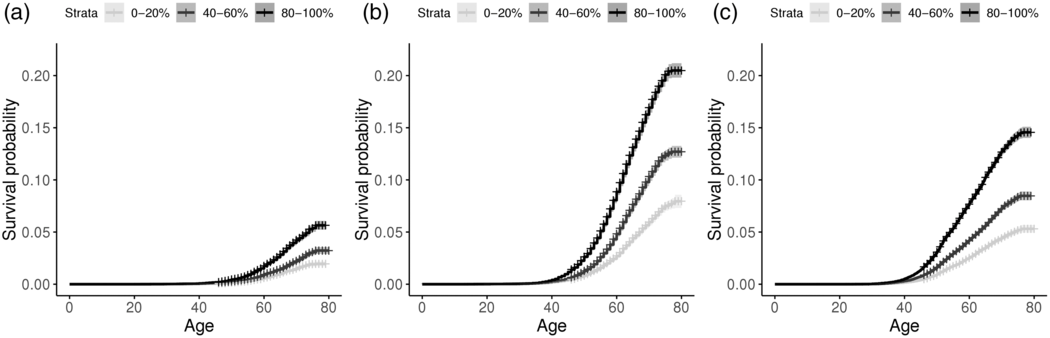
Figure 2 Cumulative incidence plot for incident and prevalent cases of CAD in (a) females and (b) males, and for (c) breast cancer in females, stratifying by low, median and high PRS quintiles.
In our primary analysis, of incident cases who were diagnosed after the baseline assessment, we analysed the effect of PRSs on CAD in the full UK Biobank study (N = 373,022), and in individuals classified as healthy from data reported at the baseline visit (N = 260,791). In total, 6,430 CAD events occurred in the UK Biobank participants, with 3,489 of these events in individuals who were healthy at baseline (Table 1).
The HR for CAD is strongly associated with the PRS percentile, in both the full cohort and healthy individuals (Figure 3; Supplementary Table 1). In the healthy cohort, after adjustment for other risk factors, the 10% of individuals with the highest polygenic risk (PRS percentile 90–100%) had an almost twofold increased risk of CAD compared to those with a PRS percentile 40–60% (HR = 1.97, 95% confidence interval (CI) 1.80–2.16; p = 5 × 10−49). When the full cohort was analysed, the HRs were slightly lower at 1.87 (95% CI: 1.74–2.00). These results confirm that PRSs have a substantial impact on risk of CAD, even after standard risk factors have been accounted for. The results in the unadjusted models were very similar (results not shown).
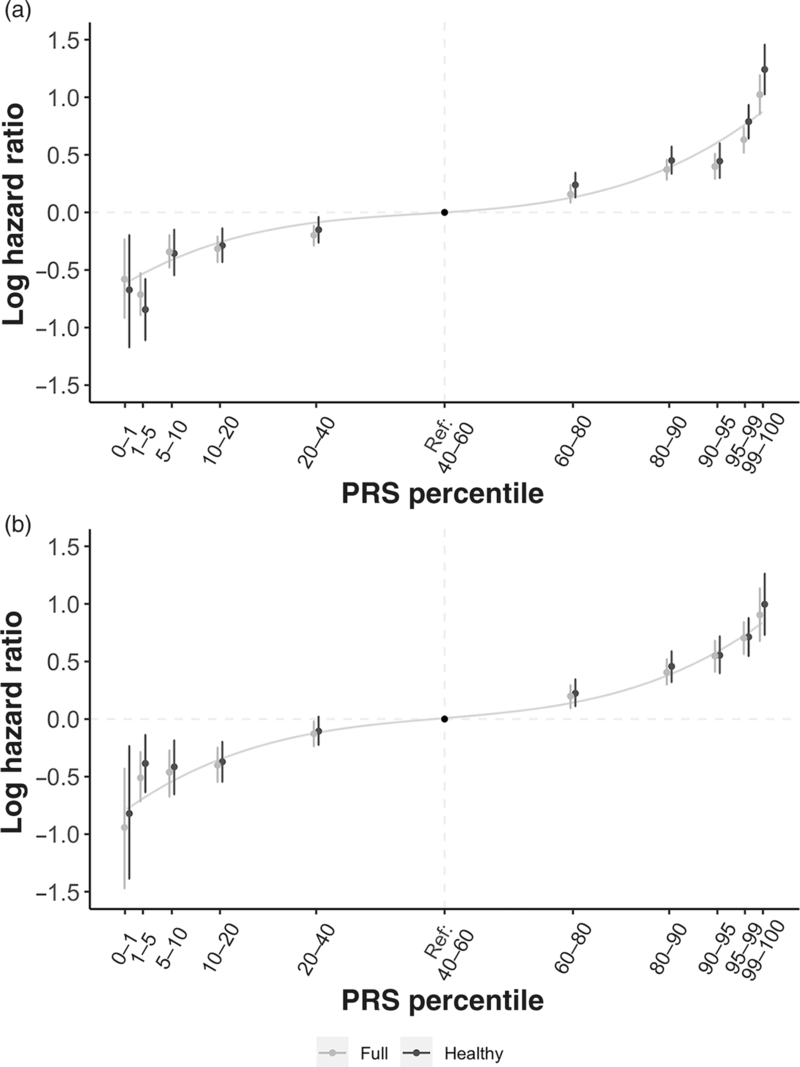
Figure 3 Hazard ratios by PRS percentile for (a) CAD and (b) breast cancer in the full cohort and healthy cohort, using mid-quintile (PRS 40–60%) as reference group.
For BC, the PRS also made a highly significant contribution to risk prediction. Compared to the average risk (PRS percentiles 40–60%), women in the full cohort in the highest 5% of PRS had over twofold increased risk of BC, with HR of 2.56 (95% CI: 2.05–3.19) for women in the >99% PRS percentile, and HR = 2.05 (95% CI: 1.79–2.35) for those at the 95–99 percentiles of PRS. Results were similar in the healthy cohort (Figure 3) and in unadjusted models (results not shown).
3.2 Adverse selection scenarios
Using our PRS results for BC and CAD incidence in the healthy cohort, we generated three simple purchasing scenarios for adverse selection in an insured population (Supplementary Tables 2 and 3). In scenario 1, under the assumptions outlined in section 2, insurance purchasing behaviour exactly mirrors the genetic risk information. In scenario 2, we reduce the impact of knowledge of the genetic risk information to change insurance purchasing behaviour by half that of the genetic risk information. Finally, in scenario 3, insurance purchasing behaviour is half that of the genetic risk information where disease risk is higher than average, but behaviour is unchanged where risk is lower than average.
Under scenario 1, we would see a 12.6% increase in incidence of BC (cost of claims) in the population of insured women and a 15.9% increase in incidence of CAD (cost of claims) in the insured population of men and women. If we assume that prevalence of BRCA1/2 mutations is 0.2% in the general population and these confer a fivefold increased risk of BC, under the same set of assumptions, these would further increase BC incidence by 2.2%. Scenario 2 would result in a 6.6% increase in incidence of BC and an 8.4% increase in incidence of CAD. Including BRCA1/2 mutations, under the same set of assumptions, would further increase BC incidence by 1.2%. Finally, under scenario 3 we would see a 5.0% increase in incidence of BC and a 6.3% increase in incidence of CAD. Including BRCA1/2 mutations, under the same set of assumptions, would further increase BC incidence by 1.1%.
4 Discussion
Analysis of the UK Biobank for two common disorders, BC and CAD, shows that genetic information adds to risk profiling, even in the presence of standard risk factors, and could have an impact on the insurance industry. We subset the full UK Biobank cohort into two groups, a standard risk group and a substandard group, based on various health disclosures and medical histories that broadly – but not precisely – mirror underwriting criteria. The severity of some disclosures, such as hypertension, was not declared, so a pragmatic approach was applied to accept many of these conditions into the standard group noting that risk factors included in the prognostic models may capture the seriousness of the comorbidity (e.g. blood pressure). It is also interesting to note that the UK Biobank participants are generally healthier, more affluent and smoke less than the general UK population – a consequence of the well-known healthy volunteer effect (Fry et al., Reference Fry, Littlejohns and Sudlow2017). Mortality rates in the UK Biobank are roughly half of those that would be expected in the general population. Thus, while the dataset is not ideal to estimate population-level incidence of mortality and morbidity events, it is quite well suited to reflect a standard insured population.
Risk prediction models were built to study the two outcomes in the standard and substandard subpopulations, with adjustment for relevant lifestyle and socio-economic factors, including BMI, smoking, blood pressure and family history for CAD. The results demonstrated that there was approximately a twofold increased risk for those in the top 5% of genetic risk compared to those in the middle per cent of risk (40th–60th percentiles) for both disease outcomes and in both the standard group and the whole population. This is similar to the approximately twofold increased risk for BC and threefold increased risk for CAD observed in individuals at the top 5% of respective PRSs generated in Khera et al. (Reference Khera, Chaffin, Aragam, Haas, Roselli, Choi, Natarajan, Lander, Lubitz, Ellinor and Kathiresan2018). Furthermore, the inclusion and exclusion of non-PRS covariates in the models made very little difference to the predictive power of the PRSs. These results suggest that genetic predisposition significantly contributes to risk prediction beyond the risk factors typically included when underwriting.
4.1 Genetics, insurance and actuarial studies exploring adverse selection
The use of genetic information in insurance is understandably an emotive subject because of the sense of determinism and the subject usually draws a wide-ranging set of views across stakeholders. The topic raises ethical and privacy concerns, so there will likely be increasing levels of scrutiny from regulators and new regulatory policies, both within and beyond the industry, to control the use of genetic information. Nonetheless, a key concern for the life and protection insurance industry is to understand the economic impact that advances in genetics will have if regulations continue to limit the use of this information in underwriting. For a comprehensive discussion of these issues, see Macdonald (Reference MacDonald2000, Reference MacDonald2001).
Insurance practice accepts that risk differs between individuals, but can be predicted with some confidence at a population level. It is this combination of individual uncertainty and group predictability that makes it worthwhile for individuals to purchase insurance and for insurers to sell insurance profitably. Around the world, various regulations have been introduced to limit the use of genetic information in insurance. In May 2017, the Canadian parliament passed Bill S-201 that completely banned genetic discrimination in insurance and the underwriting process. GINA, the Genetic Information Non-Discrimination Act of 2008, is a federal law in the United States that protects people from genetic discrimination in health insurance and employment. Life, long-term care and disability income insurance are currently exempt as lawmakers recognised that underwriting practices differ vastly from that of health insurance. Despite it not being legally binding on its member countries, the Council of Europe (COE) recommended that no genetic tests should be required for insurance purposes. Most recently, the Financial Services Council in Australia announced a moratorium in regard to genetic test results to commence from 1 July 2019.
Restrictions on the use of genetic information in insurance coupled with decreasing cost of DNA testing, including direct-to-consumer genetic testing, increase the possibility of information asymmetry between life insurance companies and applicants. Most actuarial studies exploring adverse selection and genetics have focused on monogenic disorders. These studies agree that genetic carriers of monogenic disorders would face dramatically higher premiums if this information were available in insurance underwriting; however, results are conflicting regarding the costs to insurers from adverse selection. MacDonald & Yu (Reference Macdonald and Yu2011) suggest that the cost to the industry is small because monogenic disorders are rare and because family history information is often still available in underwriting, while other reports have concluded that the costs could be high (see Howard, Reference Howard2016; Howard, Reference Howard2014).
Few actuarial studies have modelled adverse selection coming from genetic predisposition to common disorders. Macdonald & Tapadar (Reference Macdonald and Tapadar2010) found no persuasive evidence that adverse selection is a considerable insurance risk, even if information about multifactorial genetic disorders remains private. Furthermore, adverse selection was deemed impossible if the low-risk stratum of the population was sufficiently large. Another study by Macdonald & McIvor (Reference Macdonald and McIvor2009) calculated premium rates for critical illness insurance based on a woman’s genetic risk of BC; the model included the BRCA1 and BRCA2 genes as well as a polygenic component. The authors found that the polygenic component had a significant impact on premiums in the whole population.
As these papers were published, substantial progress has been made in identifying the genetic underpinnings of multifactorial disorders through GWAS, allowing for the potential use of PRSs to stratify disease risk. The level of risk prediction remains of limited use at individual level in a clinical setting, but is of relevance at a population level.
4.2 Genetics and adverse selection from PRS prediction
Knowledge of one’s genetic susceptibility to disease could affect insurance purchasing behaviours in a way that destabilises insurance principles. Nevertheless, exclusions on access to genetic test results in insurance have been adopted by the industry. Perhaps the reason why these exclusions have been accepted by insurers, without significant concerns, is the beliefs:
-
1. Monogenic mutations that confer significantly higher risk of disease are rare; therefore, the cost imposed on insurers by any associated adverse selection is deemed small.
-
2. Most common diseases are multifactorial, and the genetic contribution to these diseases is modest.
-
3. Genetic test results will not deliver significant risk information that is not already available from traditional clinical measures used in underwriting. For example, an increased genetic susceptibility to CAD may be coupled with commonly accepted health indicators, like raised blood pressure, or increased cholesterol.
-
4. Family history continues to be available as a risk factor in many countries. Any significant genetic contribution to disease will also be captured by family history.
-
5. Genetic risk information will not be widely available in the near future.
Firstly, monogenic mutations are indeed rare. One example is the harmful BRCA1/2 mutations that occur in approximately 0.2% of the general population and increase the risk of BC approximately fivefold (see Kuchenbaecker et al., Reference Kuchenbaecker, Hopper, Barnes, Phillips, Mooij, Roos-Blom, Jervis, Van Leeuwen, Milne, Andrieu and Goldgar2017; Mann et al., Reference Mann, Thorne, Balleine, Butow, Clarke, Edkins, Evans, Fereday, Haan, Gattas, Giles, Goldblatt, Hopper, Kirk, Leary, Lindeman, Niedermayr, Phillips, Picken, Pupo, Saunders, Scott, Spurdle, Suthers, Tucker and Chenevix-Trench2006).
Secondly, most common diseases are polygenic with a large number of genetic variants affecting disease susceptibility. No single variant can be used in risk prediction because each one has only a modest effect, but genetics research is making rapid progress in identifying the polygenic component of common diseases. PRSs aggregate the modest effects of a large number of genetic variants, associated with disease susceptibility, to provide considerable risk prediction at the population level. The scenarios we assessed for adverse selection all showed substantial increases in incidence rates, albeit under simple, exaggerated assumptions, including that all individuals have access to genetic risk. Although these numbers are high, an important finding is the relative importance of information on polygenic risk compared to rare monogenic mutations. Supposing insurance purchasing behaviours were the same for both types of genetic information, we observe that approximately 80–90% of the observed increases in incidence are a result of polygenic risk information, with only roughly 10–20% explained by the mutations in BRCA1/2. This is unsurprising given PRSs identify a much larger proportion of the population at significantly increased risk of disease compared to rare monogenic mutations. The possibility of adverse selection will amplify as the predictive power of PRSs increases (because further genetic variants contributing to risk are identified as GWAS increase in sample size).
The impact of PRSs on disease risk has also be shown in the clinical literature. Khera et al. (Reference Khera, Chaffin, Aragam, Haas, Roselli, Choi, Natarajan, Lander, Lubitz, Ellinor and Kathiresan2018) showed that 8.0% of the population were at greater than threefold increased risk for CAD (although we note that only genetic effects were modelled, with no additional risk factors included). The size of the high-risk group (8%) is 20-fold greater than the carrier frequency of a rare monogenic familial hypercholesterolemia mutation that occurs in roughly 0.4% of population and also increases the risk of CAD threefold (Khera et al., Reference Khera, Chaffin, Aragam, Haas, Roselli, Choi, Natarajan, Lander, Lubitz, Ellinor and Kathiresan2018; Nordestgaard et al., Reference Nordestgaard, Chapman, Humphries, Ginsberg, Masana, Descamps, Wiklund, Hegele, Raal, Defesche, Wiegman, Santos, Watts, Parhofer, Hovingh, Kovanen, Boileau, Averna, Borén, Bruckert, Catapano, Kuivenhoven, Pajukanta, Ray, Stalenhoef, Stroes, Taskinen and Tybjærg-Hansen2013). For BC, 1.5% of women were at threefold increased risk, approximately 8 times greater than the carrier frequency of BRCA1/2 pathogenic variants although these confer higher risk. Accordingly, the genetics and insurance discussion, which has mostly concentrated on rare monogenic disorders, should seriously consider the importance of genetics in multifactorial disorders.
On belief three, our results show that PRSs are predictive even after adjusting for conventional risk factors, establishing that PRSs predict BC and CAD alongside traditional underwriting risk factors. Furthermore, Khera et al. (Reference Khera, Chaffin, Aragam, Haas, Roselli, Choi, Natarajan, Lander, Lubitz, Ellinor and Kathiresan2018) showed in the UK Biobank that conventional risk factors such as hypercholesterolemia were present in only 20% of those with threefold risk or greater based on the PRS (compared to 13% of those in the remainder of the distribution). Hypertension was observed in 32% versus 28%, respectively. This suggests that few individuals with high genetic risk would be identified using only traditional risk factors.
Concerning the fourth belief, Abraham et al. (Reference Abraham, Havulinna, Bhalala, Byars, De Livera, Yetukuri, Tikkanen, Perola, Schunkert, Sijbrands, Palotie, Samani, Salomaa, Ripatti and Inouye2016) and Tada et al. (Reference Tada, Melander, Louie, Catanese, Rowland, Devlin, Kathiresan and Shiffman2016) have shown that PRSs for CAD are significantly predictive of the disease even after controlling for self-reported family history, although Khera et al. (Reference Khera, Chaffin, Aragam, Haas, Roselli, Choi, Natarajan, Lander, Lubitz, Ellinor and Kathiresan2018) showed a 44% rate of positive family history in those at over threefold increased risk of CAD compared to 35% in the remainder of the population. We also found that in both our BC and CAD risk models, the exclusion of family history as a predictor (as well as other covariates) made very little difference to the risk of these diseases by PRS percentile.
Finally, on belief five, the rapidly falling cost of genetic testing as well as the ease of access to testing through the tremendous growth in the direct-to-consumer (DTC) genetic testing market suggests genetic risk information may be widely available in the near future. In 2017, over 7 million DTC genetic tests were sold (see MIT Technology Review, 2018). Most tests were in the ancestry testing market, not health testing, but the tests give purchasers access to their genetic data from which they could calculate their own PRSs, uploading to interpretation sites. In the clinical arena, genetic testing is currently focussed on whole genome sequencing for monogenic disorders (https://www.genomicsengland.co.uk/), and not yet on genotyping for polygenic prediction.
Several limitations of our results warrant discussion. The UK Biobank participants are not representative of the general UK population, although the risk factor associations agree closely with those observed in population-based cohorts (Batty et al., Reference Batty, Gale, Kivimaki, Deary and Bell2020). Our adverse selection scenarios are founded on some very basic assumptions. Foremost, we made an assumption that everyone would have access to their PRS which is not sensible currently, but access to PRSs is set to increase. For example, a potential application of PRSs is in identifying those with higher cancer risk, to enable personalised screening regimes; this could be conceived as part of a national healthcare initiative, which would mean all people would have access to PRS information. Secondly, we assumed that market participants would change their insurance purchasing behaviour to directly reflect their genetic risk information. This assumption is at least based on some economic rationale, but the decision to buy insurance is critical. Thirdly, we made no adjustments to consider risk mitigating actions, although current literature on the importance of this is conflicting (see Hollands et al., Reference Hollands, French, Griffin, Prevost, Sutton, King and Marteau2016). For example, women with increased susceptibility to BC may be more vigilant in cancer screening, which means they will more likely be diagnosed and treated at an earlier stage, resulting in increased survival rates (see Lowden, Reference Lowden2004). We also make no attempt to model the clinical significance of genetic test results and advances in genomic medicine. For example, interventions such as prophylactic surgery and chemoprevention may be adopted. More generally, if genetic testing becomes widespread, then we may also expect new personalised treatments and interventions to reduce overall risk. Our BC PRS findings are directly relevant if considering adverse selection in a female-only cancer product, but are not immediately relevant to consider adverse selection in many other individually underwritten insurance policies including critical illness where genetic susceptibility to many different diseases would be important to model simultaneously. Nonetheless, we saw similar genetic risk differentiation in our CAD PRS model, so we would expect the genetic risk differentiation to be similar for many common diseases. Further research is imperative to assess the degree of correlation between PRSs for different common diseases to estimate the overall adverse selection impact on insurance products like critical illness – the impact would be substantially reduced if we assume that this correlation is likely to be quite weak. It will also be critical to better understand people’s behaviour when faced with genetic testing information, and what benefits we can expect to see from genomic medicine, including prevention of disease manifestation, pharmacogenomics and motivating lifestyle changes to improve health.
5 Conclusions
Disease prevention and early disease detection are critical for extending human longevity. During the past few years, research papers have demonstrated that PRSs capture important information about an individual’s risk of developing common diseases. A person’s genetic risk can be measured from birth; therefore, in theory, a newborn’s PRS could enable disease prediction long before the typical age of onset of the disease and possibly decades before the disease’s clinical risk factors become apparent. Nonetheless, it is worth remembering that genetics only forms part of a person’s disease risk profile, with environmental risk factors clearly also contributing.
The research presented here concentrates on common genetic variants. We have demonstrated that prediction of common, multifactorial diseases, using PRSs, provides population risk information that is largely independent of normal underwriting risk factors. The use of PRSs in genomic medicine remains an emerging risk issue for the insurance industry, and we must continue to monitor and develop research on both the science and consumer behaviour on the potential impact. Equally we should also consider the opportunities and the positive impact on the insurance industry; genomic medicine will almost certainly lead to improvements in mortality and longevity, which will be positive for the industry and for society.
Many scientific, clinical and social obstacles must still be overcome to bring PRSs into clinical practice. Improvements in polygenic risk profiling capabilities are essential. In particular, methods are needed to enable prediction estimates to be adjusted based on an individual’s ancestry, demographics and clinical information (most genetic research carried out to date has only been among populations of European ancestry). Furthermore, any application of PRSs for precision medicine would need to overcome significant challenges. Polygenic medicine represents a paradigm shift and education for clinicians and the public will be imperative to hasten clinical uptake. Regardless, the era of polygenic medicine is approaching fast: the leap in the scientific understanding of polygenic risk profiling and the explosion in public interest in genetics have brought us to a point where, in due course, PRSs will almost certainly have a place in clinical risk prediction and potentially in insurance risk stratification, if regulations allow.
Acknowledgements
Funding for this research was provided by RGA Reinsurance Company, an MRC-funded PhD studentship (to NS), MRC grant MR/N015746/1, and by the National Institute for Health Research (NIHR) Biomedical Research Centre at South London and Maudsley NHS Foundation Trust and King’s College London. The views expressed are those of the authors and not necessarily those of the NHS, the NIHR or the Department of Health and Social Care. High-performance computing facilities were funded with capital equipment grants from the GSTT Charity (TR130505) and Maudsley Charity (980). This research has been carried out using the UK Biobank application number 23203 (to King’s College London). RGA provided funding, support and guidance, but did not have access to any data. The views expressed are not necessarily those of RGA.
Supplementary material
To view supplementary material for this article, please visit https://doi.org/10.1017/S1748499520000226
Appendix A
UK Biobank Phenotype Data
The UK Biobank is a health study of over 500,000 individuals who were aged between 40 and 69 years at recruitment from 2006 to 2010. The recruitment process was coordinated at 22 centres in the United Kingdom (see Allen et al., Reference Allen, Sudlow, Peakman, Collins and UK2014). Individuals within travelling distance of these centres were identified using NHS patient registers (response rate = 5.47%; see Sudlow et al., Reference Sudlow, Gallacher, Allen, Beral, Burton, Danesh, Downey, Elliott, Green, Landray, Liu, Matthews, Ong, Pell, Silman, Young, Sprosen, Peakman and Collins2015). Invitations were sent using a stratified approach to ensure demographic parameters were in accordance with the general population. All participants provided written consent and the current study was ethically approved for data access by King’s College London by the UK Biobank Ethics and Governance Council (REC reference 11/NW/0382; UK Biobank application reference 23203). At baseline visit to a UK Biobank recruitment centre, participants provided data on demographic variables, physical measures, and health in verbal interviews and with touch-screen questionnaires. Additional data on medical diagnoses were available from Hospital Episodes Statistics (2016 update), death registry and cancer registry data, enabling us to identify diagnoses of coronary artery disease and breast cancer post-baseline assessment.
UK Biobank Genotype Data
Blood samples from the UK Biobank participants were genotyped using the UK BiLEVE array or the UK Biobank axiom array. Further details on the genotyping and quality control (QC) can be found on the UK Biobank website (http://www.ukbiobank.ac.uk/scientists-3/genetic-data/). In the current study, SNPs were removed if they had missingness < 0.02 and minor allele frequency < 0.01. Samples were removed from the dataset if they had missingness < 0.01. A subgroup of individual with European ancestry was defined using 4-means clustering applied to the first two principal components of the genotype data. One of each pair of related individuals was removed using a relatedness criterion of King statistic < 0.088. Exclusions based on heterozygosity and missingness were implemented under the recommendation of the UK Biobank (http://biobank.ctsu.ox.ac.uk/showcase/label.cgi?id=100314 ). Samples were removed if sex was discordant between the phenotype and genotype records. SNPs deviating from Hardy–Weinberg equilibrium were removed at a threshold of p < 10−8. This QC process resulted in a data set of 560,204 SNPs and 385,702 samples available for analysis with genotype data.
Calculating PRSs
GWAS summary statistics for CAD and BC were downloaded and the information on the SNPs was matched to genotyped SNPs in the UK Biobank participants. SNPs were clumped to minimise their linkage disequilibrium (LD) using an r 2 ≥ 0.1 threshold in sliding windows of 250 kb. PRSs were calculated by summing the number of risk alleles carried by an individual, weighted by the logarithm of the odds ratio for disease risk. PRSs were calculated using SNPs meeting 14 significance thresholds of between 5 × 10⁻⁸ and 1 in the GWAS analysis. PRSs were generated for the UK Biobank individuals and regressed on the UKB CAD and breast cancer phenotype (including both incident and prevalent cases) to select the GWAS p-value thresholds with the most predictive model for each disorder. Models were fitted using logistic regression with CAD (N cases = 18,830) and BC (N cases = 12,699) case–control status as the outcome, adjusted for the first 20 ancestry-informative principal components, genotyping chip and batch. PRSs were standardised, so reported effect sizes are scaled by the PRS standard deviation.
Defining healthy UK Biobank participants
A healthy subgroup was derived in order to examine whether the PRS results were attenuated in this group. These individuals were defined according to a list of 444 self-reported health issues. An experienced underwriter from RGA Reinsurance Company examined this list and marked each health condition as “likely acceptable for standard life insurance rates” or “not likely acceptable for standard life insurance rates”. A total of 184 out of 444 self-reported health issues were marked as “not likely acceptable for standard life insurance rates”, so any UK Biobank participant self-reporting any one of these 184 health issues was excluded from the healthy subgroup. The full list of self-reported health issues is available as a Supplemental file.


