


Introduction
Aeolian “snowforms” result from interaction between wind, snow and topography. They are very similar to their relatives in sands which have been extensively studied by geologists in actual desert environments and in geological records. It is known that any natural form generated by a flow, be it of water (rivers, oceans, tides, etc.) or of air (wind), has an asymmetric pattern resulting from the direction of the flow.
In this work we study the drifting-snow phenomena at an Alpine site, with particular emphasis on the accurate determination of local wind directions and the distribution of snow denudation and accumulation zones through the observation, measurement and mapping of snowforms and drifts. The aim is to find out whether the focal wind directions on extensive surfaces in mountain areas (of about a few km2) are independent of the main wind intensity and direction, and whether valid erosion and accumulation zones are spatially stable and can be established for dominant winds. If so, this could enable decisions to be taken in the management of mountain areas that will reduce wind effects.
Previous Works
There have been a number of studies of snow-surface modelling by wind, often tied to the great international campaigns in Antarctica. Reference MellorMellor (1965) provided a detailed morphologic description of aeolian snow structures. Reference Doumani and ŌuraDoumam (1967) investigated aeolian snow structures in Antarctica. He distinguished between erosion and deposition structures and suggested the possibility of reconstructing ecological conditions at the time of deposition from the interpretation of the structures.
Other authors carried out studies in Alpine areas (e.g. Reference Föhn and MeisterFohn and Meister, 1983; Reference DuclosDuclos, 1993; Reference CastelleCastelle, 1995; Reference Naaim-BouvetNaaim-Bouvet, 1997; Reference GauerGauer, 1998). These works focused mainly on snow flux measurements and modelling.
Reference MasesMases (1997) used aeolian snowforms to produce surface wind-direction maps in the Torrent Negre sector at the ski resort La Molina, eastern Spanish Pyrenees. Reference Mases, Font and VilaplanaMases and others (1998) studied a natural snowdrift development and its evolution through snowdrifting events. In Reference FontFont (1999) the use of aeolian susceptibility maps (ASMs) in the management of a ski resort is presented.
Aeolian Snowforms
Aeolian snowforms result from the interaction between wind, the snow mantle and the underlying topography. The asymmetric pattern of these forms is due to wind direction. There are two main types of classification of the snow structures. The first deals with the orientation of the longest axis of the structure in relation to the flow, and considers that structures can be transversal (ripples, barchans and waves) or longitudinal (sastrugi, pits and dunes). The second classification deals with the nature of the process that controls the formation of the structure, and considers that structures can be erosion-dominated (pits, sastrugi and footprints) or accumulation-dominated (ripples, dunes, waves and barchans). Both processes, erosion and accumulation, coexist, but the dominant one determines the classification.
Another type of structure is one which we classify as obstacle-related snowform (obstruction drifts and rime). These shadow forms inform us, not about erosion or accumulation, but about the wind direction.
The snow-surface condition (type and size of the grains, intergranular bonding and the amount of intergranular water) plays a major role in the resulting form.
Identifying the different aeolian snowforms allows the experts to determine:
the wind direction which generates them and thus the adaptation of the wind to local topography, i.e. surface wind directions. the nature of the prevailing process in the forms’ generation, and thus whether the process in a precise location is predominantly erosive or accumulative.
other information: the approximate wind speed which generates them (at wind speeds of > 15 ms–1 the transverse features evolve into longitudinal ones), the availability of snow to be drifted and the snow-surface condition before the drifting event (Reference FontFont, 1999).
The main forms observed and mapped in this work are sastrugi, which result from erosion, and dunes, ripple marks and obstruction drifts or shadow structures, which result from accumulation.
Sastrugi generally occur in elongated forms, 0.2–1.5 m high and 1–2 m long. This is a result of differential wind carving in the snowpack when the surface layer is harder than the underlying layer (Reference MellorMellor, 1965; Reference FontFont, 1999). The width of sastrugi is around one-fifth of the length.
Ripples are small transverse waves which form in cold, loose snow where winds are light. They develop in the same way as sand ripples, and are often found in the shelter of obstacles or other major structures (Reference MellorMellor, 1965). They are 0.05–0.2 m long and 2–5 mm high (from trough to crest).
Dunes develop mainly under blizzard conditions, i.e. strong winds plus precipitation, because a significant amount of fresh snow is needed to build them. Dunes are longitudinal features; in open snowfields their width is one-fifth of their length, more or less 10 m (Reference MellorMellor, 1965). The long axis of the dune is parallel to the dominant wind.
Obstruction drifts or shadow forms develop on the lee side of obstacles. They form a main ridge, with the highest point by the obstruction, which serves as an apex to a triangular facet facing the obstruction. These forms are deposition structures produced by the effect of a flow obstruction.
Major snowforms such as dunes, sastrugi or barchans may act as an obstacle, at the lee face of which minor depositional structures may develop.
Methodology
ASMs are produced by the integration of the surface wind-direction maps and the spatial snow-distribution maps.
Surface wind-direction mapping
The first step in the generation of an ASM is the mapping of the surface wind directions inferred from the snowforms, and thus the production of surface wind direction maps. The observation of these maps allows visualization of the interaction between the wind and the topographical features.
We have observed that wind episodes with similar wind directions generate aeolian snowforms at almost identical locations and with similar orientations. Therefore the surface wind-direction maps of these episodes resemble each other. Differences of around 20° in the wind direction of two different wind episodes are well reflected on the aeolian snowforms and thus also in surface wind-direction maps.
Spatial snow-distribution mapping
In this second type of information, and through observation of the aeolian forms and mapping of the snowdrifts, we set the boundaries of the prevailing accumulation and erosion zones. Erosion and accumulation processes may coexist, and what is considered in the mapping is the dominant process. We also observe minor forms (principally ripples and small sastrugi) coexisting with major structures, so sastrugi are often found at the windward front of a dune or a barchan, and ripples leeward of sastrugi. Consequently, when mapping aeolian forms we have to be selective and avoid mixing structures of different scales, especially when considering which is the dominant process that formed them. Minor structures respond to minor processes and to very local eddies, so expert discernment is required.
In our study area, erosion is the dominant process, which implies that sastrugi are the most frequent forms measured. However, depositional forms, principally dunes, are also found in some areas.
Sastrugi and dunes are stable during wind episodes that have similar wind directions. These aeolian snowforms are always found in the same places even if their orientations are slightly different (Reference FontFont, 1999). Thus, their distribution permits the boundaries of erosion and accumulation zones to be set according to the different forms mapped. These boundaries are not always well defined, and the transition zones may be in the order of meters (<10m). Although these boundaries are dynamic and move with wind intensity, their perimeters are well defined for similar wind episodes.
Local topography, particularly slope ruptures, is the main factor controlling the distribution of erosion and denudation zones. This control was observed in all the surveys made after each wind episode. The importance of slope angle in controlling the distribution of erosion and depositional zones was also observed at Stillberg, Swiss Alps (Reference Mases, Buisson, Good and VilaplanaMases and others, 1995).
In Figure 1 we show three topographic profiles alongside wind direction. We observe that small changes in the slope angles, of 3–7°, in a topographic profile alongside the wind direction may produce a change in wind behaviour in the snow cover. In consequence, if the wind blows uphill, as in Figure 1, a convexity in the topographic profile (decrease in slope angle) generates a prevailing accumulation zone immediately upwind of the slope change. On the other hand, a concavity in the topographic profile (increase in slope angle) accelerates the flow that generates a prevailing erosion zone.
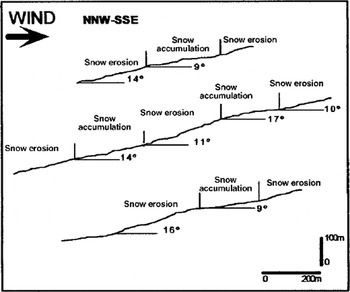
Fig. 1 Topographic profiles showing the relation between snow erosion and deposition with slope-angle variations.
ASMs synthesize information about the surface wind direction and erosion and accumulation zones. They are representative of a specific wind direction (Fig. 2).

Fig. 2. Diagram summarizing the main steps in the generation of the ASMs.
Applications: Example of the Redesign of the Tosa D Alp Area, La Molina
In winter 1998/99, in the framework of the improvements to be carried out in the Tosa dAlp area around La Molina ski resort, a field campaign was carried out in order to determine surface wind directions and the spatial distribution of snow.
Methodology and results
An exhaustive follow-up of the meteorological conditions was done from mid-December 1998 until May 1999. Four ASMs were drawn up during this period. The density of the sampling affects the accuracy of the final map, and depends on the aims of the study. In this case we mapped around two aeolian snowforms per 25 m2, depending on the existence of the forms, their preservation, and so on. The first step, as mentioned above, was the mapping of the surface wind-direction maps. Simultaneously, we mapped the snowdrifts, which allowed us to set out the boundaries of the erosion and accumulation areas.
Of the four ASMs, two are of northerly winds and the other two of northwesterly and westerly winds. The dominant winds in the area are northerly, northwesterly and westerly (Reference Font, Mases and VilaplanaFont and others, 1998). In this paper we present two of these four maps, one for the northerly winds and the other for the northwesterly winds (third and second episodes in Table 1) (Figs 3 and 4).

Fig. 3. Example of the ASM result of the drifting-snow episode of 10–12 February 1999. Application of the methodology of the aeolian snowforms and spatial distribution of snow mapping in the redesign of Dues Estacions ski slope, La Molina.

Fig. 4. Example of the ASM result of the drifting-snow episode of 1–2 January 1999. Application of the methodology of the aeolian snowforms and spatial distribution of snow mapping in the redesign of Dues Estacions ski slope.
Table 1. Main features of the wind episodes that produced the aeolian snowforms mappedfor the study of the Tosa d’Alp improvements

The wind data were obtained at an automatic weather station (Reference Font, Mases and VilaplanaFont and others, 1998). We define the snow available for drifting as the upper layer of the snow cover liable to be eroded by the wind. These maps show the accumulation zones, and we regard the other areas as erosion zones. We group the maps in function of the wind directions that generated the mapped forms and snowdrifts. Therefore the December and February maps are very similar, as are the April and January maps.
North-wind ASMs
Comparing the north-wind maps for December and February, we observed that the snowdrifts were much smaller in December than in February. This is attributed mainly to the availability of snow to be drifted, which was much less in December than in February. In both maps the snowdrifts formed at almost identical spots. The directions inferred from the aeolian snowforms mapped are also very similar. Combining both maps, we are able to set out the boundaries of the problematic zones in the studied area for the northerly winds. As an example of these maps, in Figure 3 we present the map resulting from the drifting-snow episode of 10–12 February 1999.
Northwesterly- and westerly-wind ASMs
The April and January maps show the existence of an accumulation zone in the upper area of the ski slopes, above 2315 m (Fig. 4). These areas make up a small basin, situated leeward of the westerly winds, which accumulates significant amounts of snow during westerly-wind drifting-snow episodes. Below this altitude the westerly winds affect only the ski slopes. The main differences between the snowdrifts are in their size rather than their exact location. The accumulation areas are more extensive in January than in April, which is attributed to the availability of snow to be drifted. By combining the northwesterly- and westerly-wind maps we obtain a good delimitation of the erosion/accumulation zones and also a good representation of the surface wind directions for the northwesterly and westerly winds. As an example of these maps, in Figure 4 we present the map resulting from the drifting-snow episode of 10–12 February 1999.
We have determined the accumulation/erosion zones for a specific wind, we divide the ski slope into sectors according to the problems posed by this wind and analyze in detail the wind effects in each sector. Then, knowing the wind adaptation to topography (surface wind directions), we can take action to minimize the wind effects. A series of steps is proposed for avoiding or taking advantage of the wind effects.
In the example presented in this work, we must consider the dominant winds of the region in order to improve the design of the ski slope. When applying the method to the specific problematics of redesigning the ski slope, we must consider as much information as possible. Therefore, we propose a synthesized map for the three principal wind directions, northwest, west and north, summarizing all the information obtained in the previous maps (Fig. 5).

Fig. 5. ASM for the Dues Estacions area (Tosa d’Mp) for northerly, northwesterly and westerly winds. Application of the methodology of the aeolian snow forms and spatial distribution of snow mapping in the redesign of Dues Estacions ski slope.
Once the ASM is produced, we can propose some solutions to the drifting-snow problem in the area. In this example, focused on improving a ski slope, we propose the relocation of old snow fences and the implantation of new ones.
In Figure 5 we show the boundaries of the erosion/accumulation zones, the average surface wind directions, the proposed new snow fences and the relocation of some of the old ones. The map in Figure 5 is the result of combining the four ASMs and synthesizing the surface wind directions measured from the aeolian snowforms.
Further investigations are needed to improve our knowledge of the effects of the pre-drifting snow surface condition on the final forms and snowdrifts and their spatial distribution. However, the use of these maps by the managers of La Molina ski resort has decisively affected the redesign of Dues Estacions ski slope in the Tosa dAlp sector.
Conclusions
The observation and recognition of aeolian snow structures are the first steps towards elaborating surface wind-direction maps and ASMs.
While mapping surface wind direction we observed:
The relation between the wind direction and topographic features is the controlling factor in surface wind directions, and variations of 15–20° in wind direction are clearly reflected in surface wind-direction maps.
Wind intensity affects the exact placement as well as the dimension of the aeolian structure, but not the orientation itself, and so has little effect on surface wind-direction maps.
While mapping the aeolian susceptibility zones we observed:
At an alpine site, local topography is the controlling factor in the localization of snow erosion and deposition zones. Small variations in wind direction, of 15–20°, do not significantly affect the locations of erosion and deposition zones.
Wind intensity is the main influence on the size of aeolian structures. Higher-intensity episodes form elongated deposits and displace the transition boundaries between erosion and deposition zones. This is enhanced by the fact that for similar wind episodes, erosion and deposition zones are situated in the same areas.
On a windward slope, slope ruptures control erosion and deposition processes. A slope rupture that decreases the slope angle causes a proportional decrease in the flow speed and produces a deposition zone. On the other hand, when there is an increase in the slope angle there is an increase in the wind speed, and consequently an erosion zone.
The methodology proposed for studying the spatial distribution of snow by the wind has been used in the redesign of an old ski slope at La Molina. Results have had a strong bearing on decision-making about the design of the slope, the relocation of old snow fences and the placing of new fences. Study of the spatial distribution of the snow by the wind, and knowledge of the mean surface wind directions influenced the managers at La Molina to decide to improve the slope.
Therefore we consider that the prediction of spatial snow distribution by wind in mountain areas, without the need for expensive instruments, has a valuable part to play in the management of mountain and ski resorts and roads and in avalanche forecasting. This method was applied in other locations in winter 1999/2000 and we plan to compare it with some of the existing numerical models.


