


Introduction
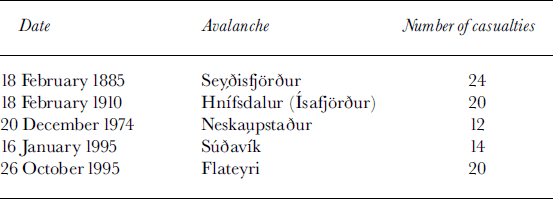
Iceland is located in the North Atlantic Ocean in an area of high cyclone activity. The climate and the mountainous landscape cause frequent avalanches in many areas of the country. Reference BjörnssonBjörnsson (1980) describes the general avalanche situation in Iceland. Iceland was settled in the ninth century AD, and the avalanche chronicle dates back to 1118, when an avalanche killed five people in western Iceland. Since 1851 a total of 307 persons have been killed by avalanche and landslide accidents. A total of 90 of these fatalities occurred in five accidents in small coastal villages where 12 or more people were killed in each accident (see Table 1). The location of the most important villages that are threatened by avalanches is shown in Figure 1.

Fig. 1. Villages in Iceland threatened by avalanches.
Table 1. Casualties in the largest avalanche accidents in Iceland
There were relatively few avalanche accidents in Iceland during the mid-20th century, probably due to relatively favourable climate conditions. The accident in Neskaupstaður in 1974 prompted some work on avalanche prevention, and the first law on avalanche prevention and control was passed in 1985. Subsequently, avalanche hazard zoning was carried out for several of the hazard-prone villages. The fatalities due to the avalanches in Súðavík and Flateyri in 1995 occurred mostly within areas considered “safe”according to this hazard zoning, and this led to the realization that the hazard-zoning procedure had been inadequate. The legislation on avalanche hazard zoning and control was rewritten (the current law was passed in 1997) and more funding was made available for avalanche research. The Icelandic Meteorological Office (IMO) was made responsible for most aspects of avalanche work, including hazard zoning, emergency evacuations and consultation regarding the construction of defence structures (Reference MagnússonMagnússon, 1998).
Following the new law, a regulation on avalanche hazard zoning, based on individual risk, was issued in 2000 (Iceland: Ministry for the Environment, 2000). Although the zoning is based on risk, the expression “hazard zoning”, not “risk zoning”, is used to describe the process since this is the traditional term. The hazard-zoning methodology used by the IMO was developed in collaboration with the University of Iceland (Reference Jónasson, Sigurðsson and ArnaldsJónasson and others, 1999). Based on these methods and the regulation, hazard zoning has been carried out for the most vulnerable villages in Iceland. In the following, the risk estimation method is outlined briefly and some results of the application of the method are summarized.
Hazard Zoning Based on Individual Risk
In Switzerland and Austria the delineation of hazard zones is based on the estimated frequency of snow accumulation in starting areas of avalanches. A physical model is applied to calculate a corresponding run-out of avalanches. In Switzerland the limit of the hazard zones is located at the calculated run-out of an avalanche corresponding to snow accumulation in the starting area with a frequency 1/300 a–1. In Norway the limit of the hazard zones is delineated where the frequency of avalanches is estimated to be 1/1000 a–1.
Risk is the probability of a loss or injury. The loss can take several forms, such as economic loss, environmental damage or loss of lives. Models to evaluate risk usually deal with the risk as a product of factors. The World Meteorological Organization has proposed a risk model for weather-related hazards (WMO, 1999). The WMO model splits the risk in a hazard-prone area into hazard potential (hazard frequency and intensity) and vulnerability. If individual risk is to be estimated, the exposure of the individual to the hazard-prone area should be incorporated.
Although the economic loss due to avalanches in Iceland has been significant (Reference Jóhannesson and ArnaldsJóhannesson and Arnalds, 2001), the loss of lives is a dominant factor when considering the acceptability of the risk for the society. Furthermore, the avalanche risk is typically quite concentrated. It has been estimated that about 5000 people live in densely populated areas of Iceland where there is a considerable avalanche hazard. This estimate has been confirmed by the hazard-zoning work. In the past few decades the average number of deaths due to avalanches in these areas has been about two per year. This indicates an average annual individual risk of about 4610–4 for people living in these areas. This is about five times the average annual individual risk due to traffic accidents in Iceland. The risk within the most endangered areas is of course much higher and thus unacceptable by any measure. After some deliberation, it was decided to base the Icelandic hazard-zoning regulation on individual risk. Reducing the individual risk would also reduce the aggregated risk to the society. Since only a small proportion of the population is exposed to the risk, an acceptable risk for the individuals will most likely also lead to acceptable risk for the society.
The Icelandic risk model can be split into four modules. The first two are the estimated frequency of avalanches in the slope above the area where the risk is to be estimated, and the run-out distribution of avalanches. These two components together encompass the hazard-frequency part of the general risk model. The vulnerability is represented by the probability of being killed if staying in a house that is hit by an avalanche, and the exposure is the proportion of the time that a person is expected to spend within the hazard-prone area.
Although the Icelandic risk model is the first method of this kind to be put into operation for avalanche hazard zoning, it should be noted that Reference Keylock, McClung and MagnússonKeylock and others (1999) proposed a method for estimating individual avalanche risk based on run-out ratios, and Reference WilhelmWilhelm (1997) analyzed the economic risk to traffic due to avalanches.
Transferring avalanches
In order to estimate the run-out distribution of avalanches in a particular avalanche path, it is usually necessary to include, implicitly or explicitly, information about run-out lengths in other avalanche paths. This is because the observed avalanches in each path are usually few, and a reliable statistical estimate cannot be obtained from the limited local observations alone. In order to facilitate an estimation of the run-out distribution, it is useful to transfer avalanches between slopes. It is possible to use both physical and topographical models for the transfer of avalanches between paths, and different statistical approaches can be used. Sigurðsson and others (1997) have attempted to classify the different types of transfer methods. The transfer method used in the Icelandic risk model is built around the PCM (Perla–Cheng–McClung) model of avalanche flow. The model is a physical model with two free parameters, the Coulomb friction parameter μ and the mass-to-drag parameter M/D (Reference Perla, Cheng and McClungPerla and others, 1980). However, the curvature term, κ, is separated from the M/D term in our version of the model, i.e. the differential equation of the model is

where u denotes the speed of the avalanche, s the distance along the path, θ its slope, and g the gravitational acceleration. In the numerical solution, a smoothing procedure is applied, so that the path has a continuous curvature rather than being composed of straight-line segments.
There is an infinite number of parameter pairs (M/D; μ) that will simulate the run-out length of a given avalanche in a given avalanche path. We refer to this set of pairs in the (M/D; μ) space as an isorunline. In order to find a single pair to simulate each avalanche, the choice of possible parameters is restricted to a line in the parameter space, called the parameter axis. It would be possible simply to fix the value of μ and thereby using M/D as the single parameter to describe the size of the avalanche. Since there seems to be a difference in the effective value of the Coulomb friction when simulating large and small avalanches with the PCM model, this would not be realistic. It was therefore decided to vary both the μ and M/D parameters as is done subjectively in traditional applications of the PCM model. The chosen axis has the equation
This, of course, is a simplification, but the resulting parameter values are within a range suggested by studies of the PCM model in other countries, and it has furthermore been shown that the final risk estimate is not very sensitive to the location of this axis (Reference Jónasson, Sigurðsson and ArnaldsJónasson and others, 1999). Figure 2 shows the isorunlines of several Icelandic avalanches together with the parameter axis. In order to transfer an avalanche from one path to another, i.e. to find a likely run-out distance in the second path, we find the parameter pair which is the interception between the axis and the isorunline of the avalanche for the first path. A simulation with the PCM model and this parameter pair is then run in the second path.
Fig. 2. Isorunlines of a few well-known Icelandic avalanches and the parameter axis.
Run-out distribution
The transfer of avalanches makes it possible to transfer avalanches in a dataset collected in many avalanche paths to a single path and subsequently estimate the distribution of run-out lengths. The dataset used for the Icelandic risk model consists of 196 avalanches that were recorded in 81 different paths. To estimate the run-out distribution in a given path, one could transfer all these avalanches to the path. To simplify the procedure and to avoid problems caused by unevenness in the run-out area, the approach adopted has been to estimate the distribution in a single artificial path and then transfer this globally estimated distribution to the path under consideration. The path used for the estimation is chosen to be typical for Icelandic avalanche slopes. It is parabola-shaped, 700m high and 1600 m long. This slope is referred to as the standard path. The probability density of the run-out lengths is estimated using kernel estimation (e.g. Reference SilvermanSilverman, 1986). It should be noted that special consideration must be given to the dataset. There is reason to believe that in the dataset of 196 avalanches there are far too few small avalanches compared to longer ones. This bias is estimated using data from avalanche paths where records are more complete, and the probability distribution is corrected accordingly. The probability density of the run-out length, r, is referred to as f(r).
The run-out length of avalanches in the standard path also gives a numerical measure for the run-out length. We call the run-out length in the standard path the run-out index. The unit of the run-out index is hectometres, so that an avalanche that reaches 1540 m in the standard path has a run-out index of 15.4. The run-out index is also a useful concept in the absence of avalanches: we can, for example, say that a location where an avalanche with run-out index 13 would stop has run-out index 13. The run-out index concept can be extended to other types of transfer methods (Sigurðsson and others, 1997).
Frequency
If we estimate the frequency of avalanches at one location in an avalanche path, the run-out distribution will provide us with frequency estimates for other parts of the slope. Let us assume that the frequency is estimated at run-out index r0. For confined paths with complete records of avalanches for T years and a total of Nr0 avalanches with run-out greater than r0, the estimated frequency at r0 is simply
The frequency at another location in the path, r, may then be estimated as

The lower the value of r0 (i.e. the shorter the run-out), the more statistically reliable the estimate of the frequency becomes because Nr0 will then be higher. However, avalanche records are more likely to be incomplete for low values of r0. The completeness of the recordings also differs with time: the further back we go the more incomplete the records become. It can therefore be of advantage to estimate the frequency at several points in the path using different observation periods and compare the estimates.
The estimation of avalanche frequency can be adapted to unconfined slopes, taking into account the average width of avalanches and the total width of the slope. The statistical reliability of the frequency estimate for confined slopes can also be improved if it can be assumed that adjacent paths have similar characteristics and therefore the same frequency. The frequency is then estimated jointly for all the paths (Reference Jónasson, Sigurðsson and ArnaldsJónasson and others, 1999).
Vulnerability
The vulnerability of persons to avalanches will depend on several factors, such as whether they are inside a building, the strength of the building, and the ![]() and speed of the avalanche. For the avalanches in
and speed of the avalanche. For the avalanches in ![]() and Flateyri, information is available about how many people were staying in each of the houses that were hit and how many were killed. The speed of the avalanches when they hit the houses was estimated using the PCM model. Figure 3 shows the proportion of people killed as a function of the calculated speed. As expected, the probability of being killed increases sharply as the speed increases. It is plausible to assume that this probability is approximately proportional to the kinetic energy of the avalanche. However, even at high speeds there seems to be some chance of surviving, and therefore a non-zero probability of survival is assumed in the limit of very high speeds. A continuously differentiable function has been fitted to the data using maximum likelihood estimation with the assumption that the probability of being killed is
and Flateyri, information is available about how many people were staying in each of the houses that were hit and how many were killed. The speed of the avalanches when they hit the houses was estimated using the PCM model. Figure 3 shows the proportion of people killed as a function of the calculated speed. As expected, the probability of being killed increases sharply as the speed increases. It is plausible to assume that this probability is approximately proportional to the kinetic energy of the avalanche. However, even at high speeds there seems to be some chance of surviving, and therefore a non-zero probability of survival is assumed in the limit of very high speeds. A continuously differentiable function has been fitted to the data using maximum likelihood estimation with the assumption that the probability of being killed is
Fig. 3. The death rate in the avalanches at Flateyri and Súðavík as a function of avalanche speed. The numbers within the bars indicate the number of people that were at home for each speed interval. The curve is the fitted death probability (cf. Equation (5)).

The value of the terminal death probability is chosen to be c = 0.95. This gives the estimates V1 = 23.0, k = 0.00130 and a = 1.151, b = 18.61. The , fitted function is shown in Figure 3. The data from ![]() and Flateyri are considered to be representative for the consequences of avalanche impact on non-reinforced single family houses in Icelandic hazard areas.
and Flateyri are considered to be representative for the consequences of avalanche impact on non-reinforced single family houses in Icelandic hazard areas.
Exposure The exposure of persons to the avalanche hazard depends on their age and the type of building. For homes the exposure can be as high as 75%, but in industrial buildings it will rarely be more than 30%. The Icelandic hazard-zoning regulation, described below, adopts the concept local risk, which is defined as the annual probability of being killed for a person that stays all the time in a non-reinforced building. The local risk therefore omits the exposure. The actual risk may in each case be found given an appropriate assumption regarding the exposure.
Risk model
Given an estimate, Fr0, of the avalanche frequency at a particular location, r0, in an avalanche path, the individual risk at any location in the path may be readily obtained. The risk contribution of avalanches that exceed the given location, r, where the risk is to be estimated can be represented as an integral:

where υr(s) is the speed of an avalanche with run-out s at location r. The purpose of the second integral is to normalize the run-out density function in the interval [r0, ∞).
Acceptable risk
When individual involuntary risk is 510–6 a–1, there is usually no reason for mitigation. When the annual risk is as high as 10–4 (approximately the risk of fatal traffic accidents in Iceland) there are, on the other hand, grounds for taking costly actions to reduce it. Thus an acceptable individual risk level will usually lie somewhere between these values. During formulation of the hazard-zoning regulation, the acceptable risk level was considered from several view-points, with the safety of children being the most important factor. The total annual mortality rate of children in Iceland is about 2610–4. It is clearly unacceptable that children living in areas threatened by avalanches have a much higher mortality rate than other children. It was considered acceptable that avalanche risk would contribute about 10% to thetotal risk of children, keeping in mind that other factors in the environment might be favourable, such as lower risk of traffic accidents. The acceptable risk for homes was thus set at 0.2610–4. Taking the exposure of 75%, this gives an acceptable local risk of about 0.3610–4 if the person is not exposed to significant avalanche risk when not at home.
Application of Risk Model
Parallel to the development of the risk model, it was applied to practical hazard-zoning projects and the results were compared to the results of other zoning methods. Since the regulation on avalanche hazard zoning was issued in 2000, hazard maps have been finalized for seven villages.
Regulation
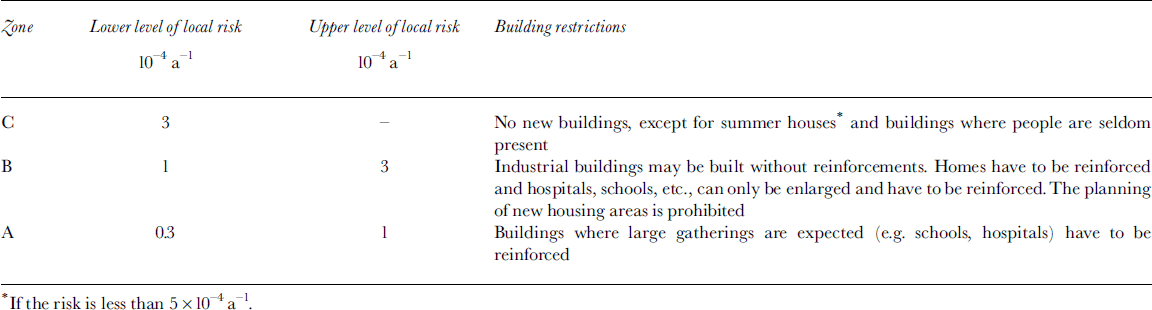
The Icelandic regulation on hazard zoning is based on the local risk described above. The local risk of 0.3610–4 a–1 is defined to be acceptable for residential areas, and three types of hazard zones are defined where the risk is progressively higher (see Table 2). The guidelines for the zoning and utilization of the hazard zones are tailored to attain the acceptable risk level in residences when the exposure and increased safety provided by reinforcements have been taken into account. For industrial buildings the guidelines probably correspond to a somewhat higher risk, but this may be justified by the absence of children.
Table 2. Icelandic hazard-zone definitions
Comparison with other methods
In 1997 a pilot project was carried out to delineate hazard zones in Seyðisfjörður, eastern Iceland, by several different methods. Three groups of experts proposed hazard maps.
Firstly, an Icelandic group proposed a hazard map based on Icelandic methods and the (then proposed) regulation. Secondly, Norwegian experts made a hazard map according to Norwegian regulations and methods. Finally, an Austrian avalanche expert made a hazard map based on Austrian methods and regulation. Comparison of the results indicates that the Icelandic hazard-zoning regulation is somewhat stricter than those in effect in Norway and Austria. The acceptable risk level may be about three times lower in Iceland than in the other two countries (Reference ArnaldsArnalds, 2001).
Completed hazard-zoning projects
The first hazard map according to the regulation was finalized in May 2001, for the village of Neskaupstaður, eastern Iceland. Since then five other maps have been completed, for Seyðisfjörður, Eskifjörður, safjörður and Bolungarvík, in that order. The majority of houses in urban areas of Iceland that are threatened by avalanches are located in these communities. Other types of rapid mass movements on steep slopes, such as slushflows, landslides and rockfalls, also threaten some of the areas. The Icelandic hazard-zoning regulation requires that these hazards should also be accounted for in the risk estimates. A comprehensive risk model has not been developed for these types of hazards, and a more subjective approach has therefore been necessary. The avalanche risk-estimation methods described above have been applied to some paths in all the areas where hazard maps have been finalized. It should, however, be noted that the dataset which forms the basis for the risk model consists mostly of avalanches from relatively high slopes (by Icelandic standards), i.e. 500–800m high. On lower slopes it has been necessary to adapt the results of the risk model subjectively. Since the model is based on a one-dimensional avalanche model, it does not give an indication of the lateral extent of the hazard zones. For that purpose, the Austrian avalanche model SAMOS (SnowAvalancheMOdelling and Simulation; Reference Zwinger, Kluwick and SamplZwinger and others, 2003) has been run for most of the investigated avalanche paths. The results of the risk model have then been adjusted according to the results of the SAMOS simulations.
The hazard-zoning regulation defines a framework for the hazard-zoning process. The communities which are endangered by avalanches request a risk assessment from the Ministry for the Environment. The ministry appoints a hazard-zoning committee with two representatives from the ministry and two from the community. The hazard-zoning committee then requests a risk assessment from the IMO. The committee reviews the IMO’s results and presents them to the public in the community. It has proved useful for representatives of the community to be involved in most of the hazard-zoning process and to take responsibility for the final result. As part of the procedure of introducing the hazard maps, reports relevant to the hazard zoning are published on a web page (www.vedur.is/snjoflod/haettumat).
Case study
Figure 4 shows a hazard map for the eastern part of Neskaupstaður. The mountain above the settlement rises to 700–900ma.s.l. The mountainside is cut by many large gullies, which accumulate snow during northerly winds. Two avalanches, to the west of the area shown on the map, resulted in a tragic accident in 1974. The lower parts of four of the main avalanche paths (which total about seven) in the eastern part of Neskaupstaður are located in the area. The frequency of avalanches from the seven main gullies was considered to be comparable, except for Urðarbotn where the frequency is lower. The frequency was therefore estimated jointly for all the gullies except Urðarbotn, yielding an estimate of F13 = 0.05, i.e. five avalanches per century from each gully with run-out beyond run-out index 13. The frequency from Urðarbotn was considered to be five times lower, due to the size, shape and location of the starting areas. Given the frequency estimate, Equation (6) is used to calculate the risk by numerical integration. The hazard lines directly below the gullies represent risk calculations with the Icelandic risk model using the frequency estimates. The shape of the hazard lines is otherwise based on the results of SAMOS simulations and on subjective judgment.
Fig. 4. A hazard map for the eastern part of Neskaupstaður, scale 1:10 000. The solid line indicates the boundary of the categoryA hazard zone, the dashed line the boundary of the B zone and the dashed-dotted line the boundary of the C zone ( cf. Table 2). Also shown are several of the longer recorded avalanches and their dates. The avalanches were released from the starting areas Urðar-botn, Drangagil, Nesgil and Bakkagil, counting from west to east. The area is to the east of the area where the accidents in 1974, that are mentioned in the text, took place. The lines along the slope are longitudinal sections used for the model computations. The numbers adjacent to the lines indicate run-out indices.
Conclusion
The results of the risk calculations indicate that the average probability of being killed if staying in a house in the Icelandic hazard zones that is hit by an avalanche is about 0.1–0.25. Given the acceptable local risk of 0.3610–4 a–1, this indicates an acceptable annual exceedance probability of avalanches in the range from 1/7500 to 1/3000. These are very low probabilities and can be difficult to communicate to the public. The use of individual risk has proved to be useful in this situation, since it makes it possible to compare the avalanche risk to other risks that people are more familiar with. In some cases, this has changed the risk perception of the public and increased their risk awareness.
One way of checking the validity of the risk estimate of the hazard maps is to aggregate the total risk in all seven villages, take the age of the villages into account, and compare the result with the actual number of fatalities in past avalanche accidents. A rough calculation of this type indicates that the risk has been somewhat overestimated on average. A possible explanation is that in an uncertain situation where the hazard zoning relies heavily on subjective judgment the experts tend to be conservative. However, we believe that where the risk model is directly applicable, i.e. in typical avalanche paths with recorded avalanches, the risk estimates are less biased.
Although the risk model leaves many gaps for the experts to fill in with their personal judgment, based on experience, it provides a framework for that judgment. It enables them to structure their decisions and provides them with a useful tool to formulate the final result.


