


Introduction
The Italian side of the Mont Blanc Group, Western Alps, high Aosta valley, is quite different from the French side, due to its steep slopes and high relief energy. It is periodically subject to catastrophic events, with serious consequences for human activities. These events are covered by ample historical and bibliographical documentation, from which the frequency of landslides and avalanches clearly emerges (see Reference CapelloCapello, 1958; Reference Dutto and MortaraDutto and Mortara, 1991).
The present study examines the avalanche of 18 January 1997, which revealed unusual characteristics in regard to its formation. The avalanche developed almost entirely on the surface of Brenva glacier, and involved the whole lower stretch of Val Veny, high Dora Baltea-Po basin, which, running southwest-northeast, follows the southern flank of the mountain group (Fig. 1).

Fig. 1. Sketch map of Brenva glacier area.
Geographical Features of the Brenva Area
Brenva glacier is a valley glacier with a maximum length of 7.5 km, a maximum width of 2.15 km and a mean tongue width of 0.5 km; it covers 7.3 km2 (Fig. 2). Feed is partly direct and partly from avalanches.

Fig. 2. Brenva glacier and the avalanche of 18 January 1997.
Between 2460 and 2550 m a.s.L, the tongue is divided transversally into two sectors by a rock step, the “Pierre a Moulin”. Up-valley from this step lies the active part of the glacier; the down-valley sector is detached from the main body, with which it lacks dynamic continuity. The lower sector is completely covered by debris.
In recent years, Brenva glacier has been subject to intense retreat accompanied by a great reduction in thickness and changes in its geometry. In higher glaciated areas of Mont Blanc, these changes occurred together with a considerable increase in the equilibrium-line altitude (ELA) and permafrost limits, especially in south-facing basins like the Brenva. These events led to poor slope stability, as exemplified by the landslides of summer 1996 and winter 1997 in the high basin of the Brenva, and others reported more recently on the Drus and Aiguille Noire de Peuterey (personal communication from AV. Cerutti, 1998).
Avalanche at 1455 H on 18 January 1997
As shown by ground-based photographs and television shots of the event, the phenomenon could be defined as a mixed flowing and airborne powder avalanche (Fig. 3). Indeed, it was accompanied by a large cloud about 800 m high, but a large part of it was subject to movements along the surface of Brenva glacier. Using a television sequence, the rate of displacement of the avalanche’s front between 2500 and 1700ma.s.l. was calculated at > 70 m S–1. From the viewpoint of type of movement, therefore, its characteristics may be considered intermediate or mixed. Moreover, in the deposition area, large quantities of ice in the form of spheroidal blocks and grains were observed. This was ascertained both during clearing and repair operations undertaken immediately after the event, and several months later. The material deposited by the avalanche also contained a certain amount of debris (about 10%), sometimes up to 1 m3 large, dragged from the surface moraine and the internal flanks of the lateral moraines.
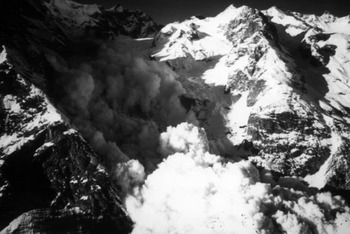
Fig. 3. The Brenva basin and the airborne powder avalanche of 18 January 1997.
The avalanche began under the southern flank of the Sperone della Brenva (3587 m a.s.L), at the head of the cirque on the south side of the high basin of the glacier, with a starting-point altitude of not less than 3500 m (Fig. 4). Once under way, the avalanche first advanced over the southern sector of the glacier and then included the whole width of the tongue, extending well beyond the west lateral moraine. After travelling a distance of 5.5 km, the main mass stopped on the bottom of Val Veny and blocked it with snow and ice about 25 m thick. Here the worst destruction occurred, both as a direct result of impact and due to the effect of the aerosol component. The latter occurred (Fig. 5) over a very large area, including a wide belt of forest on the opposite (southern) flank of the valley. The avalanche killed two skiers who were following the “re-entry piste”, caused structural damage to the Hotel Val Veny (1478 ma.s.l.) and to power lines, and knocked down 1625 fully grown trees with a maximum age of 100–120 years and an average diameter of 35 cm, over a surface area of 60 000 m2. It should be recalled that another avalanche with similar features, in January 1995, starting from the slopes of the Tour Ronde, travelled along Brenva glacier until it reached the bottom of Val Veny, destroying 5300 trees over a surface area of 170 000 m2 and damaging buildings and power lines.
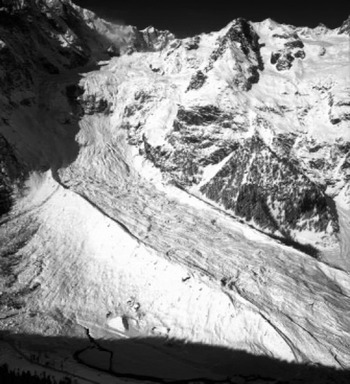
Fig. 4. Brenva glacier and path of the avalanche of 18 January 1997.
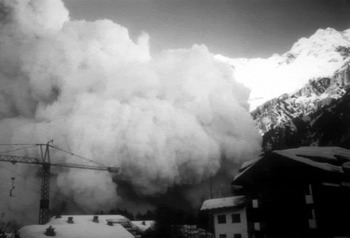
Fig. 5. The cloud of the avalanche of 18 January 1997, seen from Entrèves.
At the moment of the 18 January 1997 avalanche, the snow depth was sufficiently detailed from data recorded at several stations in the Gourmayeur area. At Plan Checroui (1700 m a.s.1.), the snow was 123 cm deep on 18 January. On the same day, the two automatic stations of Mont de la Saxe and Plan Praz (both at 2050 ma.s.l.) supplied mean snow thicknesses of 193 and 175 cm, respectively. At the Italian entrance to the Mont Blanc tunnel (1381m a.s.1.), from 18 November 1996 (date of the first snowfall) until January 1997 (the last snowfall before the avalanche), a total accumulation of 500 cm of snow was recorded, against a mean of 188 cm for the 30 year period during which the tunnel had been functioning (1965–97). This corresponds approximately to 50 cm we. and thus to an in situ snow cover of 165–170 cm. Lastly, data compatible with those supplied by the measuring stations were obtained from the snow cover on the structures of Hotel Val Veny, observed immediately after the avalanche.
Hypotheses on the Cause of Formation of the Avalanche
The 18 January 1997 avalanche occurred very close in time to a rockfall which affected the southern flank of the Sperone della Brenva, near the starting area of the avalanche itself. A connection of cause and effect between the two phenomena may therefore be hypothesized, a link that clearly emerged from an interpretation of available data and from ground observations.
Since 1991, aerial photographs have shown the existence of debris fans on the surface of the glacier, at the base of the Sperone della Brenva. These fans, an index of active mass movements, were not visible on the aerial photographs of 1975. The phenomenon showed progressive evolution, first with the collapse of some thousands of cubic metres of rock in August 1996, then with the collapse of about 600 000 m3 of rock on 16 January 1997, and lastly with a further mass of 1500 000 m3 (estimated by means of topographic measurements and geographic information system elaborations carried out on the source area) at 1455 h on 18 January. The last collapse was immediately followed by the formation of the avalanche studied here.
The material from the various landslides accumulated on a glaciated plateau immediately under the main scarp (Fig. 6), between 3320 and 3340 m a.s.1., at the base of the southern flank of the Sperone della Brenva.
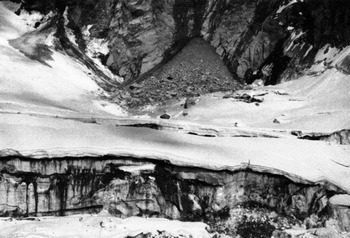
Fig. 6. The accumulation/an of the rockfalls of 16 and 18 January 1997.
Although the formation of the avalanche took place concomitantly with the landslide itself, the cause and effect between the two phenomena can only be considered indirect. This is because the landslide did not continue its movement along the surface of the glacier. If it had, it would have removed the snow cover in front of it. Instead, on the edges of the large transverse crevasses, just below the accumulation of landslide material, the winter snow cover was practically intact at the end of July 1997, and this was still the case at the beginning of autumn.
The starting area of the avalanche of 18 January 1997, as already noted, was the cirque southwest of the Sperone della Brenva. Photographs of snow-cover conditions, taken during the days immediately after the avalanche, show obvious traces of the passage of masses of snow, ice and/or firn moving down-valley, together with blocks abandoned along the slope and many impact craters due to the blocks themselves falling from above (Fig. 7). This situation did not appear in photographs taken 2 days before the event. The fall of these blocks must have originated from the hanging glaciers along the head of the cirque, in unstable conditions.
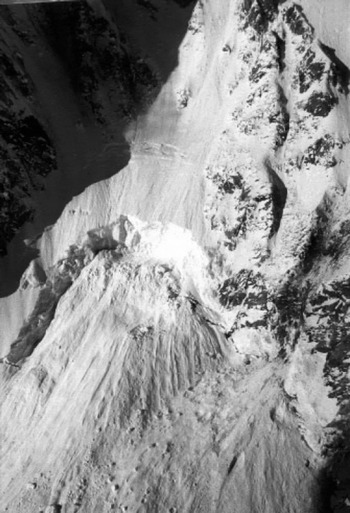
Fig. 7. Probable starting area of the avalanche of 18January 1997.
It is therefore believed that the rockfall and its shock were the cause of the contemporary fall of seracs from the hanging glaciers, with consequent formation of the avalanche. That is, the rockfall cannot be considered the main cause of the avalanche, which in fact originated from a complex process which led finally to the formation of a mixed flowing and airborne powder avalanche.
As well as the above considerations, this conclusion is based on seismograms (Reference Kishimura and IzumiKishimura and Izumi, 1997) from the Lago Serru station, Ceresole Reale, Torino, the nearest station (45 km) to the Courmayeur-Mont Blanc area. These recordings indicate what happened on Brenva glacier on 16 and 18 January 1997.
At 1256 h on 16 January, a low-energy event (Richter magnitude 1.2–1.3) lasting about 15 s was recorded. At 1320 h on 18 January another event occurred, of slightly lower energy (Richter magnitude 1.0–1.1) but lasting 20–25 s. Both recordings were identified with rockfalls on the flank of the Sperone della Brenva.
At 1455 h + 25 s on 18 January, an event with Richter magnitude 2.0, lasting about 4 min, was recorded. The seismograms showed two distinct phases: the first, slightly less energetic but with a relatively sudden start, lasting about 1 min 20 s, followed by a second, more energetic, phase lasting 1 min, and then a gradual decrease in signal amplitude until 1501 h.
Although these analyses do not provide definite information on the development of the phenomenon, it is reasonable to conclude, based also on television shots which documented the event from its beginning, that:
the first phase corresponds to the landslide;
the initial part of the second phase represents the fall of seracs from the overlying hanging glaciers and/or possible new rockfalls;
the final signal, lasting about 3 mm 30 s, is mainly due to the avalanche.
Therefore, as the concomitant occurrence of seismic energy release was ascertained, the hypothesized process does not conflict with the report of P. Mougin (1925, quoted by Reference VivianVivian, 1975) of the possible formation of avalanches of snow or of snow and ice, caused by earthquakes. Events of this kind have indeed taken place in the Mont Blanc area on several occasions, in particular on 12 December 1803 (intensity VI Mercalh, Canciani Sieberg scale (MGS); epicentral zone: Courmayer (Reference PostpischiPostpischi, 1985)); on 11 March 1817 at Les Houches, France (VII MCS (Reference Boschi, Guidoboni, Ferrari, Valensise and GasperiniBoschi and others, 1997)), with the formation of numerous avalanches that killed four people; and on 13 August 1905 (Reference VivianVivian, 1975) (or 29 April 1905 (Reference PostpischiPostpischi, 1985; Reference Boschi, Guidoboni, Ferrari, Valensise and GasperiniBoschi and others, 1997)) in the whole Arve Valley, France (VII-VIII MCS; epicentral zone: La Vachey), with the formation of numerous avalanches of snow and ice for > 6 hours.
Avalanche Dynamics Model
A numerical model (Reference AndreettiAndreetti, 1996) has been used to simulate the Brenva avalanche dynamics and runout. The principal features of this model are briefly reported as follows.
The model considers the snow mass as a Newtonian fluid. The problem is examined in a two-dimensional field by assuming (Reference VoellmyVoellmy, 1955) that the snow-flow features are those of an incompressible fluid moving along an open channel.
The snow motion is described by dynamic equilibrium equations. The mass-continuity equation is written by considering:
the variability of the mass density (Reference Brugnot and PochatBrugnot and Pochat, 1981);
the motion resistance depending on the kinetic friction coefficient and a second term which depends on the square of the mass velocity and which can be considered as being composed of three different contributions:
-
the increment of the sliding friction with the slope curvature;
-
the advancing friction, which is proportional to the mass increment for the path unit (Perla, 1980);
-
the air resistance, which is considered as a viscous resistance type.
The numerical model was previously applied to the analysis of a real case, the Rio Fosse snow avalanche in northwest Italy. In this case the condition of the incipience of a snow motion and the features of the detached snow mass were assessed according to the snow depth in the feeding Rio Fosse basin and the physical and morphologic characteristics governing the problem.
The input data used for the Brenva avalanche dynamic model are:
the slope profile in the central vertical section where the motion occurs;
the area of the feeding zone;
the average depth of snow in the feeding zone;
the snow density, which is considered constant in this application;
the kinetic friction coefficient;
a law to define the increment of the snow mass along the travelled slope;
the turbulent viscous friction resistance, given by the three components quoted above.
A parametric analysis of the snow-mass motion was carried out by considering:
a constant snow-mass density equal to 300 kg m–3;
a linear variation of the snow mass along the travelled slope by starting from an initial volume of 100 000300 000 m3;
a kinetic friction coefficient varying from 0.2 to 0.35;
a turbulent viscous frictional resistance which can be globally considered as representing an average 10% of the kinetic friction resistance;
two different paths of the snow mass; both of them are defined by two sections in which the motion is contained. In both cases the first section represents the slope profile from the rockfall detachment zone and the “Pierre a Moulin”; the second section represents the slope profile from the “Pierre a Moulin” and the bottom of Val Veny;
two different starting elevations of the snow-mass motion, at 3750 and 3550 m a.s.l.
The numerical results obtained by the parametric analysis can be compared with the data gathered by the television and photographic images and taking into account that the modelled and the real phenomenon are different.
The type of avalanche can be defined as an intermediate movement of a recent snow mass between a sliding of a stiff layer and an aerial motion of cloudy avalanche. The motion starts with the features of the sliding of a stiff body and develops with the formation of an upper cloudy phase which has different characteristics of volume, height, velocity and runout. The numerical model can only simulate the motion of a stiff snow layer and cannot analyze the formation of a cloudy phase and its movement characteristics.
Examination of the numerical results shown in the velocity-avalanche-path diagram in Figure 8 allows the following considerations:
in the higher part of the slope, up to about 3000 m a.s.l, the snow mass reaches a velocity of > 40 m f1;
since a cloudy snow phase can occur for velocity of about 10 m s–1, it is realistic to assume that the snow motion can have a turbulent character;
the avalanche motion decelerates before reaching the “Pierre a Moulin”, and for a kinetic friction coefficient of >0.3 stops travelling. The deceleration phase is caused by the snow travelling about 800 m along a slope of about 20°.

Fig. 8. Velocities model for an avalanche of 100 000 m3 for different values of the kinematic friction coefficient.
The parameters which best fit the real runout avalanche phenomenon are a kinetic friction coefficient equal to 0.2 and an initial volume of the snow mass equal to 300 000 m3. Under these assumptions, as reported below, the best agreement is found between, on the one hand, numerical results and, on the other hand, the available television and photographic images and the in situ surveys carried out in the following spring and summer.
The path of the modelled avalanche stops between the bottom of the valley and the opposite slope. The deposition area of the flowing avalanche has been assessed to be in the same zone, where a snow and ice layer of about 25 m was surveyed.
The computed volume increment of the snow mass along the travelled slope is equal to 18 times the initial volume. This corresponds to an average height of the snow layer in the deposition zone of about 46 m. Comparison of these results with the real situation suggests that about 45% of the snow mobilized during travelling passed from the phase of flowing avalanche to that of cloudy avalanche. Examination of aerial photographs and the observations carried out during in situ surveys allow us to consider this assumption realistic.
The computed velocities of the flowing avalanche are, in the path down the “Pierre a Moulin”, in the range 35–60 m s-1 in the acceleration and 60–0 m s–1 in the deceleration and deposit zone. The television images recorded for this path of the avalanche allow observation of both types of movement: the sliding of a stiff snow layer and the aerial motion of a cloudy avalanche. However, it has been possible to assess the average velocity of the cloudy avalanche, which is 70 ms–1 down the path between 2500 and 1700 m a.s.l. The cloudy avalanche was arrested by a direct impact against the opposite slope.
Conclusions
The results show that the avalanche was not directly triggered by the rockfall, but was a consequence of the serac fall from the hanging glaciers caused by its seismic shock (Richter magnitude 2). Furthermore, seismograms have allowed two distinct phases to be identified: the first corresponds to the rockfall; the initial part of the second one corresponds to the serac fall and/or new rockfalls, and the final signal, lasting > 3 min, to the avalanche.
The numerical model applied to predict the path of the avalanche can give important information forecasting the avalanche-dynamics behaviour and the runout even though it cannot be used to simulate the aerial motion of a cloudy snow avalanche.
The model can predict the velocity that can be reached by a snow layer during travel, and therefore the possibility of the formation of a cloudy snow avalanche. In addition, the numerical model is able, when the input data are reliable and calibrated with in situ measurements, to assess the potential increment of volume of flowing avalanche during travel.
The observed avalanche can be regarded as predictable on the basis of conditions at the site at the moment the event occurs, and in particular the slope morphology, the snow volume present in the feeding basin and the mechanical features of the potentially unstable snow mass.


