


Introduction
The natural snowpack is a layered porous medium. The layered structure is caused by different depositional events and subsequent metamorphic processes, with the result that adjacent layers have different properties. Surface melting and meltwater percolation can further influence the physical and mechanical properties. Movement of meltwater within the snowpack is a complex phenomenon and may lead to various heterogeneities like ice layers, ice lenses, melt–freeze crust and drainage tubes (Reference SharpSharp, 1951). The permeability of snow, to a large extent, governs water flow across different layers and is a sensitive parameter for hydrological studies including snowmelt runoff models (Reference ShimizuShimizu, 1970).
For hydrological runoff applications, the point measurements of permeability are of relatively little use for a snowpack having various layers of distinct physical properties. A snowmelt lysimeter is the only suitable field method for estimating the equivalent permeability of an entire snowpack (Reference Fox, Williams and TroendleFox and Williams, 1999). A lysimeter collects and measures meltwater outflow from the base of the snowpack. Snowmelt lysimeters have been used to provide physical measurements for testing models of snowpack energy balance and meltwater percolation within the snowpack (Reference Obled and RosséObled and Rossé, 1977; Reference ColbeckColbeck, 1979; Reference Marsh and WooMarsh and Woo, 1985; Reference Kustas, Rango and UijlenhoetKustas and others, 1994; Reference KattelmannKattelmann, 2000; Reference Tekeli, Sorman, Sensoy and SormanTekeli and others, 2003). Reference Whitaker and SugiyamaWhitaker and Sugiyama (2005) studied seasonal snowpack dynamics through field measurements using lysimeters for a mountainous catchment. Various authors have estimated the equivalent permeability of a natural snowpack using lysimeter data (Reference ColbeckColbeck, 1977; Reference Colbeck and AndersonColbeck and Anderson 1982; Reference JordanJordan 1983). Reference McGurk, Kattelmann and KaneMcGurk and Kattelmann (1986) compiled snow permeability values estimated by various investigators using different methods, and observed variations by three orders of magnitude.
In this paper, the design and installation of a snowmelt lysimeter at Patsio field research observatory, Himachal Pradesh, India, is presented. The snowmelt generated at the snow surface is estimated based on the energy-balance approach. The modeled surface melt along with the lysimeter discharge data are then used to estimate the equivalent permeability of the snowpack during late winter in 2006/07 and 2007/08.
Experimental Site and Meteorological Measurements
The research site, Patsio (32°45′N, 77°15′E; 3800ma.s.l.), is located in the Great Himalayan range of the northwest Himalaya, approximately 160 km from Manali on the Manali–Leh highway (Fig. 1). The site has a continental snow climate characterized by dry atmosphere, relatively low precipitation and very cold temperature conditions (Reference Sharma and GanjuSharma and Ganju, 2000). It is surrounded by high bare mountains on three sides, with rocks and loose soil strata. The station receives solid precipitation throughout the winter, and the melt season typically begins in the second half of March. A semi-automatic meteorological station, close to the snowmelt lysimeter, was used to record the various snow–meteorological parameters including air temperature, relative humidity, wind speed, incoming solar radiation, reflected solar radiation, total snow depth and snow surface temperature (Reference Datt, Yadav, Srivastava, Satyawali, Negi, Venkataraman and NagarajanDatt and others, 2008). The weather station also consists of snow and soil temperature profilers to measure the temperature distribution within the snowpack and soil. All parameters except snow depth are logged at an average interval of 15 min and snow depth is measured hourly. These snow–meteorological data averaged over 1 hour were used to model surface snowmelt.
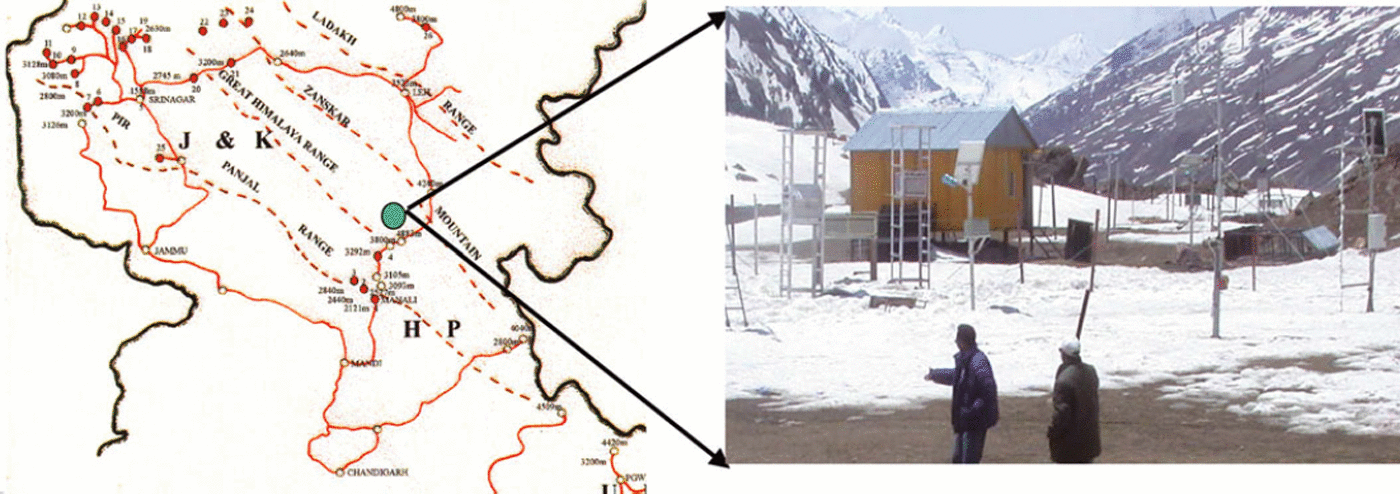
Fig. 1. Observatory at Patsio in Great Himalaya range.
Design and Installation of Snowmelt Lysimeter
A snowmelt lysimeter mainly consists of the following components:
-
1. Snow collector and drain mechanism
-
2. Meltwater-measuring system
-
3. Data acquisition system
The snow collector needs to be designed based on type of use and snow conditions at the site where the snowmelt study is to be carried out (Reference KattelmannKattelmann, 2000). The collector can be either enclosed or unenclosed, and should be placed on the ground surface before formation of the snowpack. In an enclosed lysimeter, the collector walls are raised on all four sides up to the surface of the snowpack, completely separating the column of snow from the rest of the snowpack. The enclosed lysimeter allows accurate measurements of meltwater produced over the collector since lateral outflow/inflow of snowmelt water is minimized. It is preferred for validating energy-balance models. The drawback, however, is that the side walls can influence the solar energy absorption which can cause increased snowmelt. The unenclosed type of lysimeter has side walls that extend up to 0.1–0.5m from the ground, depending on snowpack build-up. Collector area must be adequate to obtain a representative sample of meltwater flux (Reference Kattelmann and ShaferKattelmann, 1984). A large-area lysimeter provides a better spatial average of the snowmelt volume and discharge rate than a small-area lysimeter. Reference Male, Gray, Gray and MaleMale and Gray (1981) proposed that the area of the lysimeter collector should be greater than the square of the snowpack depth. Maximum snow depth recorded for the past 7 years at Patsio (1999/2000 to 2005/06) was used to estimate the dimensions of the snow collector. The mean maximum snow depth was 165 cm for the above-mentioned period.
An unenclosed lysimeter was selected mainly because we were interested in water percolation (wave speed, permeability, propagation of crust formation, etc.) within the snowpack rather than validating energy-balance models. In addition, our field site experiences wind-drift activity because of dry snow conditions most of the time, and side walls extending above the snow surface would change the snow deposition pattern. Although the lysimeter was placed on flat ground, there may still be lateral inflow/outflow of meltwater. The lysimeter collector has dimensions of 2.5 m × 2.5 m (Fig. 2), and its walls are raised to a fixed height of 0.5m from the ground surface. The collector is made of aluminum metal sheet 2.5 mm thick. The selected thickness of aluminum sheet is sufficient to sustain the snow load. To prevent the collector from bulging, additional reinforcement was provided to all four aluminum sheets from outside with angle-iron support. The aluminum sheets were coated with white powder so that the collector absorbs a minimum amount of solar radiation.
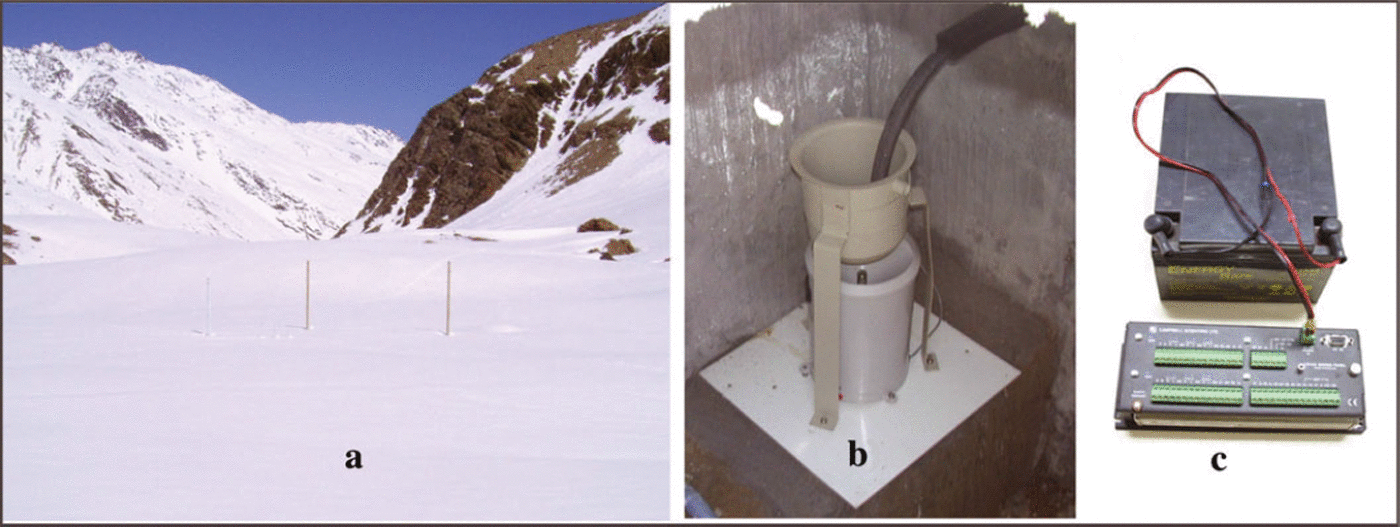
Fig. 2. Snowmelt lysimeter experimental set-up: (a) lysimeter during winter, (b) tipping bucket, (c) data logger.
The base of the snow collector was kept horizontal at ground level with the help of mesh and pebbles, so uniform height of the snowpack builds inside the collector. Two graduated poles were erected at diagonally opposite corners of the collector to measure the snow depth. Meltwater is collected in a U-shaped channel at the centre and drained with the help of an insulated pipe. A tipping bucket placed inside an underground instrument chamber was used to measure the discharge.
Equivalent Permeability of Snowpack
Surface snowmelt was estimated using the energy-balance approach. The net energy flux, ΔQ, at the snow surface is given by (Reference Ma, Liu and LiuMa and others, 1992)
where S in, S out are incoming and outgoing shortwave fluxes, Lin, L out are incoming and outgoing longwave fluxes, Hse is the sensible heat flux and Hla is the latent heat flux. The energy flux which comes towards the snow surface is taken positive and the outgoing flux negative.
The amount of snowmelt is calculated by
where dm is the amount of snowmelt, p s is the average density of snow, Lf is the latent heat of fusion, c is the specific heat of snow and AT is the change in temperature required to bring the snow to 0°C.
The equivalent permeability, k, of the snowpack is estimated based on the theory of meltwater percolation within the snowpack (Reference ColbeckColbeck 1972, Reference Colbeck1975). It is assumed that snow grains are relatively large during the melt season, so that the gravity force dominates and the capillary effects are negligible. If u is the amount of melt flux generated at the surface of the snowpack, its vertical rate of movement (dz/dt)u is given by
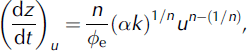
where n is the pore-size distribution index, ϕe is the effective porosity and a = 5.47 × 10⁶ m−1 s−1 is the flow factor. Although the value of n depends on the types of snow, an integral value of n = 3 has been assumed (Reference Colbeck and AndersonColbeck and Anderson, 1982) for most modeling studies on meltwater percolation through snow.
The equivalent permeability of the snowpack is estimated using Equation (3), which requires estimation of the wave speed (dz/dt)u at which a certain surface meltwater flux u moves down through a snowpack of average porosity ϕe. The wave speed is calculated from the depth of the snowpack, dz, and the time lag, dt, between the surface melt and the basal discharge for a given surface meltwater flux u. Snow density and snow depth were measured near the lysimeter container, and average values were used for each day. Surface melt was estimated on an hourly basis using meteorological data. The cumulative meltwater flux was measured every 15 min and hourly discharge was used for analysis. The time lag between surface melt and basal discharge was calculated for different values of melt fluxes for each day.
Results
Snow-cover build-up and ablation for the 2006/07 and 2007/08 winter seasons at the observatory location are shown in Figure 3. Maximum snow depths of 177 cm on 12 March 2007 and 176 cm on 24 February 2008 were recorded. The entire snowpack became isothermal towards the end of March 2007 and around mid-March 2008. Figure 4 shows the variation of air temperature during March and April for each year. The lysimeter discharge data were recorded for a total of 21 days during 15–20 April 2007 and 25 March–30 April 2008. It was observed that the drainage outlet of the lysimeter was blocked for a few days during both seasons because of freezing at the beginning of and sometimes during the melt season. On a few days the tipping bucket overflowed because of heavy meltwater discharge which may be attributed to the sudden breaking of some melt–freeze/ice barrier or possibly to lateral flow from adjacent areas. The data from these periods were not included in the analysis. Maximum daily discharge recorded by the lysimeter was >2 mm w.e. h−1 for most days, except for 22 April 2008 when it was 1 mmw.e.h−1. The maximum discharge was 4.2 mmw.e. h−1 recorded on 23 April 2008.
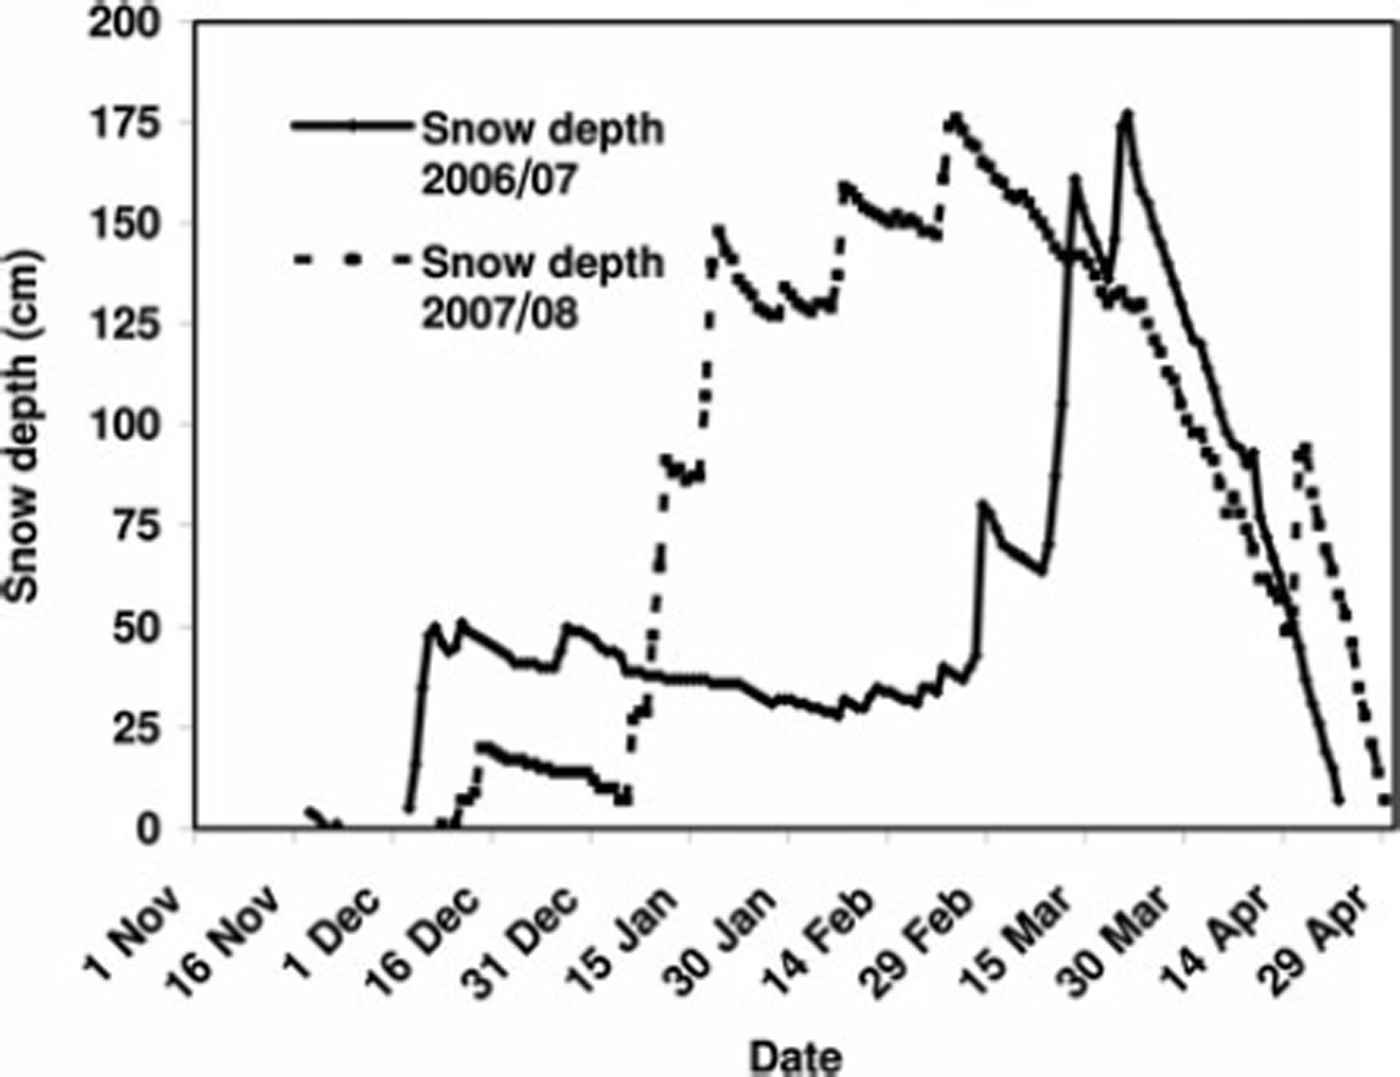
Fig. 3. Snow-cover evolution for 2006/07 and 2007/08 at Patsio station.

Fig. 4. Variation of air temperature for the snowmelt season (March and April) for 2006/07 and 2007/08 at Patsio station.
Snowpack properties such as snow density, grain size, grain type, hardness index and snow temperature were determined in a nearby snow pit. It was observed that the snowpack was composed of mostly melt–freeze grains/crusts (grain size 1–3 mm) in both years. There was a layer of small rounded grains (<1 mm) after a snowfall (15–18 April 2008), which very quickly transformed into a melt–freeze layer. The snow density varied between 380 and 520 kgm−3, and effective porosity ranged from 0.40 to 0.54 (assuming an irreducible water saturation of 0.07; Reference Colbeck and AndersonColbeck and Anderson, 1982).
Wave speed
Time-series plots showing melt estimated at the surface and discharge received from the base of the lysimeter were used to calculate the travel time of a particular melt flux within the snowpack. Figure 5 shows one of these plots for a particular day (23 April 2008). The time lag, dt, for different values of meltwater discharge, u, was calculated from the receding part of the surface melt and the basal discharge curve (Reference McGurk, Kattelmann and KaneMcGurk and Kattelmann, 1986). Using measured snow depth dz and calculated time lag dt, the wave speed (dz/dt) u was derived for different values of u.
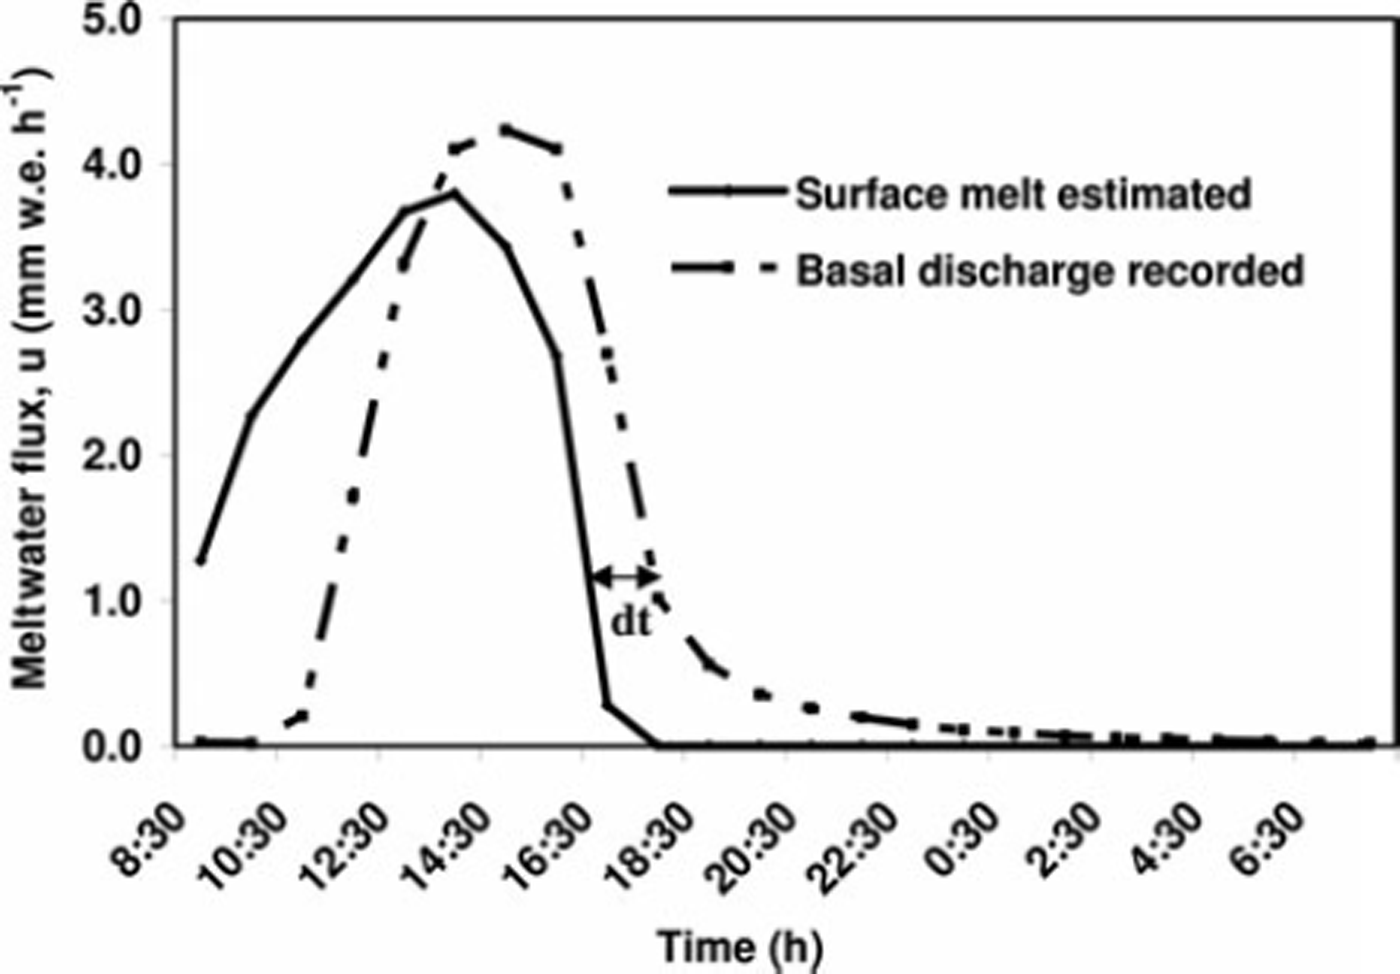
Fig. 5. Surface snowmelt estimated and discharge recorded by the lysimeter at Patsio field station on 23 April 2008.
We found wave speeds varying between 82 and 486 mm h−1 for meltwater flux values of 1–4.2mm w.e. h−1. The daily mean wave speed varied between 109 and 285 mmh− 1 for a daily mean discharge of 0.6–1.8 mm w.e. h−1. However, wave speeds for a particular melt flux of 2 mmw.e.h−1 ranged between 113 and 486mmh−1 for all days. If we remove the outlier with 486 mmh−1 which occurred on 21 April 2008, the range of wave speed becomes 113–335mmh−1. Our wave speeds were higher than those reported for a continental snowpack in Colorado, USA (62–177mmh−1), by Reference Fox, Williams and TroendleFox and Williams (1999). For a melting alpine snowpack in British Columbia, Canada, during late winter, Reference JordanJordan (1983) reported wave speeds of 250–300mmh−1 for a flux of 2 mmw.e. h−1.
Pore-size distribution index and equivalent permeability
Figure 6 shows a plot of wave speed (dz/dt) u vs discharge u for 23 April 2008. Similar plots were drawn for each day analyzed. The pore-size distribution index n and the equivalent permeability k were estimated by fitting a power-law relation to the data shown in Figure 6 and comparing it with Equation (3). Analysis showed that the pore-size distribution index varied between 1.4 and 3.7, with a mean of 2.05 and standard deviation 0.70. Reference Fox, Williams and TroendleFox and Williams (1999) reported values of n ranging from 1.16 to 5.58, while Reference McGurk, Kattelmann and KaneMcGurk and Kattelmann (1986) found values ranging between 1.4 and 4.6. We found no significant trend in the values of n as the melt season progressed. The equivalent permeability varied between 9.9x10⁻¹ 2 and 3.4 × 10⁻⁸m2, with a mean of 3.5 × 10⁻⁹m2. The highest value of k corresponded to 21 April 2008; removing this outlier, the mean k reduced to 1.2 × 10⁻¹⁰m2. If a constant value of n = 3 was assumed, the equivalent permeability ranged between 7.1 × 10⁻¹¹ and 5.1 × 10⁻⁹m2 (Fig. 7). Our values of k were lower than those reported by Reference Colbeck and AndersonColbeck and Anderson (1982) and Reference McGurk, Kattelmann and KaneMcGurk and Kattelmann (1986) for a melting snow cover. Reference Fox, Williams and TroendleFox and Williams (1999) also reported low values of equivalent permeability ranging from 3.23 × 10⁻¹² to 6.57 × 10⁻¹⁰m2. The large range of equivalent permeability can be attributed to the complex interplay between appearance and disappearance of preferential flow paths due to spatial heterogeneities in the form of melt–freeze crusts/ice lenses.
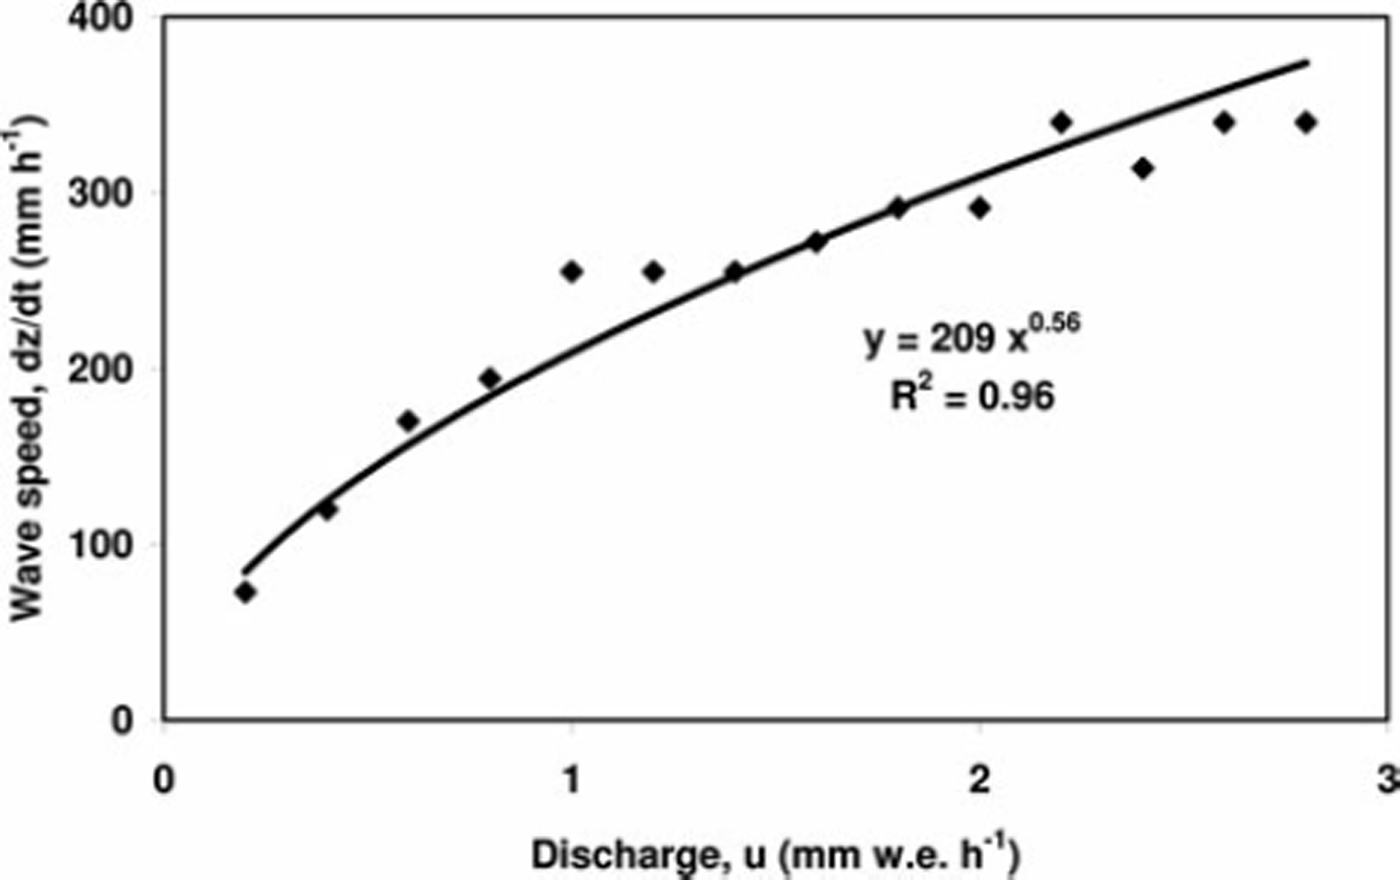
Fig. 6. Power-law fit between discharge (u) and wave speed (dz/dt) on 23 April 2008 at Patsio station.
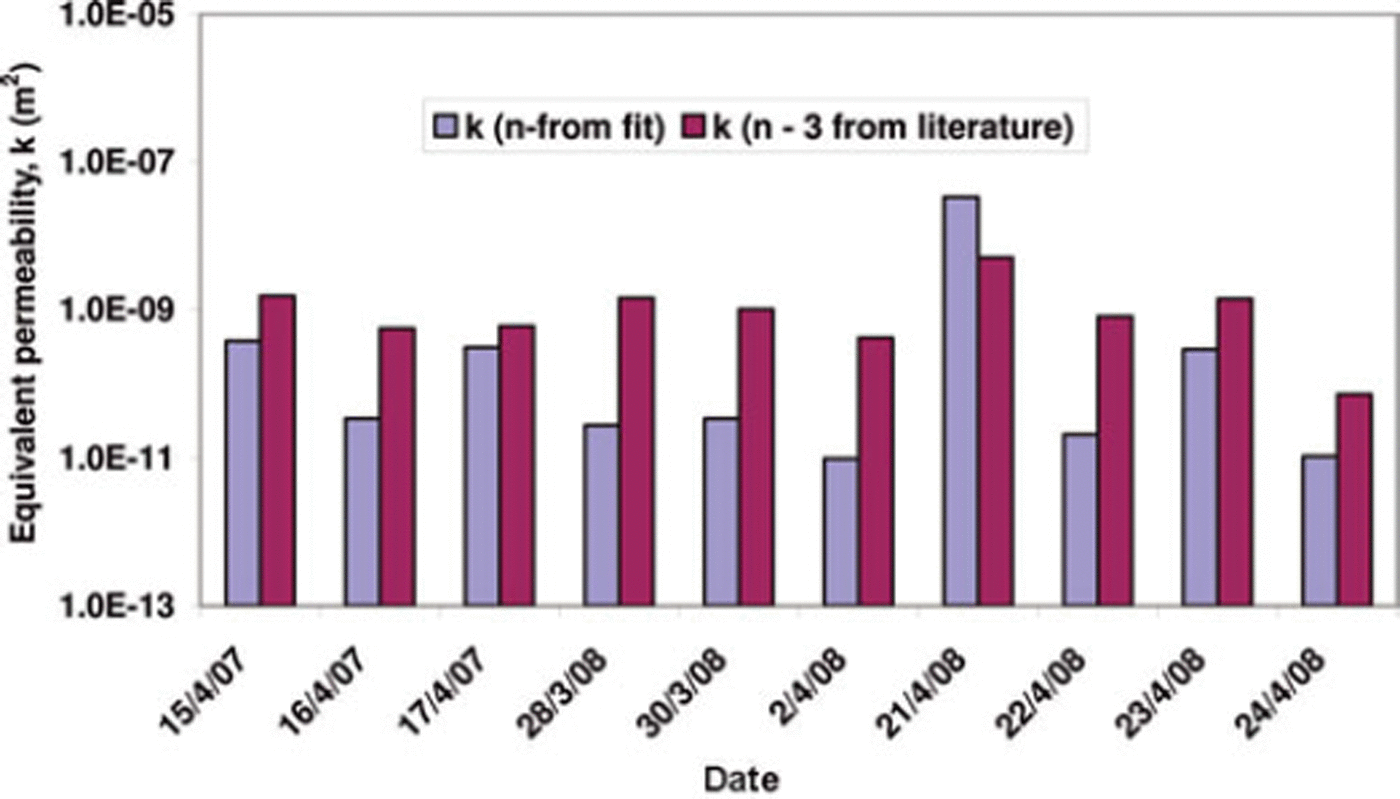
Fig. 7. Equivalent permeability values calculated using the pore-size index from fit (i.e. variable) and using a fixed value (n = 3). Date format is day/month/year.
Conclusion
A snowmelt lysimeter was designed and installed, and snowmelt discharge data were recorded from a seasonal snowpack at Patsio field research station. An energy-balance approach was used to estimate surface snowmelt. Maximum daily lysimeter discharge was >2 mm w.e. h−1 for most days. Daily mean wave speed of the meltwater front varied between 109 and 285 mm h−1 for a daily mean discharge of 0.6–1.8 mm w.e. h−1. Fitting a power-law relation to the discharge and wave-speed data, we estimated the pore-size distribution index to be in the range 1.4–3.7. The equivalent permeability of the snowpack was found to vary between 9.9 × 10⁻¹² and 3.4 × 10⁻⁸ m2, which is lower than most previously reported values.
Acknowledgements
We thank S. Kumar and V. Kumar for help during field data collection, and J.C. Kapil for helping to improve the manuscript. Thanks are also due to A.C. Whitaker whose insightful comments helped to bring the paper to its present form. This work was supported by the Defence Research Development Organization, India (project No. RD-PI-2004/SAS-35).


