Introduction
Antarctic mass balance is one of the most important components controlling global sea level. The assessment of the effect of the ice sheet on sea level requires an accurate determination of its current state of balance, which requires estimates of ice-accumulation rates and observations of ice flow. Balance fluxes, representing the ice flow that would correspond to a steady-state ice sheet, can be calculated easily from ice-accumulation distributions and ice-sheet surface topography (Budd and Warner, 1996). To decide if the ice sheet is locally in a state of positive or negative mass budget, these balance fluxes must be compared with actual ice fluxes. The accurate determination of the actual flux
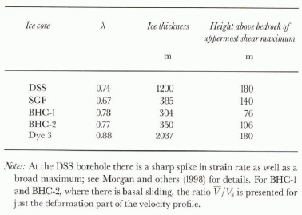
involves measurements of ice thickness (D) and ice-surface velocity (Vs), and an estimate of the ratio (λ) of depth-averaged velocity (V) to surface velocity. Direct measurements of λ or ϒ are not usually available. Examples of A from the logging of several boreholes from Law Dome, East Antarctica, and from Dye 3, Greenland, are presented in Table 1. The value for Dome Summit South (DSS) is from Morgan and others (1998), and the other values are calculated from published velocity profiles: SGF from Russell-Head and Budd (1979), BHC-1 and BHC-2 from Etheridge (1989) and Dye 3 from Hansen and Gundestrup (1988).
As the representation of Antarctic ice accumulation continues to improve, from increased ground coverage and from higher-resolution atmospheric circulation models, with improved ice-surface topography based on satellite remote sensing, and with more accurate measurements of surface velocities, the ratio λ becomes one of the major remaining uncertainties in comparing balance fluxes with actual fluxes. For example, in the study by Budd and Warner (1996), comparison of balance fluxes based on topography derived from satellite radar altimetry (Bambcr, 1994) with observations for coastal regions of Wilkes Land, East Antarctica (Hamley and others, 1985), implies a 9% positive imbalance for λ = 0.87, or balance for λ = 0.95.
In regions where ice (lows by internal deformation, the ratio A reflects the complicated rheology of ice, and is influcnced by the depth profiles of stress, temperature and ire-crystal fabric.
The present work is part of a long-term project to incorporate into ice-sheet models the enhanced ice flow which arises from the development of anisotropic ice-crystal fabrics compatible with the flow conditions.
Table. 1. Ratios of depth-averaged velocities to surface velocities from boreholes on Law Dome, East Antarctica, and from Dye 3 borehole in Greenland
We present calculations of λ from an idealised flowline model of a large ice sheet to demonstrate the effect of anisotropic rheology on strain-rate and velocity profiles. We have incorporated anisotropic rheology into a steady-state ice-sheet flow model via an enhancement factor for shear How. This enhancement factor depends on the strain history of the ice. It is based on laboratory studies of ice deformation, together with ice-core studies, and is determined in the model by iteratively calculating shear and compression strains along ice-flow trajectories and feeding these back into the anisotropic ice-flow law.
Anisotropic Ice Flow
The basic ingredients of an ice-sheet model include prescriptions for the viscous creep flow of ice by internal deformation, and for the sliding of the ice sheet over the bedrock if basal temperatures permit it. in the present study, we neglect the role of sliding and consider only flow by internal deformation, for which the fundamental relationship is the rheological flow law for ice, i.e. the relation of strain rate to the stress thai produces it. Most ice-sheet models use a form of Glen's (1958) flow law for isotropic ice, which incorporates a power-law dependence of the components of the strain-rate tensor (![]() ) on deviatone stresses (
) on deviatone stresses (![]() ), and a coefficient A(T) which depends on the ice temperature. This may be expressed as
), and a coefficient A(T) which depends on the ice temperature. This may be expressed as
where ![]() is the second invariant of the deviatone stress tensor,
is the second invariant of the deviatone stress tensor,

This gives the components of the strain-rate tensor a homogeneous cubic polynomial dependence on the components of the deviatone stress tensor.
This flow law is based on the assumption that ice consists of fine-grained randomly oriented crystals forming a statistically homogeneous and isotropic material.
In large ice sheets the assumption of isotropy holds only to shallow depths, typically less than several hundred metres. The large amounts of deeper ice have highly anisotropic crystal structures which are the result of continuous deformation to large strains involving several processes such as crystal rotation, recrystallisation and crystal growth (Steinemann, 1954; Budd, 1972; Alley, 1992).
A number of field and laboratory studies of ice deformation have indicated that the crystallographir anisotropy plays an important role in the flow of ice. The anisotropy due to flow-induced crystal orientations has the most significant effect on ice-flow rate (e.g. Russell-Head and Budd, 1979; Shoji and Langway, 1988). The work of Russell-Head and Budd (1979), relating Antarctic borehole shear measurements to long-term shear experiments on anisotropic ice samples from the ice cores obtained from those boreholes, demonstrated the existence of enhanced flow at deeper levels in the ice sheet. Deformation tests on polycrystalline ice with a developed crystal-orientation fabric have shown that creep rate is enhanced when the preferred orientation fabric is compatible with the stress configuration. For example, a single maximum pattern is compatible with a shear-stress configuration where the shear stress is applied across the plane normal to the maximum, and a small-circle girdle pattern is compatible with a symmetrical axial com-pressive-stress configuration. Furthermore, both field and laboratory studies have shown that compatible orientation fabrics are induced by the flow situation (e.g. Russell-Head and Budd, 1979; Bouchez and Duval, 1982; Herron and Langway, 1982; Budd andjacka, 1989).
Laboratory ice-creep tests on initially randomly orientated polycrystalline ice subjected to constant stress indicate that the minimum strain rate is attained at about 1 % octahedral shear strain. Beyond this, and associated with the development of the anisotropic fabric in the ice sample, the strain rate increases. This can be considered an enhancement of strain rate above the minimum strain rate as a function of strain, and is observed over a range of stresses and temperatures. The enhanced strain rale approaches an asymptote beyond about 10-20% octahedral shear strain, with an enhancement factor of about 3 for uniaxial com-pression and about 10 for simple shear (Budd andjacka, 1989; Lijun and others, 1996). The experiments show that accumulated strain provides a natural parameter to describe the development of the enhancement factor from 1 at 1 % strain to 10 beyond 10 20% strain for shear flow.
In ice-sheet models, the common use of the shallow-ice approximation at leading order (Hutter, 1983; Morland, 1984) in studying the dynamics of grounded ice leaves only the horizontal shear component of the flow law,
where ![]() is the horizontal shear strain rate and
is the horizontal shear strain rate and ![]() is the horizontal shear stress. in an attempt to improve agreement between simulations and observed ice sheets an “enhancement factor” is sometimes applied to the relationship between stress and strain rate measured in the laboratory as a constant rescaling throughout the ice sheet. Some efforts have been made to describe the anisotropic ice flow by modifying the flow law via factors (e.g. enhancement factor) which depend on various parameters intended to characterise the extent of anisotropy in the crystal fabric (e.g. Lile, 1978; Dahl-Jensen, 1985; Shqji and Langway, 1988; Jacka and Budd, 1989; Azuma and Goto-Azuma, 1996; Li Jun and others, 1996). These approaches require knowledge of the variation of those parameters throughout the ice sheet. There has also been some work on the complementary task of modelling the development of crystal fabrics in flowing ice (Azuma, 1994; Castelnau and Duval, 1994; Van der Veen and Whillans, 1994; Castelnau and others, 1996). Some models have been outlined (Meyssonnier and Philip, 1996; Svendsen and Hutter, 1996) which aim at a simultaneous evolution of a parameterisation of the crystal fabric via an orientation distribution function and calculation of the corresponding variables describing the mechanical deformation of the ice. Applications have been made for transverse isotropic fabrics in simple configurations of uniaxial tension and compression (Meyssonnier and Philip, 1996) and simple shear (Svendsen and Hutter, 1996), with qualitatively encouraging results. Instead of treating the details of the twin questions of the evolution of crystal orientations and the response of the resulting polycrystalline material
is the horizontal shear stress. in an attempt to improve agreement between simulations and observed ice sheets an “enhancement factor” is sometimes applied to the relationship between stress and strain rate measured in the laboratory as a constant rescaling throughout the ice sheet. Some efforts have been made to describe the anisotropic ice flow by modifying the flow law via factors (e.g. enhancement factor) which depend on various parameters intended to characterise the extent of anisotropy in the crystal fabric (e.g. Lile, 1978; Dahl-Jensen, 1985; Shqji and Langway, 1988; Jacka and Budd, 1989; Azuma and Goto-Azuma, 1996; Li Jun and others, 1996). These approaches require knowledge of the variation of those parameters throughout the ice sheet. There has also been some work on the complementary task of modelling the development of crystal fabrics in flowing ice (Azuma, 1994; Castelnau and Duval, 1994; Van der Veen and Whillans, 1994; Castelnau and others, 1996). Some models have been outlined (Meyssonnier and Philip, 1996; Svendsen and Hutter, 1996) which aim at a simultaneous evolution of a parameterisation of the crystal fabric via an orientation distribution function and calculation of the corresponding variables describing the mechanical deformation of the ice. Applications have been made for transverse isotropic fabrics in simple configurations of uniaxial tension and compression (Meyssonnier and Philip, 1996) and simple shear (Svendsen and Hutter, 1996), with qualitatively encouraging results. Instead of treating the details of the twin questions of the evolution of crystal orientations and the response of the resulting polycrystalline material
Table. 2. Temperature parameter, A(Τ), for the anisotropie-Ice flow-law equation (5). The data are based on laboratory experiment results for minimum creep rates at an octahedral shear stress of 0.1MPa (Budd andjacka, 1989, table 3)

to stresses at such a microscopic level, we explore here the use of a more direct and simple way to parameterise empirically the strength of enhancement as it develops in shear flow, based on the laboratory observations of the process, and the comparison with observed shear strain rate and ice-fabric profiles from boreholes in ice sheets and the corresponding ice cores. We draw upon the physical paradigm of evolving crystal fabrics, in relation to laboratory deformation experiments, and to observations correlating ice-core fabrics and borehole inclinations, in developing our simple paramctcrisation of the enhancement of horizontal shear flow, but the aim of this paper is not to model the details of fabric evolution. The purpose of this paper is to examine the influence of enhanced horizontal shear flow at depth in ice sheets on velocity profiles and consequently on ice-flux measurements.
The flow law for anisotropic ice used in our model includes an enhancement factor E which is a function of the shear and compression strains accumulated in the ice,
with the temperature-dependent coefficient A(T) describing the flow relationship at the minimum creep rate for isotropic ice. A(T) is interpolated from Table 2, which is based on laboratory experiments (corresponding to the octahedral shear stress of 0.1 MPa) summarised by Budd and jacka (1989).
Application To A Flowline Model
For initially isotropic ice the developing enhancement under continued constant shear stress is easily described as a function of the cumulative strain as discussed above. A slightly more complicated situation arises in ice sheets.
The ice deformation in the upper part of an ice sheet is dominated by vertical compression, while in the deeper parts the deformation is dominated by steadily increasing shear as depicted in Figure 1. Even though the ice-sheet-model dynamics neglects compressive stresses and is driven by horizontal shear stress ![]() , the dependence of crystal fabrics on the stress configuration and strain history must be taken into account, varying from development towards a fabric compatible with compression in the upper regions to development towards a fabric compatible with shear as the ice flows downwards and outwards.
, the dependence of crystal fabrics on the stress configuration and strain history must be taken into account, varying from development towards a fabric compatible with compression in the upper regions to development towards a fabric compatible with shear as the ice flows downwards and outwards.
lo address this complication, we take the enhancement factor ![]() to be a function of the ratio of shear strain to compressive strain,
to be a function of the ratio of shear strain to compressive strain, ![]() rather than a function of the shear strain alone, as might be appropriate for a laboratory shear experiment starting with isotropic ice. This enables us to ensure that the enhancement factor is kept at unity until shear strain overtakes vertical compressive
rather than a function of the shear strain alone, as might be appropriate for a laboratory shear experiment starting with isotropic ice. This enables us to ensure that the enhancement factor is kept at unity until shear strain overtakes vertical compressive
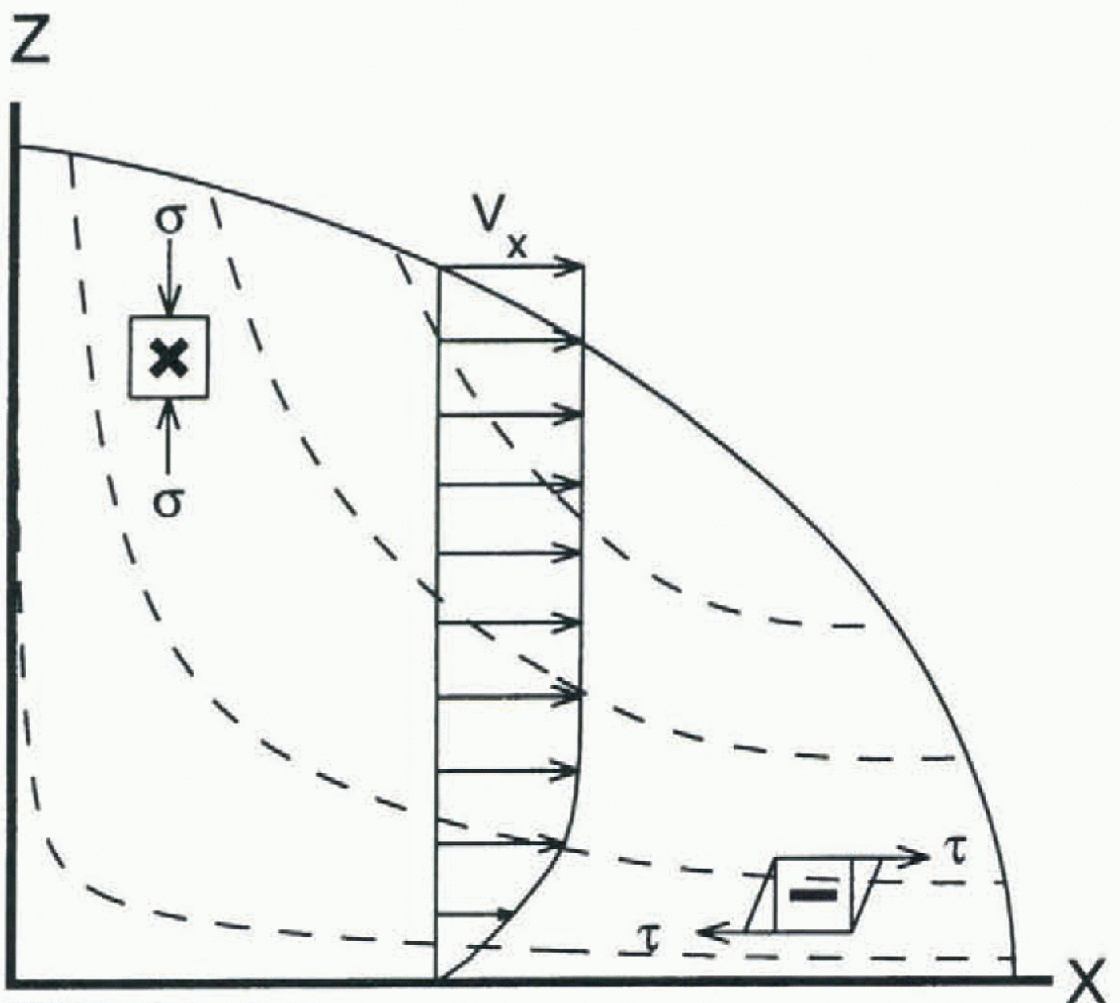
Fig. 1. Flow trajectories and a typical profile of horizontal velocity (Vx) for an ice-sheet flowline, together with indications of the two different stress regimes which influence the development of anisotropic ice-crystal fabrics, moving from the predominant vertical compressive stress (σ) near the surface to predominantly horizontal shear (τ) nearer the bed.
strain. in ice sheets this occurs at depths where the shear strain greatly exceeds 1 %, and while shear stra in thereafter increases rapidly with depth, vertical compressive strain changes only slowly. Using the ratio of strains thus provides a convenient way to rescale the dependence on shear strain to ensure that the developing enhancement ofice flow under sustained shear comes into play only once the shear compatible fabric has overwritten any compressive fabrics. ( in the absence of laboratory data on the shear deformation of ice with a fully developed small-circle girdle fabric, we assume that the shear flow of this ice proceeds at the secondary minimum creep rate for isotropic ice under shear.)
In this initial study we have used the simple parameter-isation for the enhancement factor E displayed in Table 3. The enhancement factor E is increased from 1 to a maximum of 10 (adopted from laboratory results for shear) as the ratio of shear strain to compressive strain increases from 1 to 3, and is kept unchanged until the strain ratio r reaches 100. Russell-Head and Budd (1979) observed that very near the base of the ice sheet the shear strain rate fell to low values. This decline may owe something to disruption of shear-compatible fabrics due to the influence of varying longitudinal stresses, but may also involve a decrease in shear stress and not be solely due to crystallographic effects. It may reflect relatively stagnant ice below the highest shear zone, which may be related to the large-scale bedrock roughness. Accordingly, in our model we do not want to carry the
Table. 3. Enhancement factor ![]() as a function of the ratio
as a function of the ratio ![]() of horizontal shear strain to vertical compressive strain
of horizontal shear strain to vertical compressive strain
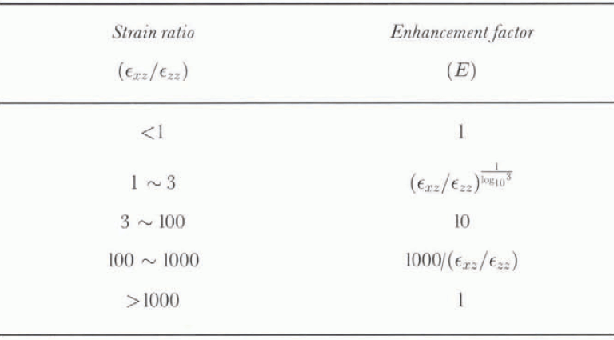
enhancement of shear flow all the way to the bedrock, and for the results presented here a reduction in the enhancement factor commences once the strain ratio exceeds 100, and enhancement is progressively returned to unity as the strain ratio increases from 100 to 1000. This prescription is somewhat arbitrary but is motivated by the idea that a high shear layer may form some distance above the bedrock in real ice sheets, perhaps clue to the influence of irregular bedrock topography and the corresponding induced longitudinal stresses on the flow. As we show below, the major effects of this treatment of enhancement are a rapid increase in strain rate where enhancement sets in, and then nearer the bedrock a competition between decreasing enhancement and the rising influence of higher temperatures. in other studies, we have also investigated parameterising the reduction of enhancement near the base of the ice sheet as a function of distance from the bedrock. The vertical length scale for such a reduction in enhancement (perhaps as a proxy for reducing shear stress) should presumably be characteristic of the amplitude of those bedrock undulations which occur within a horizontal distance corresponding to the assumptions of the shallow-ice approximation, rather like a smoothing envelope over the bedrock bumps with a length scale of several ice thicknesses.
Our model studies reveal that for temperature-dependent ice rheology the shear strain overtakes the compressive strain at strains which are often in excess of 50%. With the benefit of hindsight, it may be that in such circumstances full enhancement would be reached even more rapidly than our present parameterisation describes (table 3). Our model already shows that enhancement develops over a relatively narrow transition zone, indicating that even a conservative estimate of the shear needed to establish a fully developed compatible anisotropic crystal fabric produces striking modifications to strain-rate profiles.
For this study we considered, for simplicity, an ice-sheet profile over a flat bedrock, in equilibrium with an accumulation distribution, M(x), used in ice-sheet model intercom-parison tests (Huybrechts and others, 1996),
where the central ice-accumulation rate ![]() , the slope of the accumulation function s = 10 −2 m a−1 km−1, x is the distance from the ice divide in km, and the accumulation changes from positive to negative at x0
= 450 km. Our model resolution is 1 km in the horizontal, and divides the ice thickness into 30 evenly spaced bands. The corresponding equilibrium ice-surface profile, H(x), was calculated for isothermal isotropic ice rheology. We retained this profile shape when incorporating temperature dependence and anisotropic effects in the flow law. This is sufficient for our present purpose, which is to demonstrate the influence of anisotropic ice flow on the λ values involved in mass-balance studies. We used a prescribed surface temperature, Tsurf(x), from the same model Intercomparison studies:
, the slope of the accumulation function s = 10 −2 m a−1 km−1, x is the distance from the ice divide in km, and the accumulation changes from positive to negative at x0
= 450 km. Our model resolution is 1 km in the horizontal, and divides the ice thickness into 30 evenly spaced bands. The corresponding equilibrium ice-surface profile, H(x), was calculated for isothermal isotropic ice rheology. We retained this profile shape when incorporating temperature dependence and anisotropic effects in the flow law. This is sufficient for our present purpose, which is to demonstrate the influence of anisotropic ice flow on the λ values involved in mass-balance studies. We used a prescribed surface temperature, Tsurf(x), from the same model Intercomparison studies:
where T 0 = 270 K, and the lapse rate 7 = 10−2Κ m−1.
The influence of temperature on the ice flow was incorporated through an iterative process. For a given velocity distribution we calculated the steady-state temperature distribution, considering deformation heating, geothcrmal heat flux, horizontal and vertical advection and vertical diffusion, and including the temperature dependence of the various thermal properties of ice. This temperature distribution was then used to calculate new shear strain rates and so update the velocities. As our interest is in λ values rather than the actual speed of the ice flow, we rescaled the strain rates independently in each column (by applying a common factor at each level) to mainta in the depth-averaged velocity at each location and preserve the steady-state character of the ice-sheet profile.
The enhancement factor E was incorporated by an analogous iterative process. This involved the additional task of integrating strain rates along flow trajectories to find the cumulative horizontal shear and vertical compressive strains, the calculation of an updated enhancement-factor distribution based on the ratio of shear and vertical compressive strains, and the calculation of new shear strain rates and velocities. As the inclusion of anisotropic elfects altered the vertical profiles of shear strain rate, which affects the deformation heating, the iterative refinement of the temperature distribution was repeated after the inclusion of enhancement to produce a self-consistent final pattern of temperature and enhancement-factor distributions.
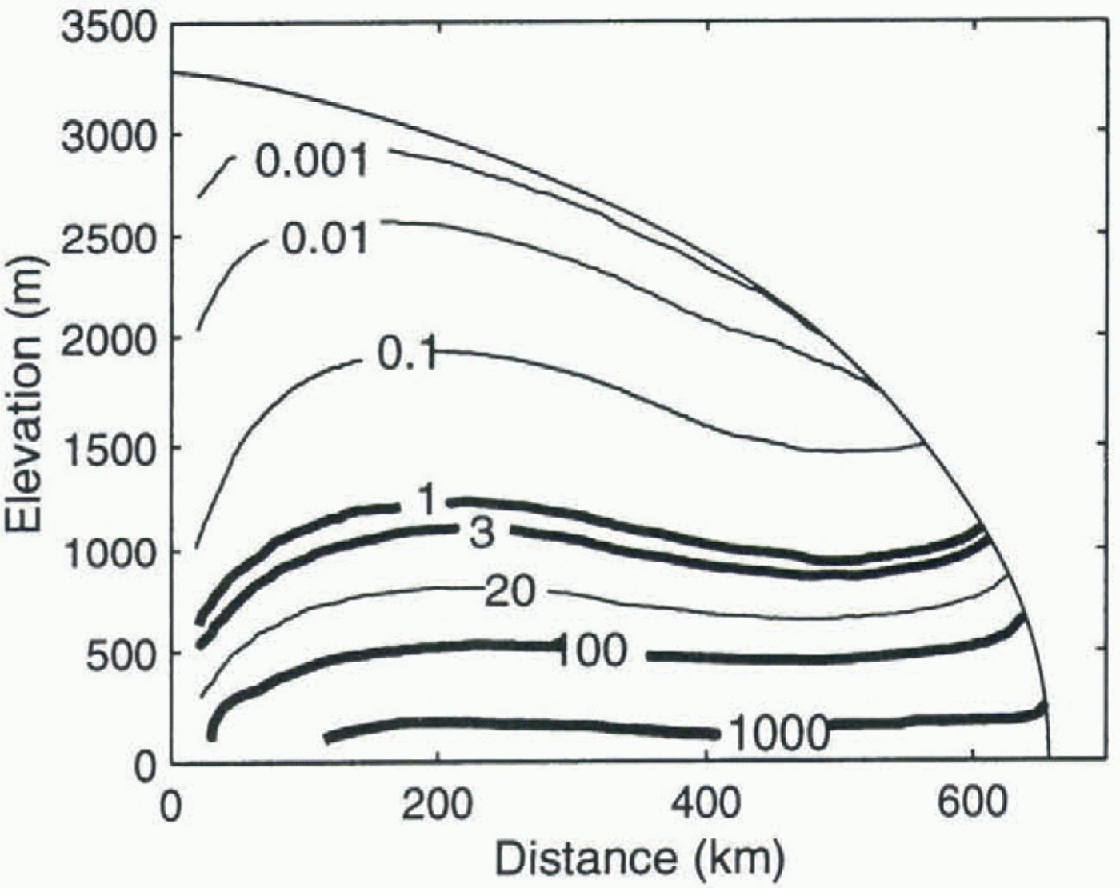
Fig. 2. The flowline ice-sheet profile of the present study. The contours show the distribution of the ratio of horizontal shear strain to vertical compressive strain, ![]() for the tem-perature-dependent anisotropic-ice flow-law equation (5), after iterations of both temperature and strain distributions. The onset of enhanced shear flow is comparatively abrupt, commencing at r=1, and reaches the enhancement factor E = 10 at r = 3. It remains at this value over the band 3 < r < 100, and then declines again to unity over the band 100 < r < 1000.
for the tem-perature-dependent anisotropic-ice flow-law equation (5), after iterations of both temperature and strain distributions. The onset of enhanced shear flow is comparatively abrupt, commencing at r=1, and reaches the enhancement factor E = 10 at r = 3. It remains at this value over the band 3 < r < 100, and then declines again to unity over the band 100 < r < 1000.
The ice-sheet profile displayed in Figure 2 shows the final distribution of the ratio of horizontal shear strain to vertical compressive strain, while Figure 3 shows the corresponding temperature distribution. The bold contours in Figure 2 delineate the different domains of the enhancement factor corresponding to Table 3.
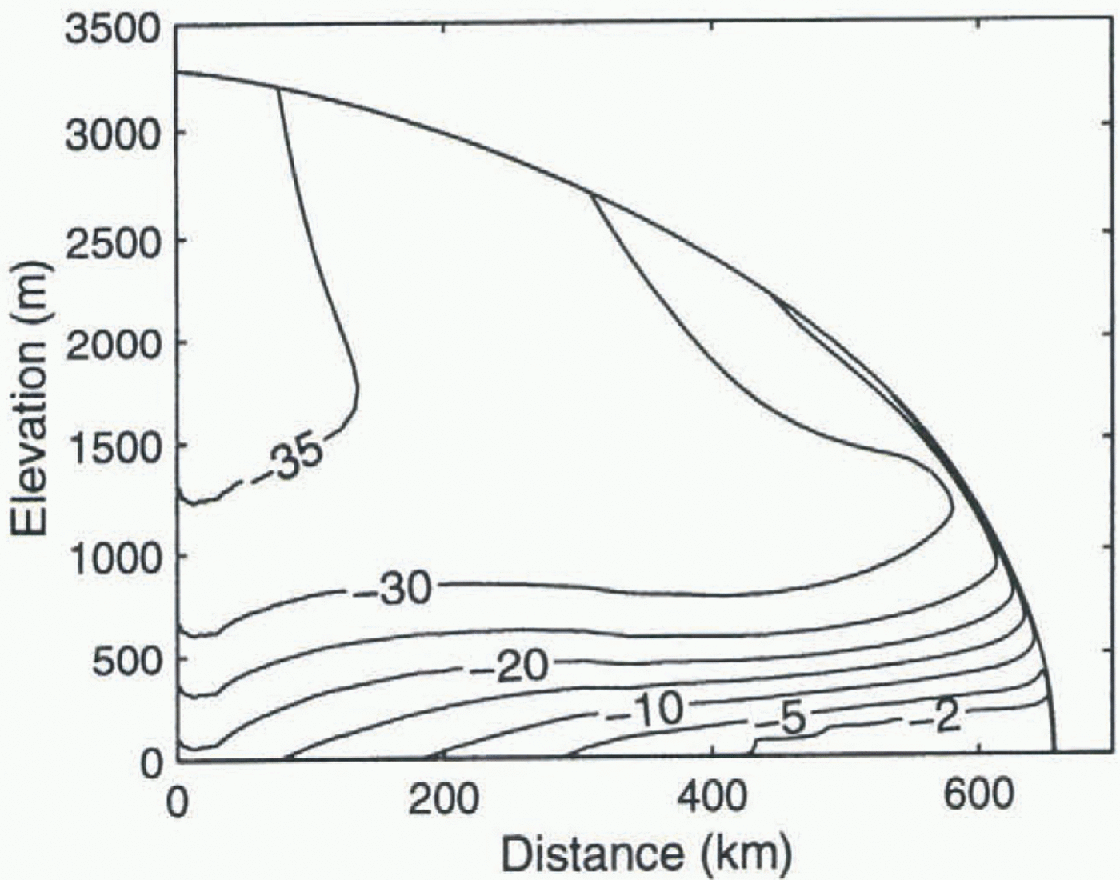
Fig. 3. The steady-state temperature (°C) distribution corresponding to the iterated system depicted in Figure 2.
Discussion
We have calculated λ, the ratio of the column average velocity to the surface velocity, for the flowline represented by the profile displayed in Figure 2 for various choices of rheology. For isothermal isotropic ice using the cubic flow-law equation (5) with A(T) = 1 and E = 1, it is an analytic result (see Paterson 1994, p. 251-52) that λ = 0.8. in addition to the combination of temperature effects via A(T) and enhancement via ![]() , which yields the distributions of enhancement and temperature illustrated in figures 2 and 3, we have calculated λ for temperature-dependent isotropic ice flow (E=1), and we have applied the treatment of enhancement to the isothermal rheology. Results from these calculations are presented in Figure 4. As one would expect, the incorporation of temperature-dependent rheology alone (curve B) increases λ values to 0.89-0.96, giving results similar to the calculations of Budd and others (1971) for the interior of the Antarctic ice sheet (λ = 0.85-0.92), and to the estimate used by Hamlcy and others (1985) (λ = 0.89) in comparisons of balance velocities and field observations in Wilkes Land.
, which yields the distributions of enhancement and temperature illustrated in figures 2 and 3, we have calculated λ for temperature-dependent isotropic ice flow (E=1), and we have applied the treatment of enhancement to the isothermal rheology. Results from these calculations are presented in Figure 4. As one would expect, the incorporation of temperature-dependent rheology alone (curve B) increases λ values to 0.89-0.96, giving results similar to the calculations of Budd and others (1971) for the interior of the Antarctic ice sheet (λ = 0.85-0.92), and to the estimate used by Hamlcy and others (1985) (λ = 0.89) in comparisons of balance velocities and field observations in Wilkes Land.
The inclusion of our shear enhancement model (curve C), with maximum enhancement at some distance above the bedrock, reduces the tendency towards more block-like flow, giving lower A values, in the range 0.86-0.91. For the enhanced isothermal rheology (curve D) the changes in λ are more marked. This is partly because the band of enhancement, including its lower margin, occurs higher in the ice sheet than in the case of temperature-dependent rheology, and partly because the decreasing enhancement near the bedrock is competing only with the increasing stress and not with the rapidly increasing effects of higher ice temneratures.
It appears that the most common case is for λ to be somewhat reduced by the inclusion of anisotropic rheology when the maximum enhancement occurs at some appreciable distance above the bedrock.
It is worth remarking that Morgan and others (1998) report that at the DSS borehole on Law Dome, East Antarctica, λ = 0.74. This probably also involves the reduced basal shear stresses discussed by Russell-Head and Budd (1979) and is complicated by the added questions of flow within a few ice thicknesses of a dome summit and the influence of quite rough bedrock topography upstream of the drilling site (Morgan and others, 1997). The strain-rate profile (see Morgan and others, 1998, Fig. 1) shows the presence of a broad maximum shear band about 180 m above the bed which is apparently not simply related to depth and temperature changes. Strain-rate profiles showing transitions into localised bands of higher horizontal shear have also been observed in other borehole measurements from Law Dome (Russell-Head and Budd, 1979; Etheridge and McCray, 1985; Etheridge, 1989; see Table 1).
figure 5a shows the depth profiles of horizontal velocity at a point 200 km from the divide of our model ice sheet, to illustrate the alterations corresponding to the various λ values. Recall that the velocities are normalised to give the same depth-averaged velocity denoted Vx. Without enhancement effects the temperature-dependent profile (curve B) is more block-like than for the isothermal case (curve A), which makes λ increase from 0.8 for the isothermal case to 0.92 for the temperature-dependent case. In-clusion of enhancement (with maximum enhancement above the bedrock) (curve C) reduces this tendency to-wards a block flow profile, al least near the base of the ice sheet, and thereby brings λ down to 0.87 for the combined case. These alterations in the velocity profiles are highlighted in the corresponding strain-rate profiles shown in figure 5b. The rapid increase in strain rate with depth as enhancement commences (curve C) can be seen clearly, as can the effect of reduced enhancement nearer the base of the ice sheet (curves C and D).
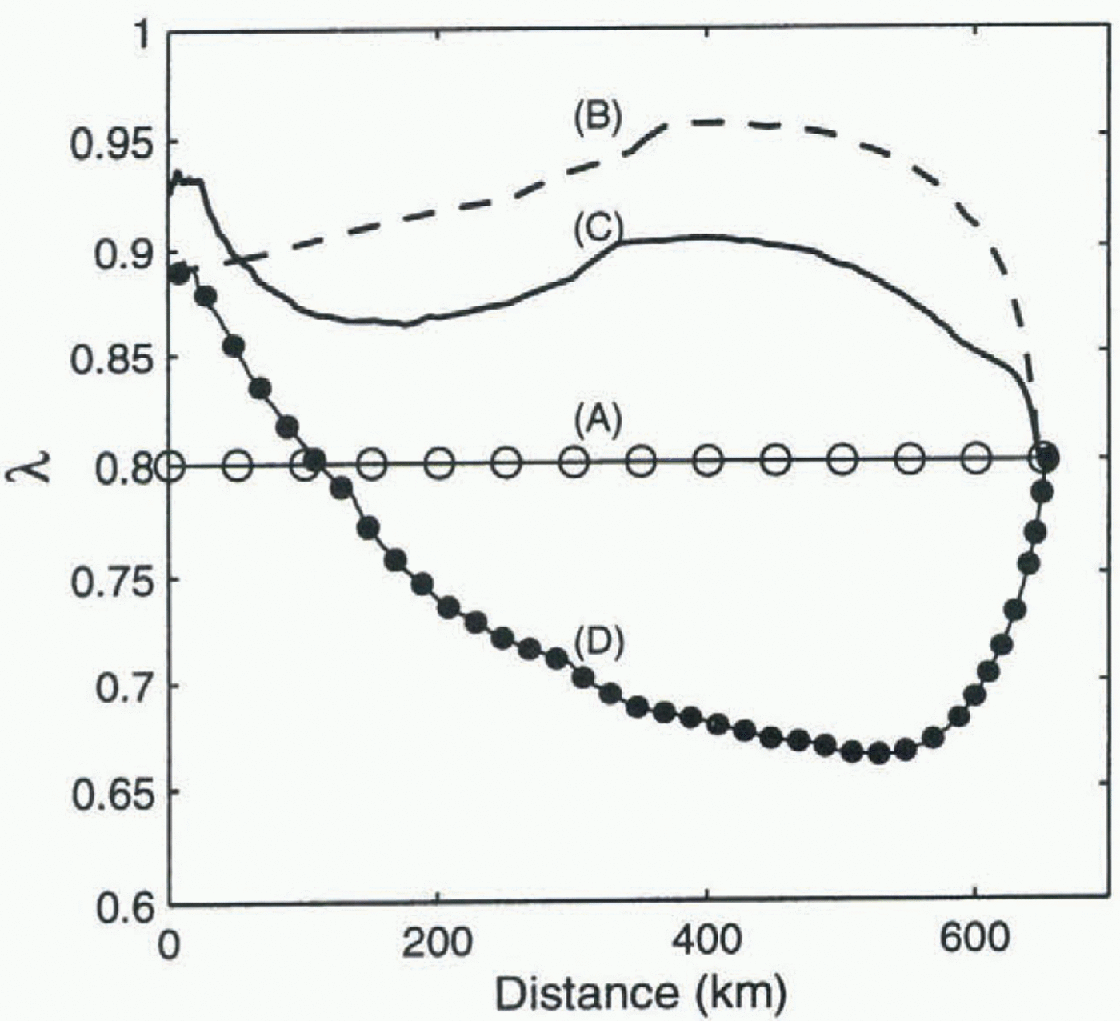
Fig. 4. The ratio (λ) of column-averaged velocity
V
to surface velocity ![]() for the flowline ice-sheet profile of figures 2 and 3. The
for the flowline ice-sheet profile of figures 2 and 3. The ![]() values are displayedfor various rheologies: (A) temperature-independent, isotropic fabric, (B) temperature-dependent, isotropic fabric, (C) temperature-dependent, anisotropicfabric, and (D) temperature-independent, anisotropic fabriC. Kote that in the case of the temperature-independent rheology the band of enhanced flow occurs higher up in the ice sheet than in the case depicted in Figure 2, and the enhanced flow band outcrops in the ablation zone, leading to a reduced influence on A for distances from the summit greater than 450 km.
values are displayedfor various rheologies: (A) temperature-independent, isotropic fabric, (B) temperature-dependent, isotropic fabric, (C) temperature-dependent, anisotropicfabric, and (D) temperature-independent, anisotropic fabriC. Kote that in the case of the temperature-independent rheology the band of enhanced flow occurs higher up in the ice sheet than in the case depicted in Figure 2, and the enhanced flow band outcrops in the ablation zone, leading to a reduced influence on A for distances from the summit greater than 450 km.
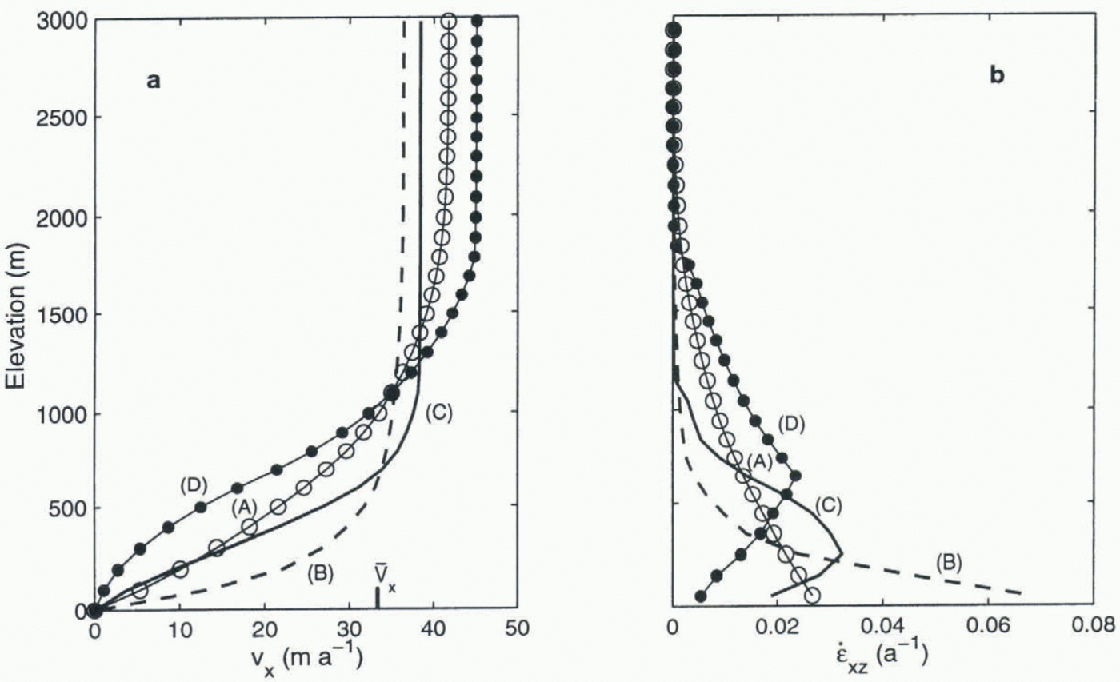
Fig. 1. Depth profiles of (a) horizontal velocities (with an indication of the fixed depth-averaged velocity ![]() for this column) and (b) the corresponding shear strain rates, at the location 200 km from the summit, for the four cases presented in Figure 4.
for this column) and (b) the corresponding shear strain rates, at the location 200 km from the summit, for the four cases presented in Figure 4.
Conclusion
The case treated here is an idealised example, chosen to illustrate the principles and demonstrate our model, and our studies to date are not extensive enough to draw detailed conclusions about the magnitude of the influence of anisotropic rheology on ![]() over the range of situations present in the Antarctic ice sheet. Even in our idealised situation, the values of λ vary significantly with location, and at this stage it would appear necessary to evaluate them on a sile-by-sitc basis. From the results presented we can see directly that for thick ice, smooth bedrock and high basal temperature gradients, λ can be relatively high, but we can also infer that for thin ice, rough bedrock and low basal temperature gradients, λ may be much smaller. The concept of a localised onset of enhanced shear flow reproduces some features of the strain-rate profiles seen in several borehole studies, but it is clear that bedrock roughness and the treatment of the enhancement factor in the region near the bedrock is important and requires further study.
over the range of situations present in the Antarctic ice sheet. Even in our idealised situation, the values of λ vary significantly with location, and at this stage it would appear necessary to evaluate them on a sile-by-sitc basis. From the results presented we can see directly that for thick ice, smooth bedrock and high basal temperature gradients, λ can be relatively high, but we can also infer that for thin ice, rough bedrock and low basal temperature gradients, λ may be much smaller. The concept of a localised onset of enhanced shear flow reproduces some features of the strain-rate profiles seen in several borehole studies, but it is clear that bedrock roughness and the treatment of the enhancement factor in the region near the bedrock is important and requires further study.
The present study shows that, in regions where the ice flows predominantly by deformation, deviations from the relative simplicity of isotropic temperature-dependent rheology appreciably influence the value of ![]() . Accordingly, anisotropic rheology plays a role in the accurate comparison of balance fluxes with fluxes based on field measurements of surface velocity and ice thickness. This study also serves as a more general caution that the complicated character of ice flow near the base of ice sheets, revealed by a few borehole measurements and perhaps implicit in the layer features revealed in radar-echo sounding, is a source of uncertainty affecting our ability to assess accurately the state of Antarctic mass balance and its contribution to sea-level change.
. Accordingly, anisotropic rheology plays a role in the accurate comparison of balance fluxes with fluxes based on field measurements of surface velocity and ice thickness. This study also serves as a more general caution that the complicated character of ice flow near the base of ice sheets, revealed by a few borehole measurements and perhaps implicit in the layer features revealed in radar-echo sounding, is a source of uncertainty affecting our ability to assess accurately the state of Antarctic mass balance and its contribution to sea-level change.
Acknowledgements
The authors wish to thank W. Budd andT. H. Jacka for continuing discussions, and V. Morgan and his co-workers for providing their results from Law Dome prior to publication.


 from a flowline model of a hypothetical large ice sheet to demonstrate how development of an anisotropic ice-crystal fabric can influence the depth profile of horizontal velocity. The temperature dependence of ice rheology, combined with typical ice-sheet temperature profiles, yields a more block-like velocity profile with
  increasing to values in the range 0.89-0.96 from the isothermal rheology value of 0.8. Our results show that the onset of enhanced shear flow with increasing shear strain, as a consequence of anisotropy, and then a reduction of enhancement nearer the bedrock, can modify the velocity profile, giving
  values typically in the range 0.86-0.91. Smaller values than these may also occur for rougher bedrock or thinner ice.


