Introduction
The European Project for Ice Coring in Antarctica (EPICA) focuses on the drilling of deep ice cores at two sites: Dome Concordia in the Indian/Pacific sector, and Dronning Maud Land in the Atlantic sector of Antarctica. the low accumulation rates at Dome Concordia ensure the likelihood of obtaining a climatic record over several glacial cycles, as at Vostok. the higher accumulation rates in Dronning Maud Land allow for a more detailed record over the last glacial cycle. Additionally, the possible link between the climates of the Atlantic sector of Antarctica and of central Greenland via the Atlantic Ocean was a reason for selecting a drilling site in Dronning Maud Land. the inland ice of Dronning Maud Land was still a rather unexplored part of the Antarctic ice sheet. Therefore, an intensive pre-site survey programme was set up to define the position of the drilling site. It comprised ice-thickness measurements by airborne radio-echo sounding surveys (Reference Steinhage, Nixdorf, Meyer and MillerSteinhage and others, 1999), ice-flow measurements by global positioning system and glaciological investigations. Norway, Sweden, the Netherlands, the United Kingdom and Germany are involved with traverse work and airborne surveys. the glaciological studies revealed, among other things, the spatial distribution of accumulation rates across Amundsenisen (Reference Van den BroekeVan den Broeke andothers, 1999; Reference OerterOerter and others, 2000) and the accumulation history during the last millennium (Reference SommerSommer and others, 2000a). This paper focuses on the stable-isotope content of the firn and ice. the time series of the stable-isotope content document the climate history of the last millennium. the regional distribution of the stable-isotope content of the near-surface snow and the firn temperature at 10 m depth provides an isotope–temperature relationship, a measure of the sensitivity of the isotope composition to climate change at least in the Holocene.
Holocene climate records are attracting increasing attention for at least two reasons:
possible man-made warming must be seen in the context of the Holocene climate variability;
records are necessary for general circulation model numerical experiments, which are expected to contribute to the understanding of the climate system and of the regional and temporal variability, which is documented in the records from different regions.
In the case of Antarctica, only a few records span the last millennium and provide detailed information for this period (for a review see, e.g., Reference Mosley-Thompson, Bradley and JonesMosley-Thompson, 1995; Reference Peel and JonesPeel, 1995). the annually resolved records from Dronning Maud Land, presented here, will supplement these records. They provide detailed information on the climate during the last millennium in the Atlantic sector of the inland ice of Antarctica.
Fieldwork
The 1997/98 field season in Dronning Maud Land is described in detail by Reference OerterOerter and others (2000). the traverse programme included the drilling of 15 firn cores at 12 locations down to 30– 42 m depth, and of three ice cores to 115–150m depth (Fig. 1). Additionally, snow-pit samples were taken to ensure proper representation of the near-surface layers, because core quality is usually reduced in the uppermost 2 m. the firn cores from Amundsenisen were labelled FB9803–FB9817 (for details see Reference OerterOerter and others, 2000, table 1). Some of the core analyses were performed in field laboratories at Neumayer station, which were equipped with devices to measure dielectric properties of the firn and ice (dielectric profiling (DEP); Reference Wilhelms, Kipfstuhl, Heinloth and FirestoneWilhelms and others, 1998), the density by gamma-ray attenuation (Reference Gerland, Oerter, Wilhelms, Miller and MinersGerland and others, 1999), and some of the major chemical constituents by continuous flow analysis (CFA; Reference Sigg, Fuhrer and StaffelbachSigg and others, 1994; Reference SommerSommer andothers, 2000a,Reference Sommer, Wagenbach, Mulvaney and Fischerb). Additionally, facilities were available for cutting and subsampling the cores for further analysis. the cores and the subsamples were shipped at the end of the field season to the cold storage of the Alfred-Wegener-Institut (AWI) in Bremerhaven. the stable-isotope analyses were performed in the laboratories of AWI in Bremerhaven and GSF in Neuherberg. Stable-isotope depth profiles were measured with a depth resolution of about two samples per year and were not done to support the dating of the cores. Isotope results are given as deviation from the Vienna Standard Mean OceanWater (V-SMOW) in per mil; the accuracy of the 18Omeasurements is better than 0.1‰.
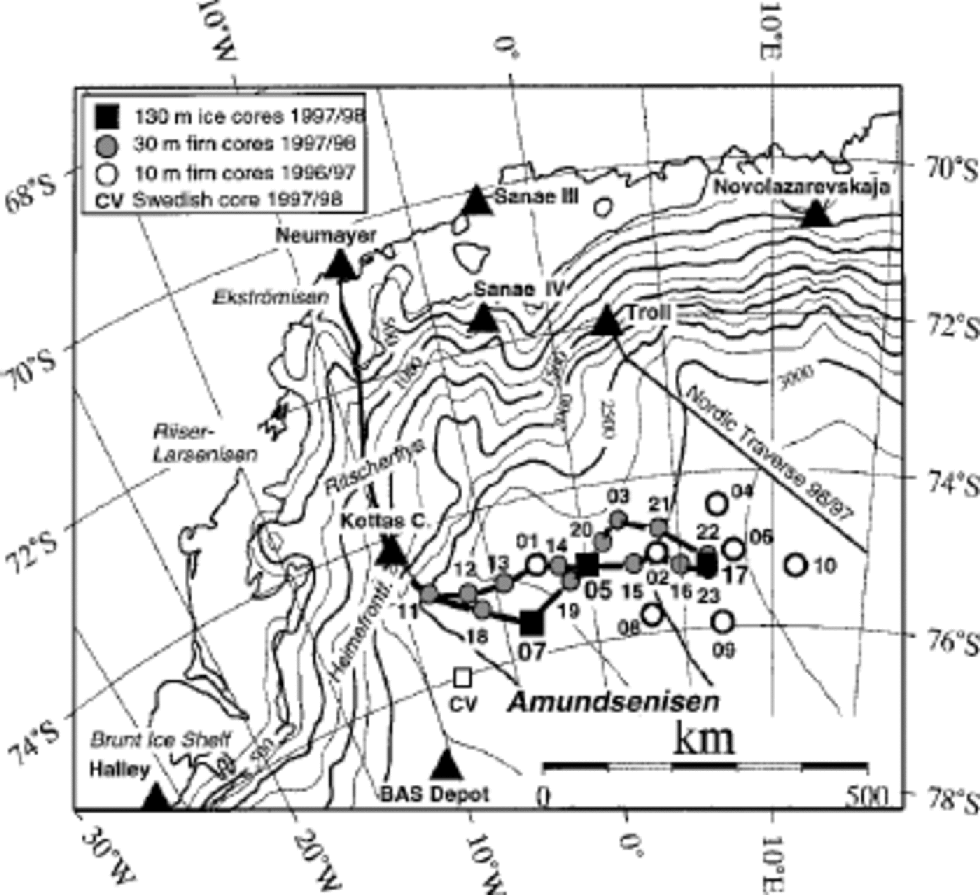
Fig. 1 Map of Dronning Maud Land showing the AWI traverse route 1997/98 and drill locations. Elevation data based on European Remote-sensing Satellite (ERS-1) altimetry (courtesy of J. Bamber, University of Bristol).
ResultsFootnote 1
Dating of the cores
layers from the eruptions of the volcanoes Krakatao (1883), Tambora (1815) and an unknown one (1809), Kuwae (1458) and El Chichon (?) (1259) served as reference horizons (for DEP profiles see Reference OerterOerter and others, 2000, fig. 2). Between these reference horizons a depth–time relation was established by layer counting. the dating of the cores at the horizons is as accurate as the volcanic chronology. In between, the accuracy is estimated to be about 2% of the time interval to the nearest reference horizon. Uncertainty arises because parts of the profiles are missing and because the profiles allow different stratigraphical interpretation. to calculate time series of accumulation rates and stable-isotope content, only the dating down to the deepest detectable volcanic horizon has been used, even if cores reached further back in time, to avoid inaccessible dating errors. None of the 15 shallow firn cores is long enough to reach the horizon of the Kuwae eruption (1458), but 13 of them contain the horizons caused by the volcano eruptions in 1815 and 1809. the three deeper cores were dated over the last millennium.
The firn cores were dated using the depth profiles resulting from DEP and CFA (Reference OerterOerter and others, 2000; Reference SommerSommer and others 2000a; Reference Göktas, Fischer, Oerter, Weller, Sommer and MillerGöktas and others, 2002). the CFA and DEP profiles contain stratigraphic signals, which result from the seasonal variations of the snow chemistry and from acid-containing layers deposited after volcanic events. the acid
Records of accumulation rates and isotope content
Records of accumulation rates and stable-isotope content are based on the depth–time relations and on depth profiles of stable-isotope content and firn density and are approximately annually resolved, the sampling error is less than half a year. Altogether there are 16 records which span the last 200 years (Fig. 2), and three 1000 year records (not shown).
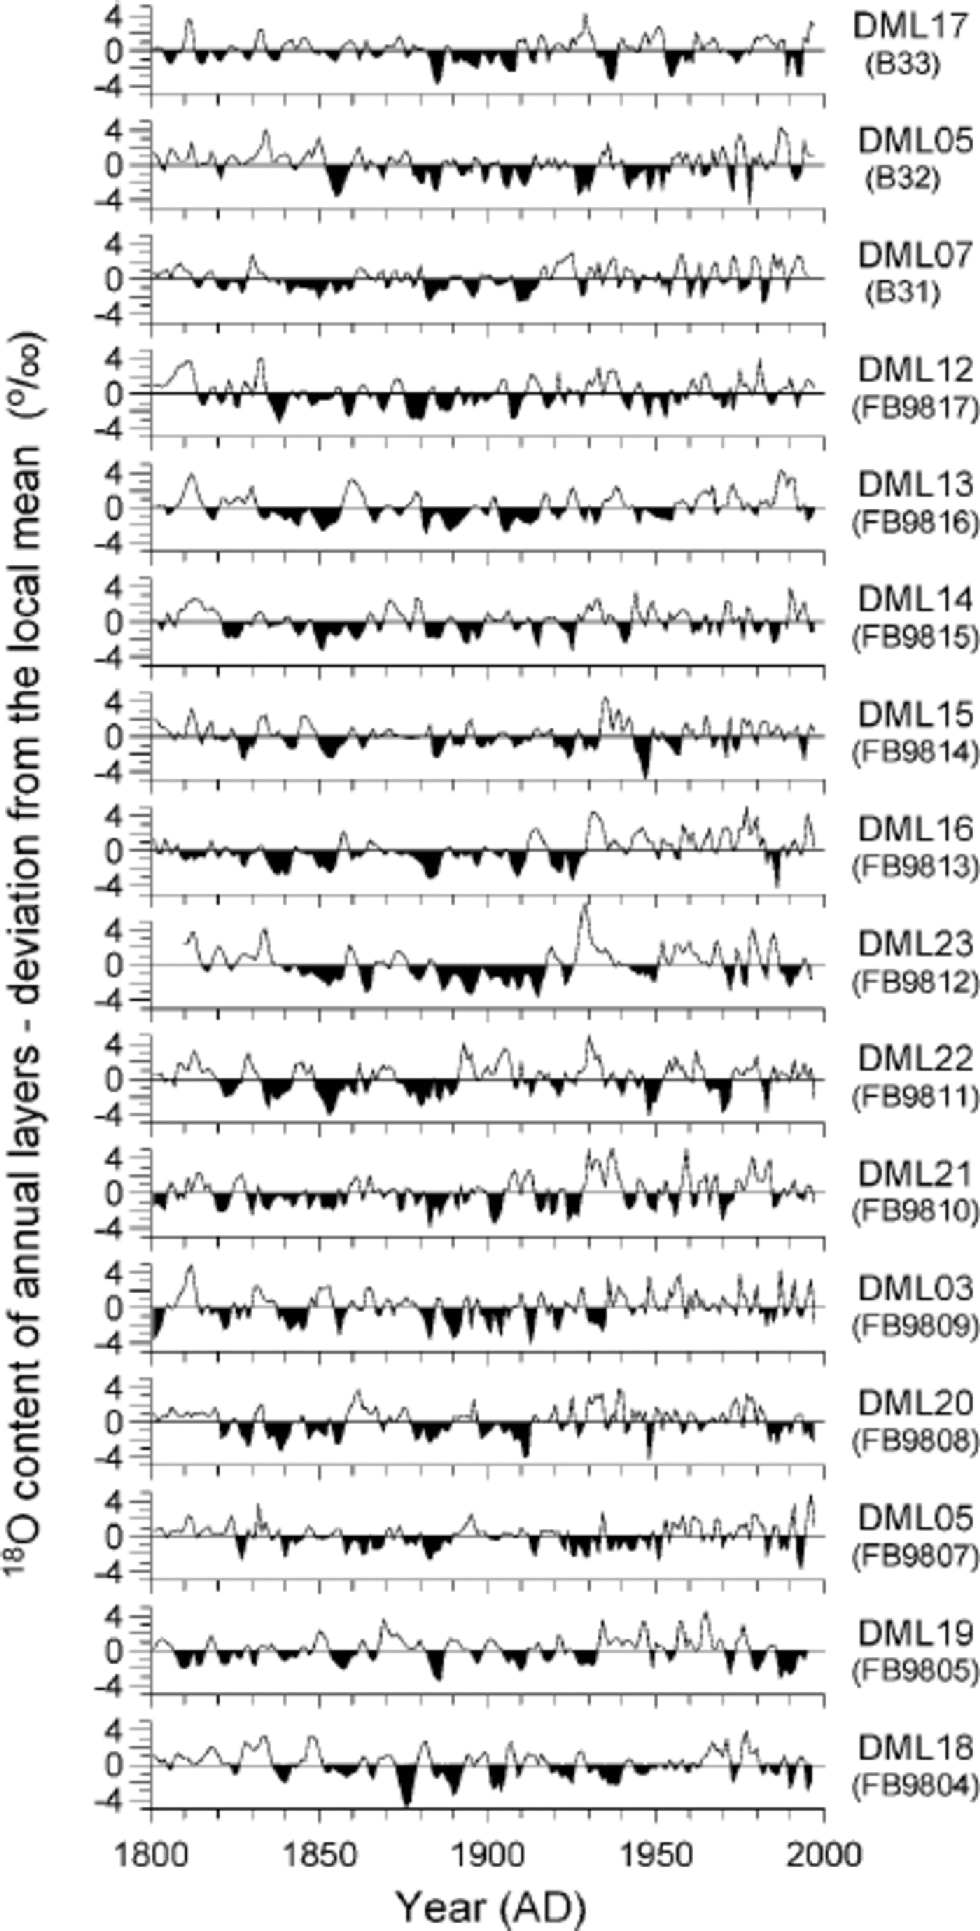
Fig. 2 Annually resolved 200 year time series of 18O content from 16 locations on Amundsenisen (Fig. 1). the values are shown as deviation from the local mean.
The individual records are poorly correlated. In the case of the 200 year chronologies, only 57 of 120 cross-correlations are significant (95% confidence level) between the 18O records, and only 19 between the records of the accumulation rates. This could mean that the records contain no common (climatic) signal. That, however, is most probably not the case. the number of significant correlations is certainly low, but higher than it would be for records consisting of random numbers. Further, the records are from a restricted area extending 500 km from west to east and 200 km from north to south at Amundsenisen. Therefore, it is probable that they contain a common climatic signal, which is superimposed by noise inherent in the snow archive (deposition noise; Reference RobinRobin, 1983). Under this assumption, the common signal can be enhanced by stacking the individual records, and under the further assumption that the statistics of the noise are the same in all records, the signal-to-noise variance ratio can be estimated by simple variance analyses (Reference Fisher, Reeh and Clausen.Fisher and others, 1985; Reference JohnsenJohnsen and others, 1997) to assess the climatic significance of the records.
To calculate composite records, the individual records were normalized (μ = 0, Var = 1) and the normalized records stacked. Finally, these intermediate records (μ = 0 and σ <1) were multiplied by the mean of standard deviations of the individual records (Fig. 3 and 4). the purpose of this procedure was to ensure that each record contributes in the same manner to the composite record. Actually, it makes no difference if the composite records are calculated according to this procedure or as a simple average over the individual records.

Fig. 3 Composite 200 year records of 18Ocontents (below) and accumulation rates (middle). Each record consists of 16 individual records; the individual 18O records are shown in Figure 2; for the records of the accumulation rates see Reference OerterOerter and others (2000). Temperature records were calculated from the composite records using the empirical 18O–temperature and accumulation-rate–temperature relationships and smoothed with a 45 year Gaussian low-pass filter (above). the error bars indicate the 2σ standard errors of the values.
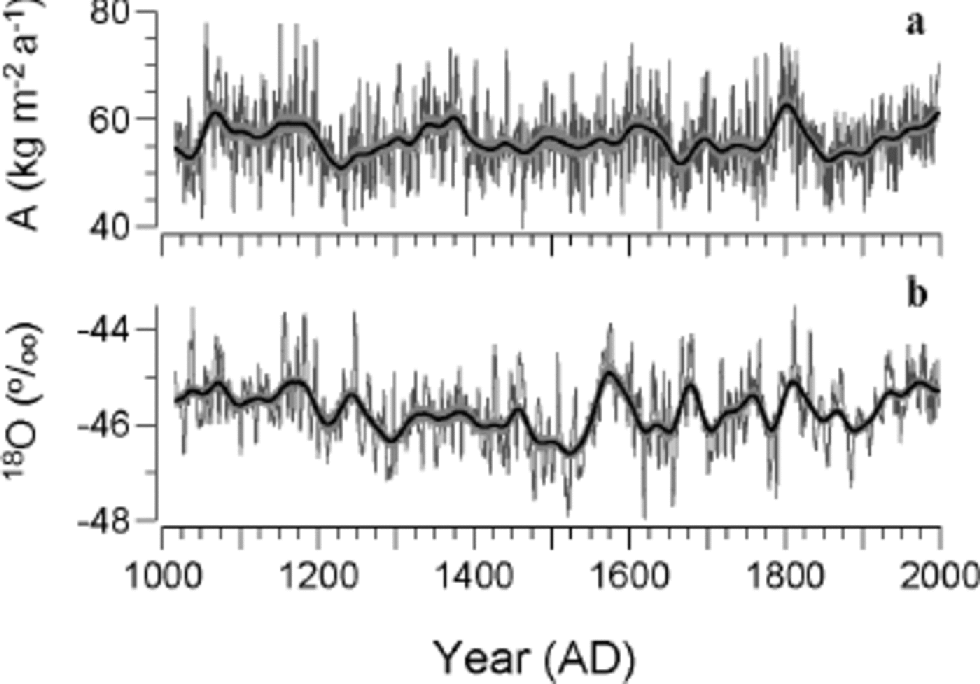
Fig. 4 Composite 1000 year records of accumulation rates (a) and 18O contents (b). Each record consists of three individual records before 1800 and of 16 records thereafter. Also shown are the smoothed records (by use of a 60 year Gaussian low-pass filter) and the 95% confidence intervals of these records.
Signal-to-noise variance ratio
The cross-correlation coefficients (rxy) indicate low signal-to-noise variance ratios F) in the individual records. the equation ![]() connects both parameters (Reference Fisher, Reeh and Clausen.Fisher and others, 1985). Alternatively, F can be assessed with the mean variance of the individual records (X ), the variance of the composite record
connects both parameters (Reference Fisher, Reeh and Clausen.Fisher and others, 1985). Alternatively, F can be assessed with the mean variance of the individual records (X ), the variance of the composite record ![]() and the number of the individual records (N) by the equation,
and the number of the individual records (N) by the equation, ![]()
![]() which is based, among other things, on the assumption that the variance of the noise in the composite record is reduced by N (Reference JohnsenJohnsen and others, 1997). Regarding the records from Amundsenisen (Table 1), the signal-to-noise variance ratio is 0.14 and 0.04 for the records of the 18O contents and the accumulation rates, respectively. In the composite 200 year records these ratios are enhanced by a factor of 16 so that the variance of the signal in relation to the total variance, F /(1 – F), increases from 12% to 69% and from 4% to 40%, respectively.
which is based, among other things, on the assumption that the variance of the noise in the composite record is reduced by N (Reference JohnsenJohnsen and others, 1997). Regarding the records from Amundsenisen (Table 1), the signal-to-noise variance ratio is 0.14 and 0.04 for the records of the 18O contents and the accumulation rates, respectively. In the composite 200 year records these ratios are enhanced by a factor of 16 so that the variance of the signal in relation to the total variance, F /(1 – F), increases from 12% to 69% and from 4% to 40%, respectively.
Table 1. Mean variance of individual records (X) and variance of composite records ![]() and the signal-to-noise variance ratio (F) in the individual records
and the signal-to-noise variance ratio (F) in the individual records

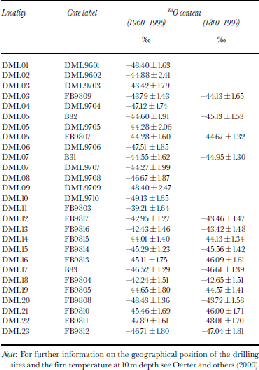
Table 2. Firn cores sampled on Amundsenisen, 1996–98.The mean local 18O contents and the scatter (1σ) of the annual values for the given periods are shown
F allows calculation of the variance of the noise, and assessment of confidence ranges in the records. Further, the signal-to-noise variance is a measure of resolution power of the time series. the higher the value of F the more sensitive is the record. for F values of 0.89, such as in the Greenland records (Reference JohnsenJohnsen and others, 1997), short-term variations of 18O contents are easier to detect than at Amundsenisen (Reference WhiteWhite and others, 1997). to make the time series from Amundsenisen as sensitive as the Greenland records, they must be stacked to reduce the variance of the noise. If only one record is available, the noise must be reduced by filtering techniques, which also affect the high-frequency part of the signal. In consequence, only strong and/or persistent signals can be detected. Figure 5 shows which signals can presumably be detected in the planned EPICA Dronning Maud Land core.

Fig. 5 Detection limits for 18Osignals in a noisy record depend on the strength of the signal and its duration (or equivalently on the number of stacked records) and on the standard deviation of the noise. the signal is assumed to be a rectangular pulse for
Regional distribution of the stable-isotope contents
Averages of the 18O contents over the last 200 or the last 40 years (for the shorter firn cores see Reference Oerter, Graf, Wilhelms, Minikin and MillerOerter and others, 1999) were used for compilation of the local data. Mixingthe datasets is justified, because the mean values in both periods are similar, even though remarkable fluctuations of the annual 18O contents in the last 200 years are observed (Fig. 3). the correlation between the local means of 18O content and firn temperature at 10m depth is very close (Fig. 6). the isotope–temperature relationship, d(δ18O)/dT = 0.77 ±0.14% K–1 (n = 19, ![]() 0.94) is typical for regions where precipitation is formed above the temperature-inversion layer and formed under supersaturation and adiabatic conditions (Reference Lorius and MerlivatLorius and Merlivat, 1977). the regional distribution of the 18O content is much more regular than that of the accumulation rates. Obviously, processes that influence the accumulation rates, like wind erosion, have no influence on the stable-isotope content. for example, at some sites in western Dronning Maud Land (south of the ice divide) the accumulation rate is lower than expected from the firn temperature (Reference OerterOerter and others, 2000), but the 18O contents of the firn from these sites fit into the isotope–temperature relationship (Fig. 6). That means that the seasonal distribution of the precipitation in Dronning Maud Land must be more or less the same, regardless of the accumulation rates2.
0.94) is typical for regions where precipitation is formed above the temperature-inversion layer and formed under supersaturation and adiabatic conditions (Reference Lorius and MerlivatLorius and Merlivat, 1977). the regional distribution of the 18O content is much more regular than that of the accumulation rates. Obviously, processes that influence the accumulation rates, like wind erosion, have no influence on the stable-isotope content. for example, at some sites in western Dronning Maud Land (south of the ice divide) the accumulation rate is lower than expected from the firn temperature (Reference OerterOerter and others, 2000), but the 18O contents of the firn from these sites fit into the isotope–temperature relationship (Fig. 6). That means that the seasonal distribution of the precipitation in Dronning Maud Land must be more or less the same, regardless of the accumulation rates2.
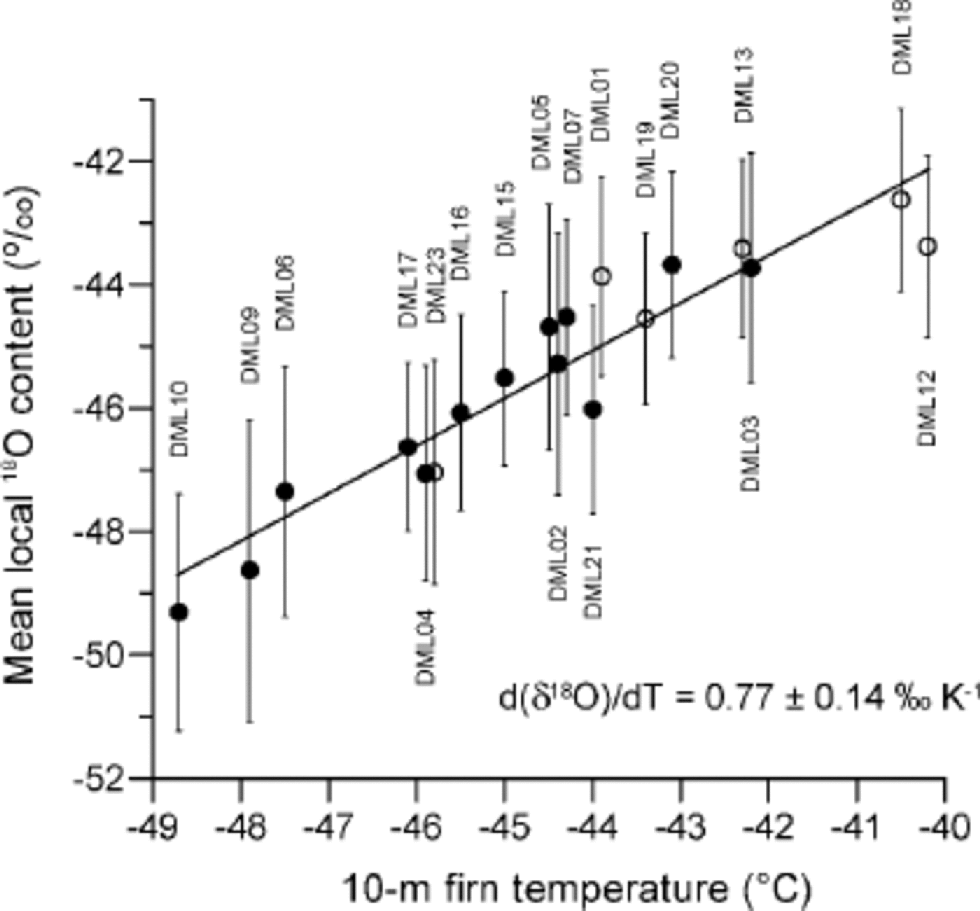
Fig. 6 Isotope–temperature relationship based on spatial distributed data on Amundsenisen (cf. Table 2). Open symbols mark sites with deficit accumulation rates according to the 10 m temperature ( Reference OerterOerter and others, 2000).
Discussion
The residual noise in the composite 200 year chronologies is still high, as can be seen from the standard errors in Figure 3. Short-term variation of the accumulation rates is not displayed at all. the signal-to-noise ratio of the 18O records is higher, so variations of the 18O contents with periods around 15 and 20 years (according to spectral analysis) can be detected including minimum values around 1885. Long-term variations are displayed in both records. Remarkably, these variations are similar, with low values at the turn of the 20th century. This common long-term signal is the reason for a significant correlation between the two records (r = 0.29). There are at least two possible ways of explaining these variations. First, the build-up of the snow cover has altered over the centuries. A 40% change in winter-to-summer precipitation ratio could account for the observed variation (assuming an isotopic difference of 10‰ 18O between winter and summer precipitation). Second, long-term temperature changes have simultaneously influenced the accumulation rates and the 18O contents. Indeed, nearly the same temperature development could explain the variation in the records (Fig. 3) assuming that the temperature relationships, ![]() (Fig. 6) and
(Fig. 6) and ![]() (Reference OerterOerter and others, 2000), which are based on spatial distributed data, hold in time. Possibly, we see the result of a combination of processes, some of them still not taken into consideration. Adopting the temperature scenario, the record would stand for a temperature increase in the 20th century, which occurred almost entirely during the decades 1910–40. This period coincides with the first period of global warming in the 20th century (Fig. 7), according to the temperature reconstruction by Reference Mann and HughesMann and others (1998), which was ascribed by Reference Delworth and KnutsonDelworth and Knutson (2000) primarily to the variability of the coupled ocean–atmosphere system. the second period of global warming, beginning in 1978 and attributed primarily to greenhouse-gas forcing (Intergovernmental Panel on Climate Change, 2001, http://www.ipcc.ch), is not seen on Amundsenisen. Further, the strong fluctuations in the 18O record are not displayed in the temperature record and are perhaps not temperature-induced.
(Reference OerterOerter and others, 2000), which are based on spatial distributed data, hold in time. Possibly, we see the result of a combination of processes, some of them still not taken into consideration. Adopting the temperature scenario, the record would stand for a temperature increase in the 20th century, which occurred almost entirely during the decades 1910–40. This period coincides with the first period of global warming in the 20th century (Fig. 7), according to the temperature reconstruction by Reference Mann and HughesMann and others (1998), which was ascribed by Reference Delworth and KnutsonDelworth and Knutson (2000) primarily to the variability of the coupled ocean–atmosphere system. the second period of global warming, beginning in 1978 and attributed primarily to greenhouse-gas forcing (Intergovernmental Panel on Climate Change, 2001, http://www.ipcc.ch), is not seen on Amundsenisen. Further, the strong fluctuations in the 18O record are not displayed in the temperature record and are perhaps not temperature-induced.
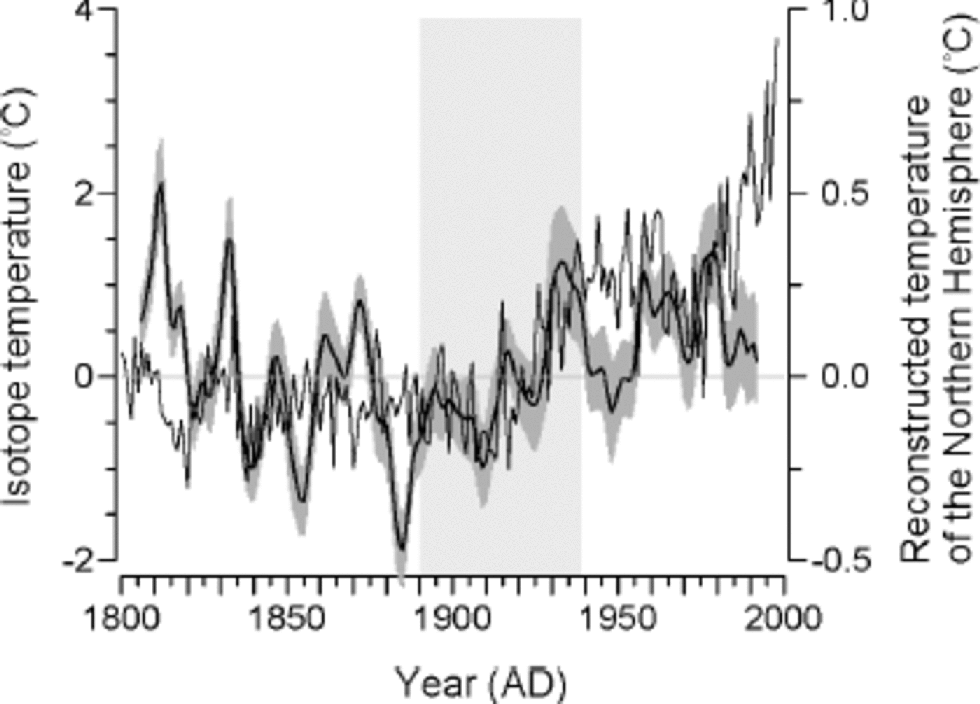
Fig. 7 Isotope temperature (with the 95% confidence range) and the Northern Hemisphere temperature reconstructed by Reference Mann and HughesMann and others (1998). the isotope temperature record is smoothed with a 7 year Gaussian low-pass filter. Deviations from the 1890–1940 average are shown.
The 1000 year chronologies from Amundsenisen also display remarkable features (Fig. 4), notably a 350 year period from AD 1180 to 1530 with decreasing δ18O values and a return to values before 1200 within a short 50 year period. In this context, the increase of the δ18O values in the 20th century and the values at the end of the century are by no means extraordinary. the Little Ice Age cold period, which is widely seen in the Northern Hemisphere, and has also been detected by Reference Thompson, Dansgaard and Grootes.Thompson and others (1986) in tropical Quelccaya ice cap, Peru, is not present in Dronning Maud Land. This period 1650–1850 is characterized in Dronning Maud Land by strong fluctuations of 18Ocontents around average values.
The composite records can be regarded as representative for Amundsenisen. the only other isotope record from this area (Reference Isaksson, Karlén, Gundestrup, Mayewski, Whitlow and TwicklerIsaksson and others, 1996) fits into our composite record, and in the common period 1865–1990 displays the same 18O trend (0.00618O–‰ a–1). the Weddell Sea region had a different climate history, as revealed by cross-correlations between the few available records, which are well dated and annually resolved. These records are from the north and south domes of Berkner Island (Reference MulvaneyMulvaney and others, 2002), from Dolleman Island (Reference Peel and MulvaneyPeel and Mulvaney, 1992) and the central Ronne Ice Shelf (Reference Graf, Reinwarth and MoserGraf and others, 1990). the result of a cross-correlation analysis is largely dependent on the time interval considered. Therefore, the relationships between records will be described by a series of correlation coefficients calculated in a moving window rather than by a single value. for the calculations a 100 year window was selected (Fig. 8). With one exception, the coefficients oscillate between positive and negative values. for example, the records from south Berkner Island and Dolleman Island are correlated negatively in the 19th century and positively in the 18th century. the records from south Berkner Island and the Ronne Ice Shelf are longer and allow calculation of a 420 year series of correlation coefficients. the series is comparable with the former one in the last 300 years and displays variations with a period of about 200 years. the corresponding series from the two Berkner Island records indicates a similar correlation pattern but with a 100 year phase shift. the reasons for these findings in records from locations only 140 km apart are still unclear. Positive and negative correlations can also be seen between the records from south Berkner Island and Dronning Maud Land.
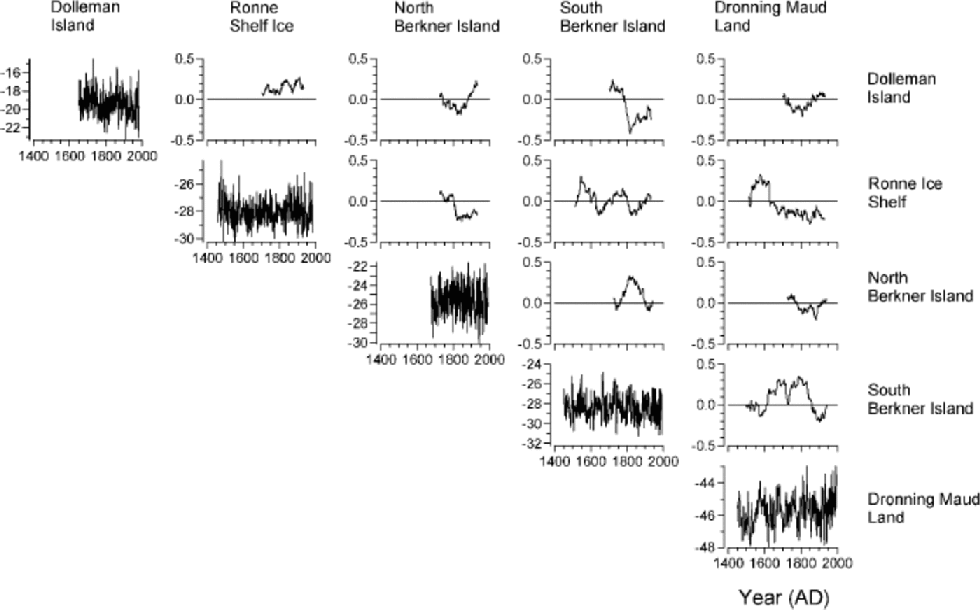
Fig. 8 Cross-correlation between time series from Antarctica. Panels are arranged as a cross-correlation matrix. the diagonal elements show the time series, and the other elements series of cross-correlation coefficients calculated in a moving 100 year window. Data for Dolleman Island from Reference Peel and MulvaneyPeel and Mulvaney (1992), for Ronne Ice Shelf from Reference Graf, Reinwarth and MoserGraf and others (1990) and for north Berkner Island from Reference MulvaneyMulvaney and others (2002).
Conclusion
Differences in the climate history of Antarctic regions are known from reviews by Reference Mosley-Thompson, Bradley and JonesMosley-Thompson (1992) and Reference Peel and JonesPeel (1992). the Little Ice Age provides one prominent example. the new records from Amundsenisen give further information about the variability of climate in space and time in the Atlantic sector of Antarctica. the composite 200 and 1000 year records of accumulation rates and 18O contents, built from 16 short and 3 long individual ice-core records, respectively, are regarded as representative for Amundsenisen. Presumably, both types of records document the climate history in this region of Antarctica. the isotope–temperature relationship indicates that the sensitivity of 18O values to temperature changes is as large as in other inland regions of Antarctica. This relation based on spatially distributed data is believed to hold also in time at least in the Holocene. the relatively low signal-to-noise variance ratio in the records sets limits for the detection of signals and/or reduces the time resolution of the record that will be retrieved in the next few years within EPICA in Dronning Maud Land.
Acknowledgements
We thank H. Rufli (University of Bern), W.-D. Hermichen, A. Jaeschke and F. Valero-Delgado (AWI) for assistance in the field laboratory and cold laboratory at AWI. We also thank A. Olfmann and P. Seibe. (GSF) as well as G. Meyer and E. Viehof. (AWI) for doing isotope measurements. Thanks go to all members of the German EPICA traverse in 1997/98 for assisting with the fieldwork. Financial support by Deutsche Forschungsgemeinschaft (Project Re762/2 and Oe130/3) is gratefully acknowledged. This work is a contribution to the ``European Project for Ice Coring in Antarctica’’ (EPICA), a joint European Science Foundation (ESF)/ European Commission (EC) scientific programme, funded by the EC and by national contributions from Belgium, Denmark, France, Germany, Italy, the Netherlands, Norway, Sweden, Switzerland and the United Kingdom. This is EPICA publication No. 31.


