


Introduction
Modern conflict archaeology is a rapidly evolving discipline that deals with the material legacies and complex landscapes of war of recent warfare (Saunders Reference Saunders2012). While in the UK and USA there is a long-standing and diverse tradition of battlefield archaeology (Pollard & Banks Reference Pollard and Banks2005), research in continental Europe has focused primarily on the remains of the First World War. The remains of that conflict have been studied in detail through excavation (Desfossés et al. Reference Desfossés, Jacques and Prilaux2008), aerial photography (Stichelbaut et al. Reference Stichelbaut, Gheyle, Eetvelde, Meirvenne, Saey, Note, Van den Berghe and Bourgeois2017), geophysical prospection (Masters Reference Masters, Stichelbaut and Cowley2016) and light detection and ranging (LiDAR) survey (De Matos-Machado Reference De Matos-Machado2018; Gheyle et al. Reference Gheyle, Stichelbaut, Saey, Note, Van den Berghe, Van Eetvelde, Van Meirvenne and Bourgeois2018). The results of these studies have broadened scholarly horizons (Carpentier et al. Reference Carpentier, Ghesquière, Labbey, Marcigny, Saunders and Cornish2021), attracted attention to other twentieth-century battle sites and, especially, emphasised the greater spatial extent and more varied character of the landscapes of the Second World War that resulted from that conflict's more mobile type of warfare (Dolejš et al. Reference Dolejš, Vojtěch, Martin and Jitka2020; Seitsonen & Ikäheimo Reference Seitsonen and Ikäheimo2021). Among current advances in Second World War archaeology, fieldwork has combined fieldwalking with excavations and archive research (Price & Knecht Reference Price and Knecht2012; Seitsonen Reference Seitsonen2018), and geophysical survey techniques have helped to determine the degree of preservation of the buried battlefield deposits (Everett et al. Reference Everett, Pierce, Save, Warden, Dickson, Burt and Bradford2006; Stele et al. Reference Stele, Schwickert and Rass2021). Increasing access to historical aerial photographic archives (Cowley & Stichelbaut Reference Cowley and Stichelbaut2012) and to historical documentation and remote-sensing data have made it possible to undertake large-scale mapping projects, for example on the defence of Britain (Council for British Archaeology 2006), German prisoner-of-war camps (Carpentier & Marcigny Reference Carpentier and Marcigny2014; Vermard et al. Reference Vermard, Adam and Panisset2016) and defensive and logistical landscapes in France (Capps-Tunwell et al. Reference Capps-Tunwell, Passmore and Harrison2018; Carpentier et al. Reference Carpentier, Ghesquière, Labbey, Marcigny, Saunders and Cornish2021) and Finland (Stichelbaut et al. Reference Stichelbaut, Thomas, Oula, Gheyle, Mulder, Plets, Saunders and Cornish2021b).
The use of LiDAR has had a significant impact on archaeological detection in forested environments (Doneus et al. Reference Doneus, Briese, Fera and Janner2008; Doneus & Briese Reference Doneus, Briese and Cowley2011). The increasing availability of open-access national LiDAR surveys has enabled researchers to detect subtle surface remains that are difficult to discern in the field and across broad landscapes. This is particularly true in forested areas, which are often unresponsive to other archaeological detection methods yet may host some of the most extensive and well-preserved military landscapes of the twentieth century (Passmore et al. Reference Passmore, Harrison and Capps-Tunwell2014; Passmore & Capps-Tunwell Reference Passmore and Capps-Tunwell2020; Weber et al. Reference Weber, Passmore, Capps-Tunwell and Davie2022). Thanks to the application of LiDAR across wide areas and typically on a non-selective basis, the method has been used to detect and investigate many conflict landscapes (Hesse Reference Hesse2014; Van der Schriek & Beex Reference Van der Schriek and Beex2017). More targeted research has focused on bomb-cratered landscapes (Capps-Tunwell et al. Reference Capps-Tunwell, Passmore and Harrison2016; Dolejš et al. Reference Dolejš, Vojtěch, Martin and Jitka2020), military positions (Valjavec et al. Reference Valjavec, Zorn and Ribeiro2018; Seitsonen & Ikäheimo Reference Seitsonen and Ikäheimo2021), logistical hubs (Capps-Tunwell et al. Reference Capps-Tunwell, Passmore and Harrison2015) and prison infrastructure (Kobiałka Reference Kobiałka2017). Since many LiDAR surveys are not conducted for specific archaeological purposes, however, the data may be less than ideal and is often of too coarse a resolution to detect very small features. A recent development that may help resolve this issue is provided by unoccupied aerial vehicles (UAV) equipped with LiDAR (Risbøl & Gustavsen Reference Risbøl and Gustavsen2018; Storch et al. Reference Storch, Jarmer, Adam and de Lange2022). Although they can provide very high-resolution datasets, they have not been used much in archaeological projects to date (Schroder et al. Reference Schroder, Murtha, Golden, Scherer, Broadbent, Almeyda Zambrano, Herndon and Griffin2021).
Such technological advances now make possible a holistic approach to the spatially extensive landscapes of twentieth-century conflicts which may extend over many hundreds of square kilometres. Large-scale landscape approaches provide baseline data useful not only for archaeologists but also for landscape historians, geographers, cultural resource managers and museum curators. Moreover, any development work that requires the protection and management of twentieth-century conflict heritage sites must start from an understanding of the material remains and here archaeological prospecting in its broadest sense can make an important contribution. Such investigations can bring back to light invisible, often buried or barely visible components of the landscape. In turn, these findings might complement or sometimes conflict with the politicised and memorialised war landscapes that are recognised by (official) interpretation panels, memorials and protected site status.
Research objectives
The Ardennes Counteroffensive, or the Battle of the Bulge, was one of the most significant military campaigns of the latter part of the Second World War in western Europe. It took place between 16 December 1944 and 25 January 1945 in the forested Ardennes region of eastern Belgium. Although this is a ‘high-profile’ battlefield, studied intensively by military historians (Cole Reference Cole1964; Zaloga Reference Zaloga2003) and the subject of significant attention in museums and the popular media and through battlefield tourism, little has been published on its material remains.
The vast forested areas of north-western Europe have been shown to contain well-preserved Second World War landscapes (Passmore & Harrison Reference Passmore and Harrison2008; Passmore et al. Reference Passmore, Harrison and Capps-Tunwell2014). In this article, we build on these early field-based studies by exploring the potential of 1m-resolution LiDAR combined with a localised and very-high-resolution UAV LiDAR survey of the Ardennes Counteroffensive landscape. Our objectives were: (1) to establish a baseline audit of archaeological features and document their state of preservation in order to attract attention to this understudied conflict heritage; (2) to gain an understanding of the diversity, complexity, spatial distribution and density of surface features associated with the Second World War and to relate this to the progress of the battle; (3) to present the results of a very-high-resolution LiDAR simultaneous localisation and mapping (SLAM) survey; and (4) to assess the comparative utility of 1m-resolution LiDAR versus SLAM technology for investigating archaeological traces of the Second World War in forested environments.
Study area and historical setting
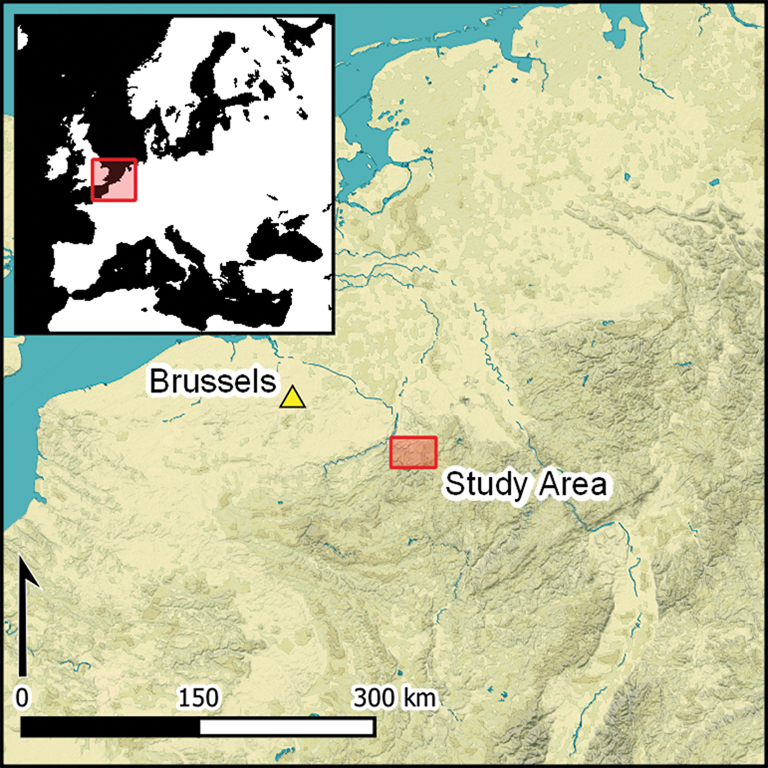
Our study area, between St Vith and Schönberg, is located in the heavily fought-over central zone of the Ardennes Offensive. We focused on a detailed zone of 4.4ha just south-east of Schönberg and a landscape-level study area measuring approximately 13 × 10km east of St Vith (Figure 1). The area is a hilly landscape with extensive forests, deeply incised by the River Our and its tributaries.
Figure 1. Study areas and position of front lines (based on figures from Zaloga Reference Zaloga2003: 58).
Following its defeat in the Normandy campaign of June–August 1944, the German army was forced to retreat before it was able to stabilise the front at the Siegfried Line along Germany's western border. East of St Vith, US forces reached the German border on 11 September and captured parts of the Siegfried Line on the Schnee-Eifel, which was a tree-covered ridge a few kilometres south-east of Schönberg (MacDonald Reference MacDonald1963). A period of relative calm followed, during which US forces adopted a defensive stance and dug in for the winter (Zaloga Reference Zaloga2003). A German counteroffensive codenamed ‘Wacht am Rhein’ was planned to retake territory in the Ardennes during a period of prolonged bad weather that would counter Allied air supremacy. The goal was to recapture the port of Antwerp (Belgium), split the Allied army groups and cut off supply routes. The attack was launched on 16 December 1944. In the central sector of the offensive, units of the 18th Volksgrenadier Division were tasked with capturing the strategic town of St Vith. Between 18 and 19 December, in heavy fighting near Schönberg, regiments of the US 106th Infantry Division and attached artillery units were cut off and surrounded south-east of Schönberg. Attempts to break out failed and 7000 US soldiers surrendered on 19 December 1944 (Zaloga Reference Zaloga2003). Previously, on 17 December, German troops reached the high ground of the Prümerberg, 1.5km east of St Vith, but were stalled by a determined defence until the town fell on 21 December. This significantly slowed the German advance and allowed Allied forces time to reorganise. Between 23 and 27 December, weather conditions improved, enabling the Allies to take control of the air and regain lost ground. It would take almost another month before St Vith was recaptured from German control on 23 January 1945 and a further week before Allied forces reached Schönberg (87th Division 1946).
Events in the St Vith and Schönberg area are described in some detail in military histories and battlefield guides (Whiting Reference Whiting1969; Tolhurst Reference Tolhurst1999; Zaloga Reference Zaloga2003; Cavanagh Reference Cavanagh2004). Precise locational details are, however, often lacking; the available maps are of limited scale, and few contemporary aerial photographs are available. On 16 April 1945, a photograph from a single US-flown sortie (Figure 2) shows our detailed study area partly covered with dense forest and relatively open terrain to the east. Bomb craters are clustered near the River Our and, while many field fortifications are visible in the open fields south of the Schönberg-Andler road, there is virtually no indication of related activities in the forested area.

Figure 2. Aerial photograph, 16 April 1945 (source: NARA, RG 373 – US31/4166-5182).
Data collection
Field fortifications near Schönberg and St Vith were first documented during a pilot field survey in 2008 covering 1.4km2 of accessible plots near the main roads (Passmore & Harrison Reference Passmore and Harrison2008). Our study builds on two distinct LiDAR datasets covering this area (for metadata, see Table S1 in the Online Supplementary Material, OSM). The first is a regional LiDAR survey of Wallonia, which was made available as a 1m-resolution Digital Terrain Model (DTM; Service public de Wallonie (SPW) 2022) whose visualisation revealed an extensive conflict landscape and enabled us to define high-feature-density zones. These were subsequently visited for ground-based observations, and one area was investigated using a detailed UAV LiDAR survey.
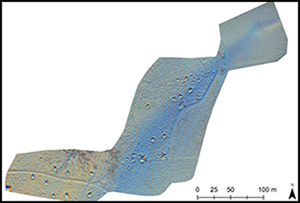
The detailed survey used a GeoSLAM ZEB Horizon mobile laser-scanning device mounted on a UAV. This system has a 360° rotating scanner measuring up to 300 000 points per second within a range of 100m. By combining the laser measurements with a SLAM algorithm an accurate 3D point cloud is obtained (GeoSLAM Ltd 2020; Gollob et al. Reference Gollob, Ritter and Nothdurft2020). By comparing sets of points measured in rapid succession, the algorithm determines the degree of overlap between them as the UAV moves, allowing a model of the environment to be progressively constructed while simultaneously calculating its own position within that model (Local Slam). Individual scans of overlapping areas of consecutive flights are then matched (Global Slam). The result is a high-density point cloud in a local coordinate system, which is then georeferenced to the 1m DTM. During two flights, an area of 4.4ha was scanned resulting in a 44 p/m2 point cloud which was processed into a 15cm-resolution DTM (Figure 3).

Figure 3. Sky-view factor (SVF) visualisation of the 1m DTM (left) compared with the 15cm DTM (right) (figure by Dries Coucke).
To realise the full potential of a DTM for the detection of archaeological relief requires additional visualisation techniques (Opitz & Cowley Reference Opitz and Cowley2013). Multiple and analytical hillshading, simple local relief models and sky-view factor visualisations (SVF) are ideal for highlighting small-scale features (Zakšek et al. Reference Zakšek, Oštir and Kokalj2011). The Relief Visualisation Toolbox (Kokalj et al. Reference Kokalj, Zakšek, Oštir, Opitz and Cowley2013) was used to apply various visualisation methods to both DTMs and to interpret and map visible features. The choice of methods was dictated by good practice (Hesse Reference Hesse2014; Kokalj & Hesse Reference Kokalj and Hesse2017) and by previous experience with detecting subtle First World War archaeological features in Belgium (Gheyle et al. Reference Gheyle, Stichelbaut, Saey, Note, Van den Berghe, Van Eetvelde, Van Meirvenne and Bourgeois2018).
Using the GeoSLAM sensor and UAV offered sufficient flexibility to create very-high-resolution datasets in areas with high densities of features. The main limitations of this approach include limited coverage and the legal necessity to maintain a line of sight when operating the UAV. Although this method has already been applied in forestry (Gollob et al. Reference Gollob, Ritter and Nothdurft2020) and architectural recording (Oniga et al. Reference Oniga, Breaban, Alexe and Văsii2021), to our knowledge, this is its first application for archaeological purposes.
Analysis and interpretation
The 15cm LiDAR visualisations reveal a high density and great diversity of features. Together with site visits, this has enabled us to establish a typology of features, based on their shape, relative size, cross-section and historical parallels in Second World War field manuals (War Department 1944; Rottman Reference Rottman2004). Seven types of features were defined (Figure 4): 1) artillery emplacement: an earthen embankment and embrasure with shelters for artillerymen; 2) bomb crater; 3) dugout with an entrance: excavated shelters with an earthen embankment and a clearly defined entrance (Figure 5) which would have been covered and reinforced with logs; 4) dugout: a broad category of excavated rectangular shelters or storage places with embankments which may also include field fortifications for light artillery or mortars; 5) fox hole: a small and hastily excavated cover for one or two men; 6) trench: rectilinear and short stretches of trench; and 7) undefined: features that are either poorly defined or of irregular shape.

Figure 4. Types of traces visible on the relief visualisations derived from the 15cm DTM (figure by authors).
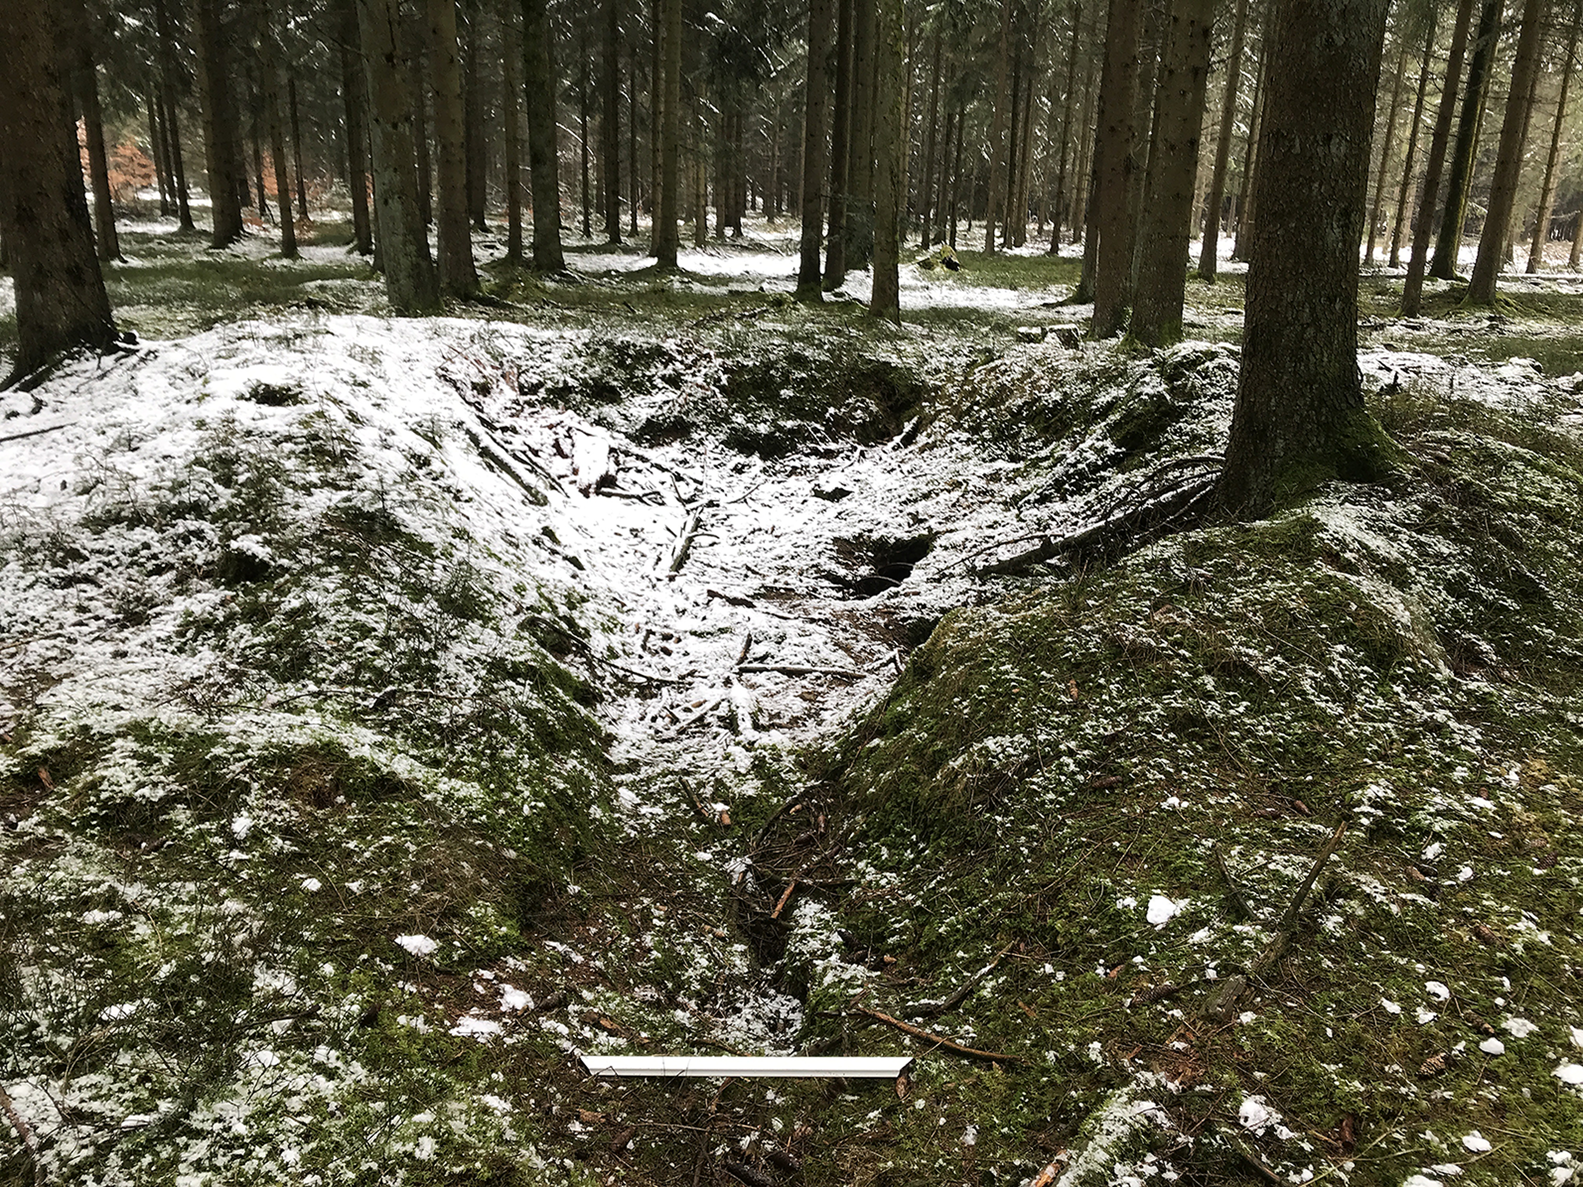
Figure 5. Dugout with entrance; the external dimensions are 7.4 × 9.2m (photograph by Dries Coucke).
The interpretative map of our detailed study area (Figure 6) shows 91 features identified from the 15cm LiDAR survey. Attempts to associate these features with the historical narrative, events and units must take into account four chronological phases: a) the occupation of this area during the quiet period between mid-September and 16 December 1944; b) actions during the early days of the offensive between 17 and 19 December; c) the period of German occupation before the German retreat in late January 1945; and d) the recapture of the terrain by the Allies.

Figure 6. (a) Interpretative map (orthophoto Open Data WalOnMap); (b) multiple hill shading, derived from the 15cm DTM (figure by Dries Coucke).
On the eastern side of the LiDAR plot (Figure 6), four features identified as artillery positions are located within the cover of the east-facing woodland edge with clear fields of fire towards the front line on the Schnee Eifel, some 7km south-east. Two of these emplacements are visible on the 1945 aerial photograph (Figure 2). Clustered around these positions are numerous well-developed dugouts and other earthworks, including fox holes. In the south-western corner there is a group of distinctive dugouts, generally orientated north-south and with entrances to the north. These features are also associated with smaller earthworks, including small dugouts, slit trenches and fox holes. The larger features here may have functioned as shelters and for storage, while some of the smaller features may have served as waste pits or latrines. This assemblage of 91 features is interpreted as the location of a US Army four-gun artillery position with associated supporting field fortifications, probably established between late September and mid-December 1944.
The unit most likely to have occupied this artillery position is one of the four-gun batteries of the 333rd (African American) Field Artillery Battalion. Its three batteries of 155mm howitzers were located in the Schönberg area in support of the 106th Division defending the area (Lengel Reference Lengel2020). This interpretation is also supported by surface finds in the study area, including an artillery fuse and fragments of a ‘Green Bag M3A1’ case for a 155mm howitzer propellant. The abundance of field fortifications in our study area is in marked contrast to the rarity of craters left by bombs or the impact of shells. At this stage in the war, there was little threat from Luftwaffe bombs, while local attacks from tactical Allied aircraft later in the offensive appear to have been focused on targets in the valley of the River Our (as attested to by cratering evident in the April 1945 aerial photograph illustrated in Figure 2).
Towards a landscape-scale analysis
Our detailed study area lies within a broader landscape, which we examined by extending our investigations southwards across the Lindscheid ridge using the 1m LiDAR data combined with ground observations (Figure 7). We identified another 120 features, mainly comprising dugouts (n = 69) and bomb craters (n = 14) clustering near the Bleialf-Schönberg road and the forest path branching from it. This significantly expands the record of 11 features previously documented by Passmore & Harrison (Reference Passmore and Harrison2008: 94). Comparing the 15cm and 1m resolution data (see Figure 3) demonstrates a strong contrast in the visibility of features. The 1m imagery reveals only 35 features compared with 91 features apparent at the 15cm resolution. In addition, the 1m-resolution dataset was much less effective in resolving smaller structures, such as slit trenches (n = 0) and fox holes (n = 4; OSM Table S2). Indeed, fieldwalking in the wider study area identified many small structures, especially fox holes and slit trenches, which were not visible on the 1m LiDAR images.
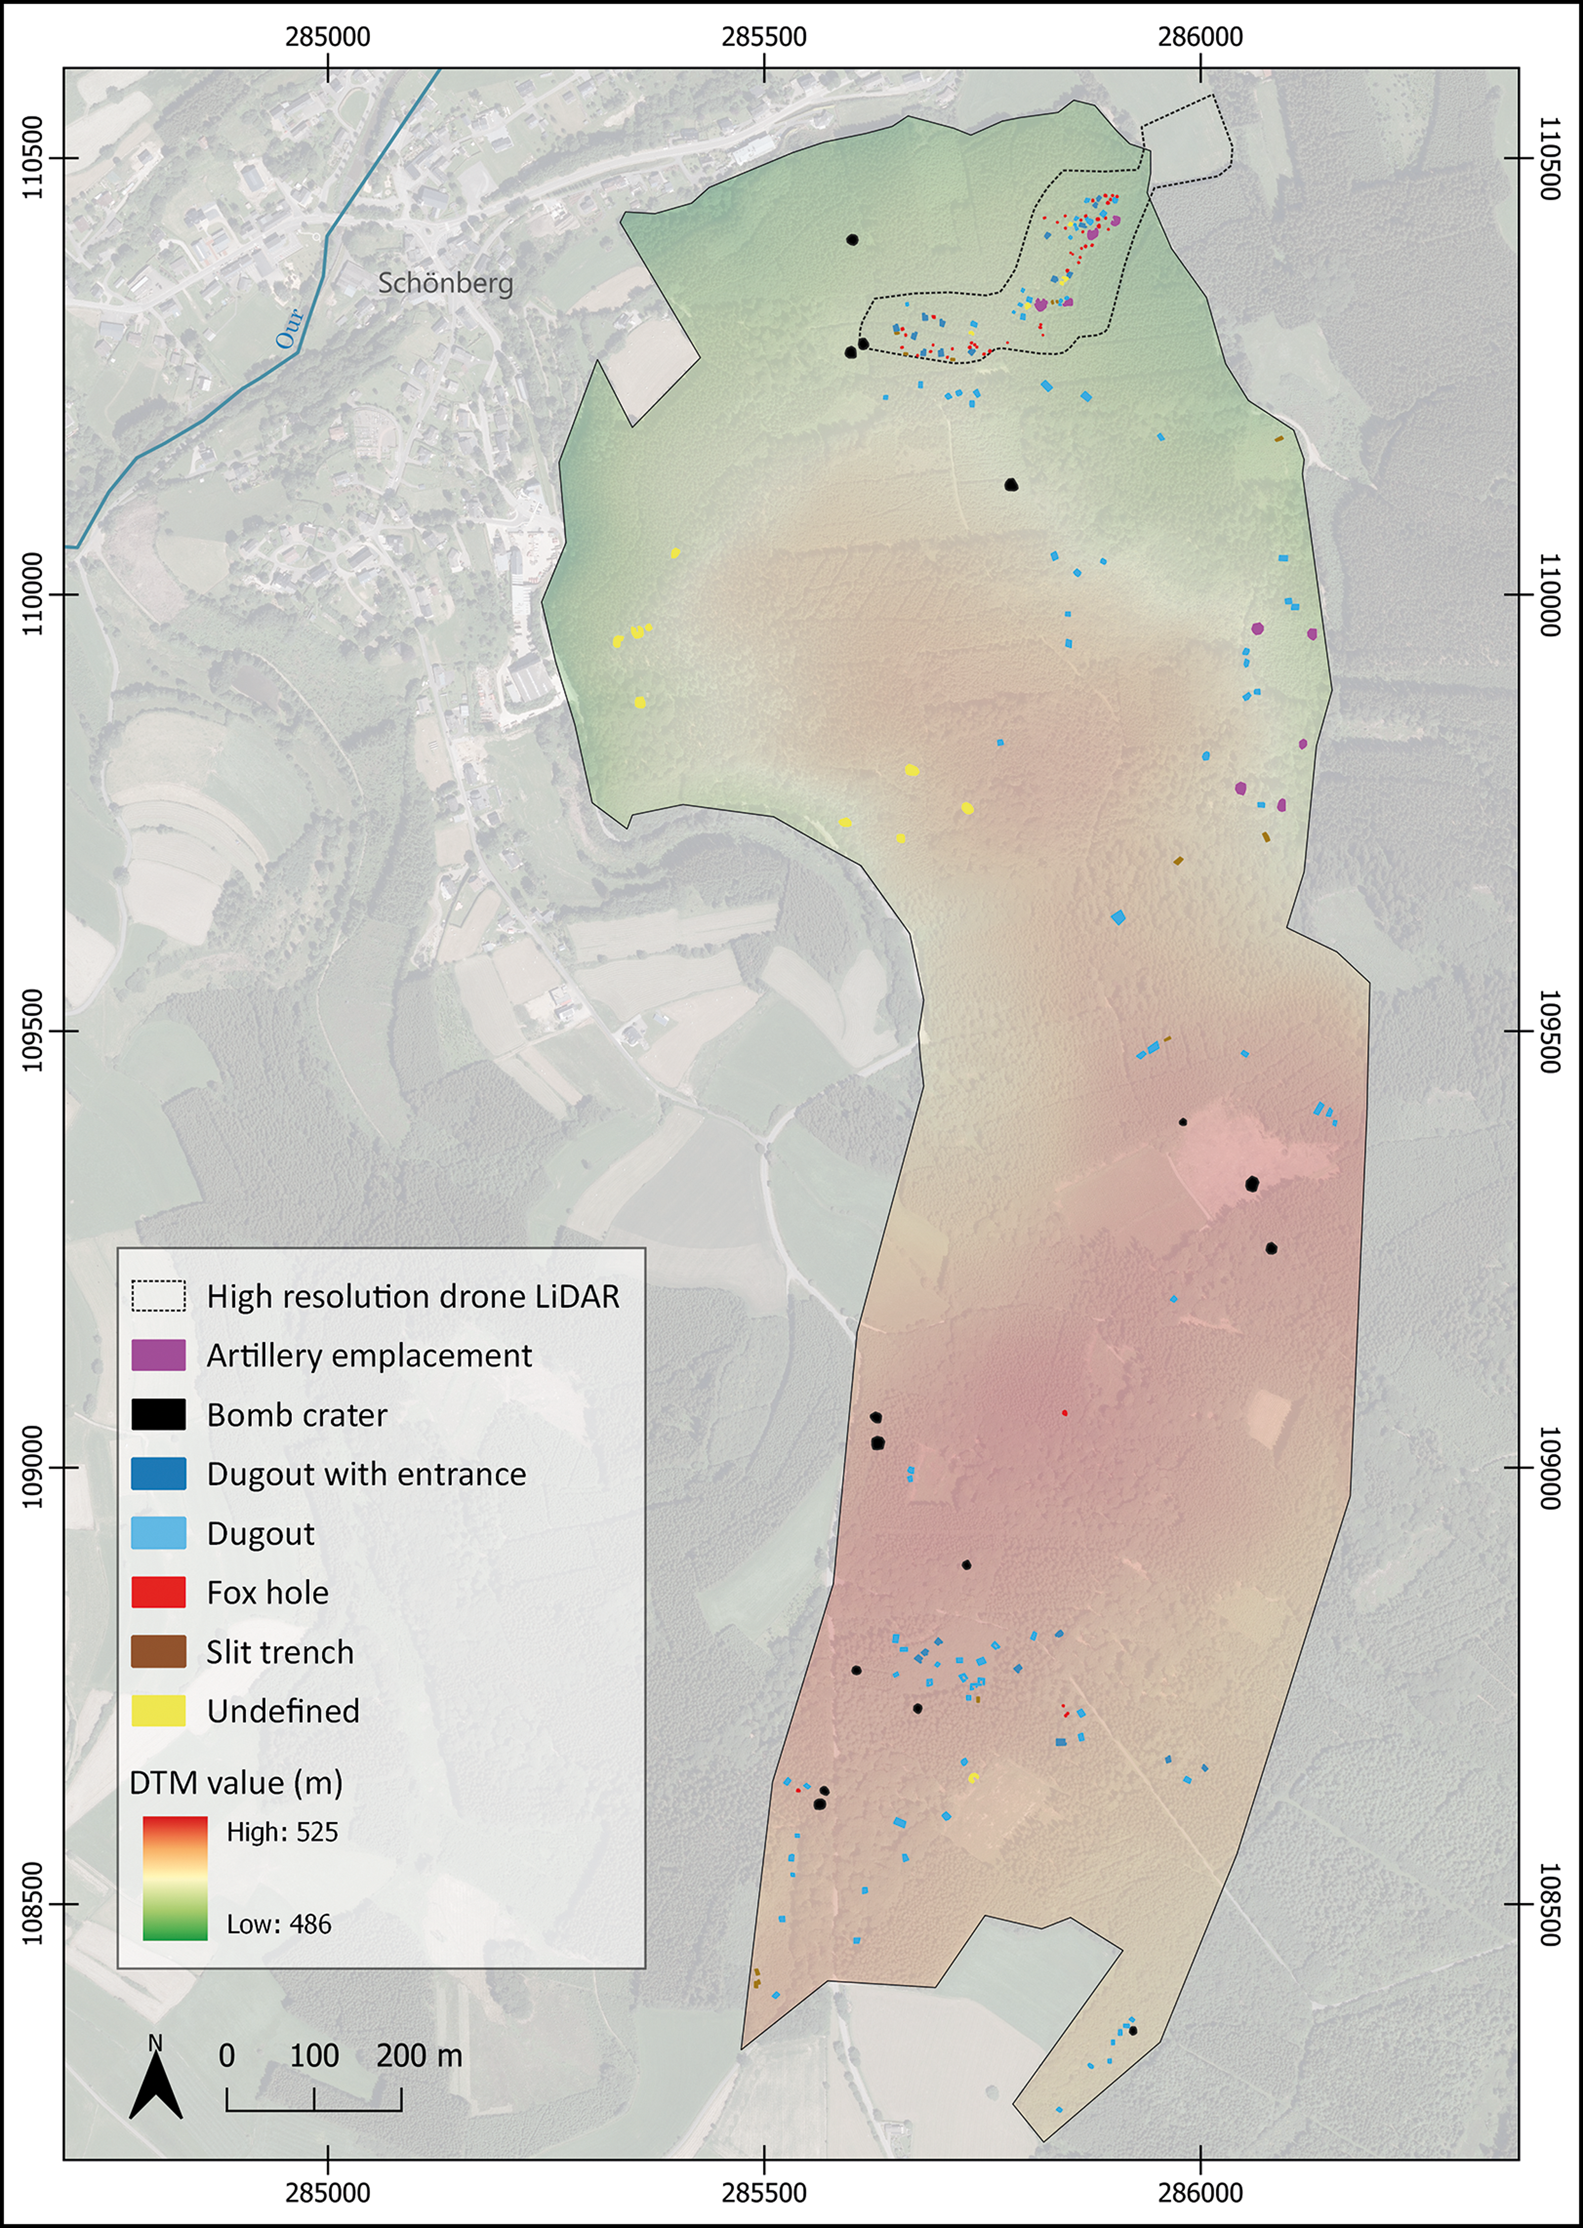
Figure 7. Interpretative map of the Lindscheid area (orthophoto: Open Data WalOnMap).
A purely technical comparison between the datasets is not appropriate here because not all metadata were available and we had access to just the raw recording data (OSM Table S1). The main point of this comparison is not to reiterate that higher-resolution data reveal more, and in particular more subtle, traces, but rather that comparison allows us to understand better the features that the 1m data reveal while also showing some of the limitations. Consequently, we are then better able to make use of the 1m-resolution data for those parts of the larger study area for which it was impossible to obtain 15cm data.
With this in mind, the study area was expanded a second time to an area of 13 × 10km to encompass the broader St Vith-Schönberg-Bleialf landscape. This resulted in the identification of 941 additional features and zones with many surface features (Figure 8), some of which were visited and confirmed in the field. With the exception of bomb craters, these features were exclusively located in forests, particularly near the perimeters, possibly because of tactical considerations. The number of identified features is undoubtedly an underestimate since many smaller features, such as slit trenches and fox holes, will have remained undetected by the 1m-resolution LiDAR coverage, and can only be identified with additional field surveys. We must also be careful not to generalise too much from the location and clustering as we can only see traces of what has actually been preserved in the woods. Moreover, the few contemporary aerial photographs available show that open ground was also used extensively for the construction of field fortifications.
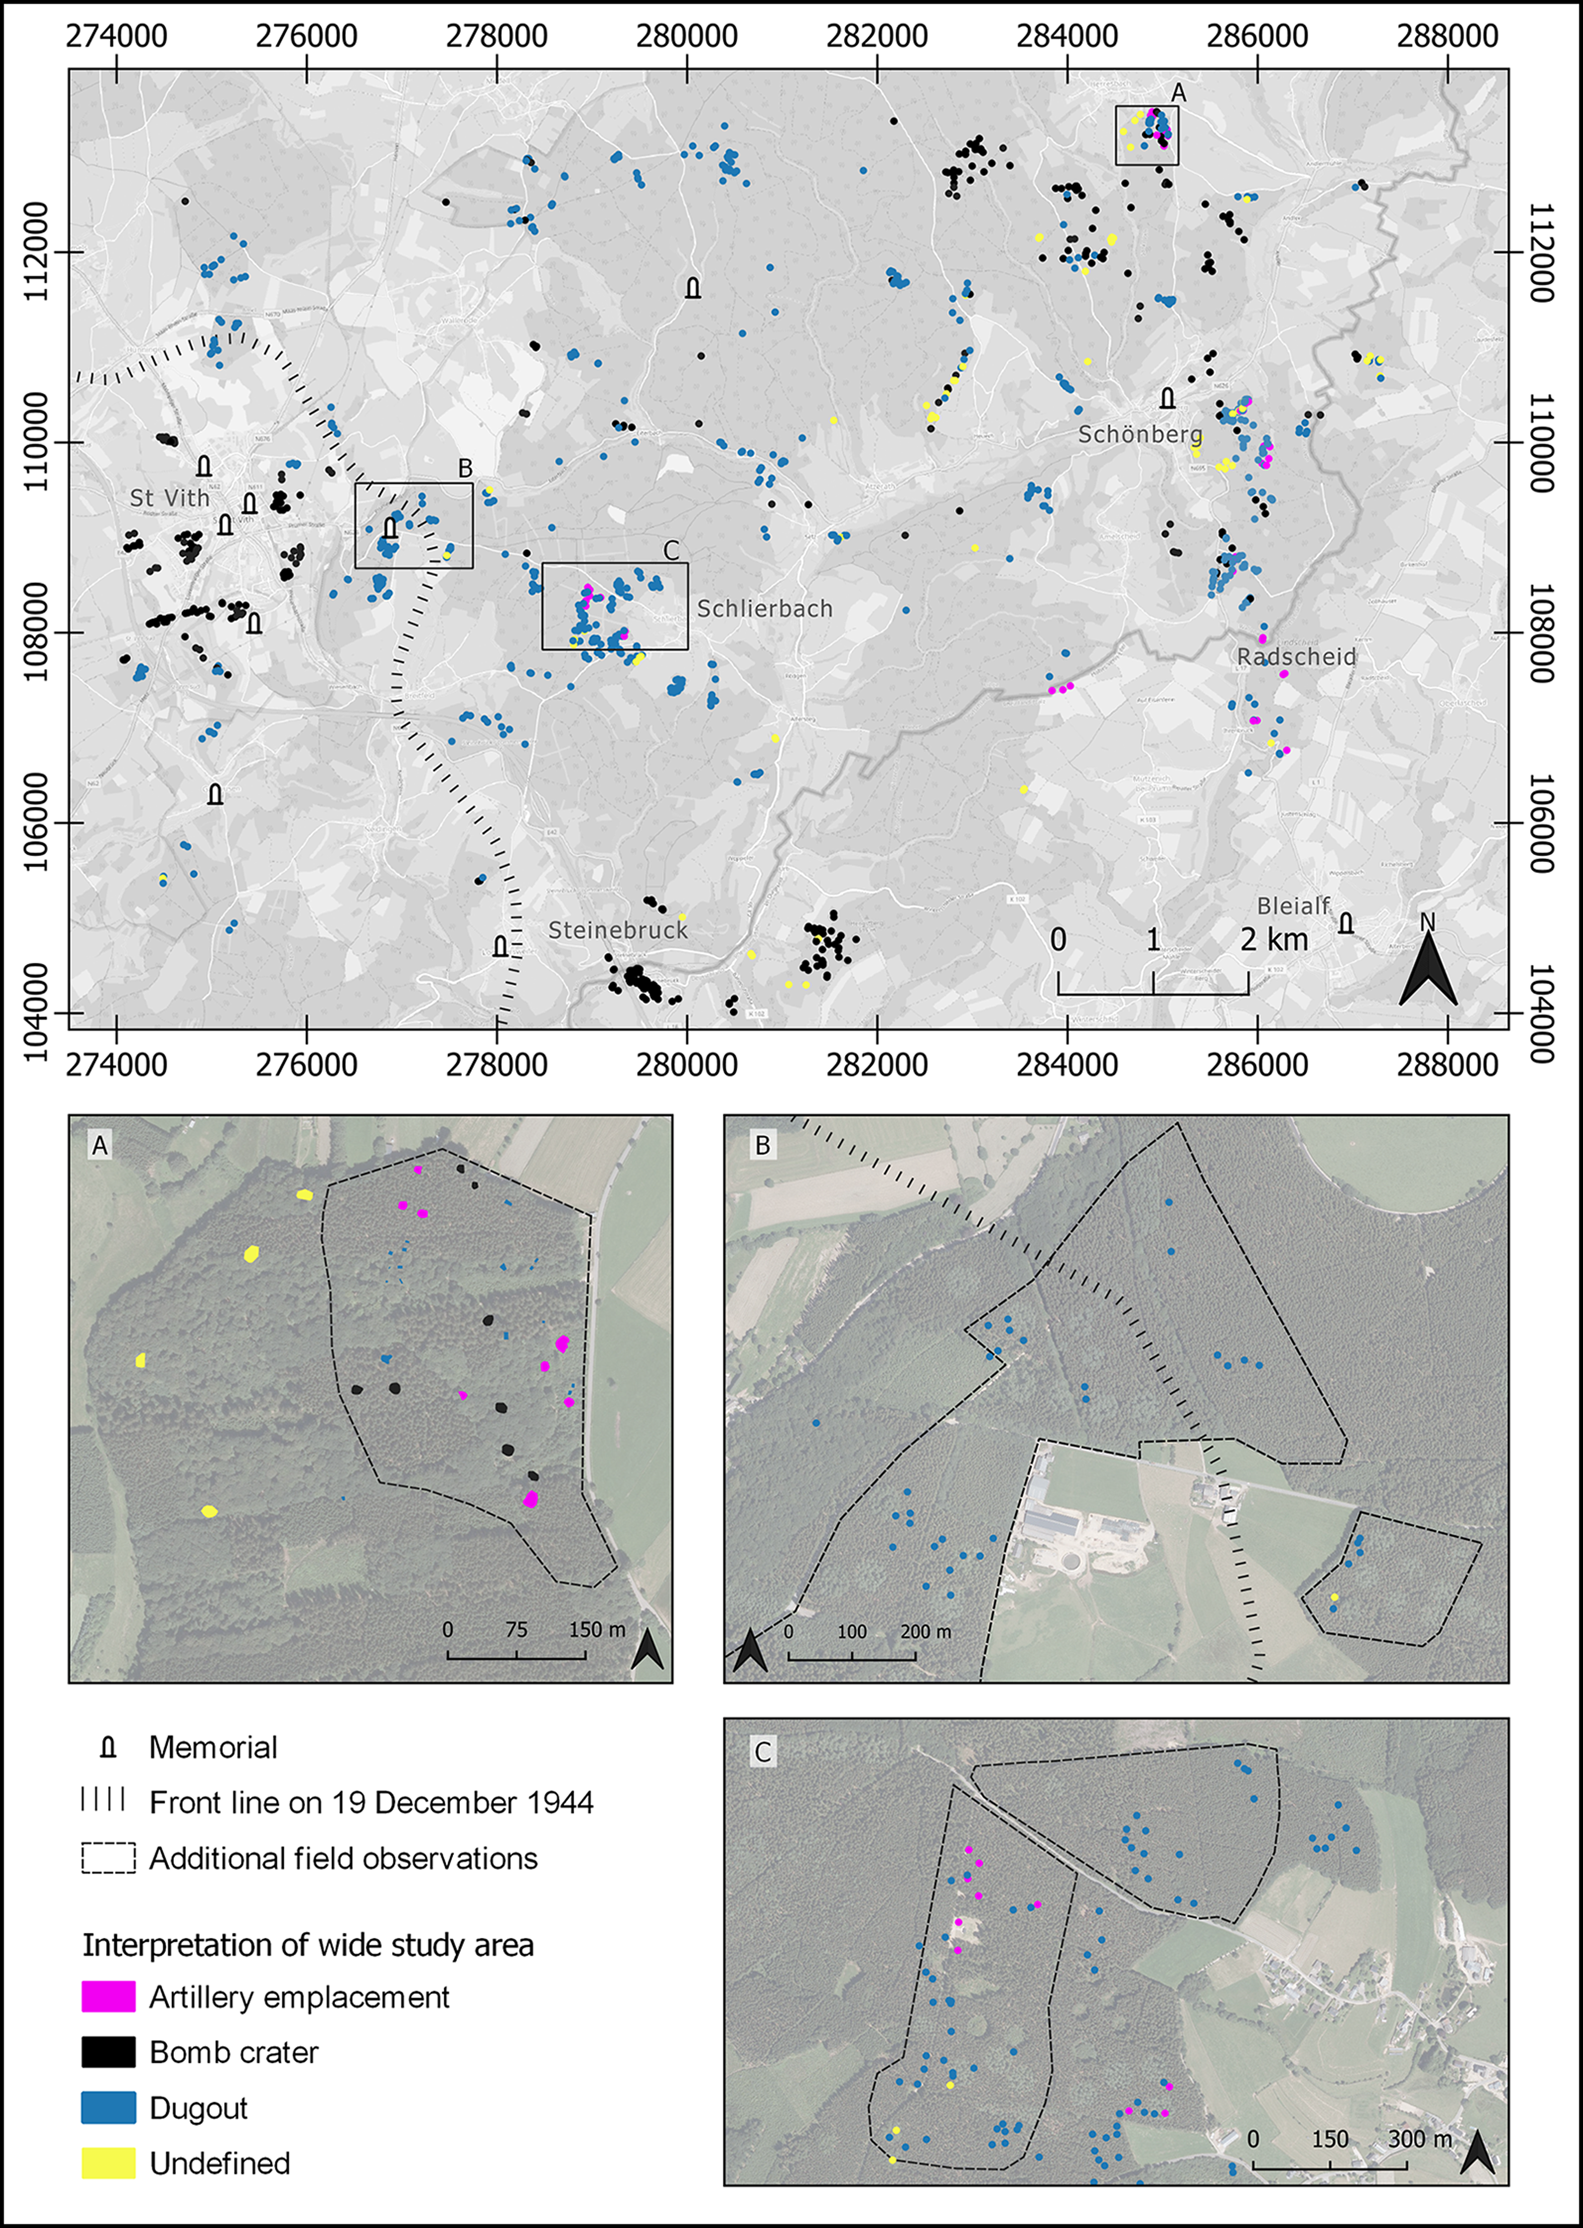
Figure 8. Extent of the study area with 1m-resolution mapped features, with detail of the areas of Herresbach (A); Prümerberg (B); and Schlierbach (C) (base layer: OpenStreetMap; orthophoto: Open Data WalOnMap).
Looking at the clusters and how they interact with each other across the wider area allows us to identify three distinct phases, with archaeological traces reflecting the course of the battle. Each phase is represented by a different type of remains. The first phase took place before the offensive, during which a stable front line was maintained (September to December 1944). During this phase, US field artillery battalions were positioned a few kilometres west of the front line (Figures 7 & 8A). In the area of Radscheid, 3km north of Bleialf, a US aerial reconnaissance photograph (US31-4166-5182) shows that at least three artillery battery positions were established in open fields; these features have subsequently been erased by post-war agriculture. In contrast, our survey identified, and confirmed through the collection of surface finds such as artillery fuses, extant artillery emplacements further west in woodland near Schlierbach (Figure 8C); these features may be attributed to the pre-offensive phase (or, perhaps, to the final phase; see below). Figure 8 shows numerous smaller field fortifications across the wider study area. Many of these form clusters and are likely to include various rear-area logistical and other support facilities established before the German advance.
The second phase refers to the start of the German offensive, from 16 December 1944 until the German capture of St Vith on 21 December. Following the retreat of the artillery and infantry units, along with the encircling and surrender of the US 106th Division near Schönberg, the Germans reached the neighbourhood of St Vith on 17 December. A defensive line was established 1.5km east of St Vith, on the high ground at Prümerberg (Figure 8B) by a force comprising mainly of the US 168th Engineer Combat Battalion (Whiting Reference Whiting1969; Tolhurst Reference Tolhurst1999). Surviving field fortifications in one part of this blocking position were first described in Passmore and Harrison's (Reference Passmore and Harrison2008: 94) pilot study. We can now see those fortifications in the context of a wider array of features located in the northern and eastern perimeter defences of St Vith (Figure 8). LiDAR analysis at Prümerberg also reveals potential evidence of German field fortifications established just within the woodland edge and facing the US line across a 500m-stretch of open ground (Figure 8B). These fortifications appear to be less well-defined than those of the US position and are perhaps consistent with temporary features dug by advancing German forces as they tried to breach the perimeter defences.
In general, it is doubtful that the full range of German field fortifications can be reliably identified by 1m-resolution LiDAR data since many will be relatively small features and, with the exception of the temporary stalling of the advance, demands to maintain the speed of the offensive will have precluded the building of larger and more fixed positions. Furthermore, it seems probable that the Germans took advantage of abandoned American positions. Near Schlierbach, for example, German surface finds were located during our field observations of US artillery emplacements; such finds reinforce the importance of conducting ground surveys to complement LiDAR-based mapping and interpretation projects.
The third and final phase is indicative of the turning point in the offensive. The numerous extant bomb craters across the wider study area indicate that the Allied air forces were able to establish tactical dominance once the weather improved, as it did from 23 December. While we cannot exclude the possibility that some features date back to earlier Allied advances towards the border areas, clusters of craters in the area of St Vith, Steinebrück and the roads running parallel to the River Our are probably associated with the bombing of bridging points, roads and road junctions to intercept German forces and disrupt their supply routes. The identification of field fortifications dating to this phase remains a challenge that is further complicated by the reuse of older positions. It is possible that the artillery positions visible west of Schlierbach (Figure 8C) could also be linked to the liberation of Schlierbach and Schönberg at the end of January 1945.
Our results, documenting many different types of remains and several well-defined clusters, markedly increases knowledge about the conflict that played out across this landscape. Despite the scale and significance of the Battle of the Bulge, and the many historical accounts of it (e.g. Caddick-Adams Reference Caddick-Adams2015), to date, archaeological evidence related to these events has not been integrated into the official records of sites and monuments in this region. Conversely, at each site we visited in the field, we observed traces of pits dug by metal-detectorists and discarded archaeological materials, which indicates detailed local knowledge about the material remains of the conflict.
For visitors and battlefield tourists, the memorialised conflict landscapes of the Second World War are widespread. In our study area, several memorials and information panels commemorate the defence and capture of St Vith, its destruction by aerial bombardment and the civilian casualties. These include a memorial, erected in 2019, to the US 106th Division and the events of December 1944, which was unveiled in the presence of veterans and their families. Yet, with the exception of the Prümersberg site, the archaeological remains of the conflict are almost entirely spatially disconnected from the location of these memorials.
Conclusions and prospects
Our study of the landscape and material remains of the Battle of the Bulge through the lens of very-high- and low-resolution LiDAR data has identified a rich archaeological landscape associated with US Army defensive lines and both ground combat and aerial bombing in late 1944 and early 1945 in the central sector of the Ardennes Offensive. Our 15cm-resolution LiDAR survey has revealed an artillery battery with four-gun emplacements and numerous dugouts, probably constructed during a quiet period between October and December 1944. A number of smaller features (fox holes and slit trenches) are possibly associated with heavy fighting during the opening phase of the Ardennes Offensive.
Application of the SLAM method in combination with a drone has yielded very-high-resolution data, collected over a brief period of time and without requiring additional high-precision measuring equipment. The main limitations of SLAM are that its application targets a limited area and that it is legally required to maintain a line of sight when operating the drone. Although the method has already been used for forestry purposes (Gollob et al. Reference Gollob, Ritter and Nothdurft2020) and for scanning indoor architectural features (Oniga et al. Reference Oniga, Breaban, Alexe and Văsii2021), to our knowledge, this is its first conflict archaeology application. Although such an approach is not suitable for surveying extensive landscapes, our detailed study and comparison has led to a better understanding of the potential and the shortcomings of low-resolution LiDAR that is freely available for much larger areas. On the broader landscape scale, 1m-resolution LiDAR data have also yielded widespread evidence, with at least 1152 discrete features—including those detected by the high-resolution LiDAR—identified in the region around St Vith and Schönberg.
This new layer of information also contributes to heritage considerations around the Second World War landscapes of the Ardennes and complements (and could perhaps further inform) the existing collection of commemorative monuments. Our results indicate that the combination of heavily wooded landscapes and the complexity and large scale of the Ardennes Offensive offer great research potential at St Vith and elsewhere across the region's former battlefields, in Belgium and neighbouring Luxembourg and Germany. Our work also prompts debate on managing the region's heritage and the need for a more comprehensive archaeological survey and analysis of this important theatre of operations in north-western Europe. In a broader perspective, our case study makes clear that there is potential for enhancing public awareness of and access to some sites in the Ardennes, a region where battlefield tourism already plays an important role.
The features in Schönberg and Lindscheid, for example, are located in a public forest and close to established walking routes. Interpretative trails in this area could give a strong sense of place and contribute to a more authentic visitor experience. Such an approach has already been successfully implemented for the nearby Huertgenwald battlefield in Germany (Passmore et al. Reference Passmore, Harrison and Capps-Tunwell2014) and on First World War sites using mobile visitor applications in combination with historical remote-sensing data (Stichelbaut et al. Reference Stichelbaut, Plets and Reeves2021a). Although making such vulnerable sites accessible may attract illegal metal-detectorists or re-enactors (Adam et al. Reference Adam, Storch and Rass2022: 495–96), the recognition and designation of these traces of war as heritage sites could help guarantee their long-term protection from destructive practices, including the mechanised clearfelling of forest, as has already affected parts of the Prümerberg battlefield east of St Vith (Passmore & Harrison Reference Passmore and Harrison2008: 94).
The importance of these battlefield sites is better appreciated by seeing them in a broader context. In this respect, we can think of these landscapes as ‘the last witnesses’ of particular conflicts (Chielens et al. Reference Chielens, Dendooven and Decoodt2006). Discussing the First World War (1914–1918), Chielens et al. noted that, at the time of writing in 2006, the last generations of people with first-hand experience of that conflict had all but passed away; simultaneously, archaeologists were intensifying their focus on the physical remains of that war as tangible testimony of the conflict. Now, more than 15 years later, the same scenario is playing out in relation to the conflict landscapes of the Second World War.
Acknowledgements
Parts of this work were funded by a long-term collaboration between Ghent University, the In Flanders Fields Museum and the Province of West Flanders in Belgium. The Schönberg site and the LiDAR drone were featured in the documentary ‘WWII by Drone: The Battle of the Bulge’ made for the Smithsonian Channel.
Supplementary material
To view supplementary material for this article, please visit https://doi.org/10.15184/aqy.2023.95.


