


Introduction
Management interventions, such as the provision of artificial nest sites, can be an effective procedure in the conservation of endangered avian species (Cade and Temple Reference Cade and Temple1995). Artificial nest sites can benefit populations when nest sites are limiting or if they increase breeding productivity (Fargallo et al. Reference Fargallo, Blanco, Potti and Viñuela2001; McClure et al. Reference McClure, Pauli and Heath2017). Breeding performance, in terms of offspring production and survival, has important consequences for long-term animal population dynamics (Newton Reference Newton1998), and data on factors influencing vital rates are needed to determine the most effective management actions (Frederiksen et al. Reference Frederiksen, Lebreton, Pradel, Choquet and Gimenez2014).
The Saker Falcon Falco cherrug (hereafter saker) is classified by International Union for Conservation of Nature (IUCN) as “Endangered” due to rapid and significant population declines attributed mainly to anthropogenic causes, including unregulated harvest for falconry (BirdLife 2021). However, the Mongolian breeding population is widespread and apparently stable, despite high electrocution mortality rates, primarily buffered by a large non-breeding population that has access to a limited amount of nest sites (Dixon et al. Reference Dixon, Batbayar, Bold, Davaasuren, Erdenechimeg and Galtbalt2020). Furthermore, genomic analysis has provided an effective population size estimate for the period up to c.4,000 years ago, indicating a breeding population of 7,614–9,984 pairs (Hu et al. Reference Hu, Long, Lin, Gu, Su and Dong2022), which is likely to be comparable in the present-day for a species with a breeding population limited by natural nest-site availability. The Mongolian government permits a harvest and international trade in wild-caught sakers, primarily for the Arabian falconry market, which was limited to 300 birds per annum up to 2010, following a Convention on International Trade in Endangered Species of Wild Fauna and Flora (CITES) Review of Significant Trade (Dixon Reference Dixon and Angelici2016). Mongolia now sets its own annual harvest quota but to our knowledge this information is not publicly available, although the United Nations Environment Programme World Conservation Monitoring Centre (UNEP-WCM)-CITES trade database records that in the nine years from 2013 to 2021, 918 sakers were exported to Gulf States, with numbers ranging from 15 to 414 per year (0 in 2020; https://trade.cites.org/ available 17 July 2023). For the Mongolian saker population, artificial nest sites can facilitate monitoring of vital rates for modelling whether harvest quotas are sustainable (Rahman et al. Reference Rahman, Purev-Ochir, Etheridge, Batbayar and Dixon2014).
Climate and food availability can influence interrelated elements of avian breeding performance such as breeding density, laying date, clutch size, and offspring survival (Newton Reference Newton1998; Stevenson and Bryant Reference Stevenson and Bryant2000; Carey Reference Carey2009). Vegetation cover in rangeland ecosystems can both reflect climatic conditions and influence populations of herbivorous small mammals (Lu et al. Reference Lu, Zhao, Wu, Dai and Gao2019; Bai et al. Reference Bai, Wan, Li, Wan, Guo and Shi2022), while the activities of small mammals, through grazing and burrowing, can affect vegetation cover (Cui et al. Reference Cui, Xie, Hua, Yang, Yin and Wei2020). The Normalised Difference Vegetation Index (NDVI) utilises remotely sensed data to measure vegetation cover, and it can be used as a proxy for small mammal abundance in grasslands (Smith et al. Reference Smith, Steenhof, McClure and Heath2016). In Mongolia, sakers feed predominantly on small mammals (Gombobaatar et al. Reference Gombobaatar, Uuganbayar, Sumiya, Potapov and Fox2006), which can vary in abundance both spatially and temporally (e.g. Zhang et al. Reference Zhang, Pech, Davis, Shi, Wan and Zhong2003). In falcons that prey on small mammals with highly variable populations, reproductive success covaries with survival (Fay et al. Reference Fay, Michler, Laesser, Jeanmonod and Schaub2020), and food availability also influences other vital rates like recruitment and adult breeding probability (Ezard et al. Reference Ezard, Becker and Coulson2006; Laaksonen et al. Reference Laaksonen, Lyytinen and Korpimäki2004).
In this study, we established 5,000 artificial nests and monitored their occupancy by sakers and the resulting productivity in Mongolia. We further examined the influence of climate, vegetation cover, and food supply on breeding performance and discuss this in the context of a management plan dedicated to a harvested population.
Methods
Trade of the saker in Mongolia
The saker is a large falcon within the subgenus Hierofalco, with a breeding range across central Eurasia where it primarily occupies open landscapes characterised by agricultural, grassland, and semi-desert habitats (Orta et al. Reference Orta, Boesman, Sharpe, Marks, del Hoyo, Elliott, Sargatal, Christie and de Juana2020). As an “Endangered” raptor that is widely used in falconry, the conservation value of the species embraces biodiversity, utilitarian/ecosystem services, and cultural values (Pearson Reference Pearson2016). In Mongolia, a commercial harvest and trade in sakers was overseen by the government until 2012, under a permitted quota of 300 birds per annum endorsed by CITES, but which has since been replaced by an opaque governmental “diplomatic” harvest and trade (Dixon Reference Dixon and Angelici2016). The establishment of 5,000 artificial nests described in this study was the basis for CITES to endorse the positive management regime for Saker Falcon in Mongolia during its Review of Significant Trade at the 25th meeting of the Animals Committee (Geneva, Switzerland, 18–22 July 2011; AC25 Doc. 9.7). Furthermore, the CITES permitted harvest resulted in the Mongolian saker population being excluded from Appendix I listing for the Convention of Migratory Species (CMS), an exemption that was predicated on the formulation of a CMS Saker Falcon Global Action Plan (SakerGAP) and the development of an evidence-based adaptive management framework for the sustainable management of the species (Kovacs et al. Reference Kovács, Williams and Galbraith2014).
Study area
Our study area is located in central Mongolia, within the boundaries of longitude 104.8–114.4ºE and latitude 45.4–47.5ºN (Figure 1). This area is characterised by extensive, flat or rolling plains with scattered blocks of hilly country dominated by steppe habitats. The annual mean air temperature during 1970–2000 in this area was 0.7±0.9ºC, with 17.9 ± 1.0ºC in summer (June–September) and -11.4 ± 0.8ºC in winter (December–February). Annual precipitation was 195 ± 36 mm and decreased from north to south. About 93% of total precipitation falls during April to September, of which about 61% falls in July and August. This area has an average depth of snow cover of 2–5 cm during December to March, and the number of days in which snow cover is present is about 50–150 days (Dagvadorj et al. Reference Dagvadorj, Natsagdorj, Dorjpurev and Namkhainyam2009).

Figure 1. The location of 5,000 artificial nests erected in central Mongolia, and an example of an artificial nest occupied by Saker Falcons.
Reproductive rate monitoring in artificial nests
The whole area was surveyed in May 2009 prior to erecting artificial nests. Sakers require stick nests in elevated positions and although they will use nests on various human artefacts, including power poles and buildings, they rarely nest on the ground (Ellis et al. Reference Ellis, Ellis and Tsengeg1997; Potapov et al. Reference Potapov, Fox, Sumya, Gombobaatar and Shagdarsuren2001). In 2009–2010 5,000 artificial nests were erected, with 250 nests allocated to each of 20 districts across five provinces (encompassed within a total area of c.130,000 km2), with the placement area determined by the absence of alternative natural nests sites and consultation with district representatives, resulting in 31 grids of nests across central Mongolia covering a total area of 9,363 km2, each with nest-spacing intervals of 1.5 km (Figure 1). Artificial nests comprised 60-cm diameter metal barrels with a side entrance erected on metal poles at a height of 2.5 m (Rahman et al. Reference Rahman, Purev-Ochir, Batbayar and Dixon2016) (Figure 1). Over the five-year monitoring period (2011–2015), sakers exhibited a high degree of nest-site fidelity and limited breeding dispersal, normally occupying the same nest or neighbouring nests 1.5–3.4 km away in successive years, with an average breeding dispersal of 0.99 ± 0.13 km (Hou et al. Reference Hou, Xu, Lin, D’urban-Jackson, Dixon and Bold2018).
Monitoring of artificial nests was undertaken from late March or early April, and ended in July each year from 2011 to 2015. Occupied nests, with an adult bird or at least one egg present on the initial visit, were visited at about two-week intervals to record the contents and growth status of chicks. From the nest-monitoring data, we established a chronology for each nest, where the first egg date (FED), unless directly observed as one egg in the nest, was estimated by back-dating from chick ages, assuming eggs were laid on alternate days and incubation lasted 35 days from the penultimate egg (Rahman et al. Reference Rahman, Purev-Ochir, Etheridge, Batbayar and Dixon2014). Chick age was estimated by reference to a photographic chart illustrating 14 stages of growth development for a captive-bred saker chick at three-day intervals from 1–42 days old (see Supplementary material Appendix 1). Most broods exhibited synchronous development rates, but where there was asynchrony, age was estimated for the nestling with the most advanced development. Broods that were not observed to have fledged were assumed to have successfully fledged if they were at least 30 days old on the last nest visit, otherwise, when they were younger, the nest outcome was recorded as unknown. Previous work on sakers breeding at artificial nests in Mongolia indicated that chick mortality after 30 days was very rare with no chicks that were at least 30 days old recorded to have died before fledging (N = 126 nestlings) (Rahman et al. Reference Rahman, Purev-Ochir, Etheridge, Batbayar and Dixon2014).
Environmental factors
Climate
Monthly temperature and precipitation data with a spatial resolution of 2.5 minutes (~21 km2) (Harris et al. Reference Harris, Jones, Osborn and Lister2014) from 2010 to 2015 were download from WorldClim 2.1 (Fick and Hijmans Reference Fick and Hijmans2017). The climate variables of each artificial nest grid were obtained using the average of all the nest sites in each grid. Note that we aggregated all environmental variables at the grid level rather than at the nest level because: (1) the home range of sakers (5–18,469 km2 in winter and 513–5,297 km2 in the breeding period from 1 March to 31 July) is much larger than the nest-spacing intervals of 1.5 km (Dixon et al. Reference Dixon, Li, Rahman, Batbayar and Zhan2017; Prommer et al. Reference Prommer, Bagyura, Váczi and Fehérvári2018), thus their breeding performance is more likely to be affected by environmental conditions at the grid level than at the nest level; (2) the low resolution of data impedes the differentiation of environmental conditions among nest sites at the same cell of data, whereas it magnifies the difference between the two adjacent nest sites located in different cells; (3) analyses conducted at the grid level can effectively avoid severe spatial autocorrelation at the nest level.
We used monthly percentage snow cover (0–100%, with a resolution of ~5 km). Snow cover data was downloaded from 2010 to 2015 from the National Snow and Ice Data Center (NSIDC) at https://nsidc.org/, available at 19 September 2022). Snow cover in the previous winter was calculated as the average of monthly values from 01 November in the previous year to 31 March in the current breeding season.
The candidate climate variables included: (1) average monthly temperature and sum of monthly precipitation during the pre-breeding stage (T 23 and P 23), laying stage (T 34 and P 34), incubation and nestling stage (T 46 and P 46), and the whole nesting season (T 36 and P 36); (2) average monthly temperature and sum of monthly precipitation in the previous winter (T w and P w; 01 November–31 March); (3) the interactions between temperature and precipitation (T xy : P xy), which is likely to influence the climatic sensitivity of vegetation phenology (Du et al. Reference Du, He, Piatek, Chen, Lin and Zhu2019) and breeding performance (Coppes et al. Reference Coppes, Kämmerle, Schroth, Braunisch and Suchant2021); (4) snow cover.
NDVI
We used NDVI remote-sensing data with high spatiotemporal resolution to infer vegetation cover around the nest sites; NDVI has been validated as a reliable proxy for vegetation growth in Mongolian grasslands (Nakano et al. Reference Nakano, Bavuudorj, Urianhai and Shinoda2013). NDVI data from 2010 to 2015 with a resolution of 500 m were downloaded from the US Geological Survey (https://lpdaac.usgs.gov, available at 19 September 2022). The maximum NDVI value of the two images during a given month for each pixel was assigned as the monthly value to reduce residual atmospheric and bidirectional effects (Piao et al. Reference Piao, Mohammat, Fang, Cai and Feng2006). Since our artificial nests were erected at 1.5-km intervals, we resampled these monthly NDVI data to a resolution of 1.5 km, and used the averaged value of all the nest sites as the NDVI of each artificial nest grid. A set of NDVI-deduced variables was prepared: (1) monthly NDVI from the previous April–June in the current year (i.e. from NDVIp4 to NDVI6); (2) mean NDVI during the vegetation growth season in the previous year (from April–August, NDVIp48), to examine the potential lag effect of vegetation production on prey abundance; here, we focus on those months from April to August because they cover the whole breeding season of sakers and the monthly temperature began to rise above 0 in April; (3) annual NDVI of a previous year, using the average NDVI from April to October in a previous year (NDVIpy); (4) change of NDVI in a previous year, using the difference between the annual NDVI in a previous year and the average from 2011 to 2015 (ΔNDVIp).
Prey frequency in the saker’s diet
Saker pellets were collected from May to July 2012 (n = 2,060 pellets from 323 nests) across the artificial nest grids, with 55% nests repeatedly sampled two or three times. For each pellet, the minimum number of prey individuals (n bmd) was determined from undigested body parts from each of the following colonial small mammal species: Brandt’s vole (Lasiopodomys brandti), Mongolian gerbil (Meriones unguiculatus), and Daurian pika (Ochotona dauurica), these species being the main small mammal prey of sakers in Mongolia (Gombobaatar et al. Reference Gombobaatar, Uuganbayar, Sumiya, Potapov and Fox2006). We firstly calculated the relative abundance of small mammal prey (RA i) for each nest sample (i) using nbmd,i divided by the number of pellets in each nest sample (n pellet,i ). This is effectively a measure of the frequency of small mammal species in the diet, which is the product of prey availability and the functional response of sakers. Finally, we calculated the Small Mammal Index (SMI) as a proxy measure of prey availability within each artificial nest grid during the breeding season using the average RA for all the nest samples within the same grid.
Statistical analysis
We explored the effects of climate on saker reproduction using generalised linear mixed-effects models (GLMMs) (Bolker et al. Reference Bolker, Brooks, Clark, Geange, Poulsen and Stevens2009). In our study, five breeding indices were used as response variables, including breeding density (BD), the percentage of artificial nests occupied by sakers in a grid, FED, clutch size (CS), fledged brood size at successful nests (FS), only those nests with at least one chick fledged were included, and nest survival (NS) during the laying, incubation, and nestling period. For our statistical analyses we used artificial nest grids as the basic unit of measure for each of our breeding indices. We used the average value of all nests in each grid for FED, CS, and FS. For NS, we firstly calculated the daily survival rate (DSR) by using the nest survival model in MARK 9.0 (White and Burnham Reference White and Burnham1999; Dinsmore et al. Reference Dinsmore, White and Knopf2002). Then we calculated NS by raising DSR to the power of the typical nesting period in days, i.e. 83 days, comprising 39 days for modal clutch of four eggs to be laid and hatched plus 44 days for chicks to fledge (following Rahman et al. Reference Rahman, Purev-Ochir, Etheridge, Batbayar and Dixon2014). The estimate of annual fledgling productivity was the product of the number of observed nesting attempts across all the artificial nests, the probability of nest survival for the whole study area calculated by MARK, and the mean number of observed fledglings produced at all the successful nests.
The number of pairs that initially settle to breed at the artificial nest grids is dependent on the availability of recruits in the local non-breeding population. Breeding sakers are philopatric, thus in addition to returning breeders, there are also new immigrants recruited from the local non-breeding population in the second year. This process of incremental population growth continues each year until an upper limit of breeding density is reached, which is determined by environmental factors, for example, prey availability. We used annual occupancy data from two additional experimental grids, Bayan E (150 nests) and Darhan E (100 nests), to illustrate the colonisation pattern (Figure S1 in Appendix 2). Darhan E was erected in 2005 with first breeding in 2006, and Bayan E was erected in 2006 with first breeding in 2007. Occupancy data were collected continuously until 2016. From these data, we estimated that breeding density reached a roughly constant level after three years (Table S1 in Appendix 2). Consequently, we restricted our analysis to data from 2013 to 2015, assuming that colonisation of the artificial nests was more or less complete by the third year. Moreover, we used year and artificial nest grid as random intercept factors in all the models to control for temporal and spatial clustering.
Besides environmental variables, we also included FED, BD, and CS as biotic predictors in the modelling of environmental effects on FS and NS, because nestlings raised earlier in the season may be in better physiological condition and more likely to fledge successfully, while intraspecific competition among breeding adults or siblings may affect fledging success (Darío et al. Reference Darío, Wilson, Sandra, Kelly, Barry and John2018; Kalinski et al. Reference Kalinski, Banbura, Gladalski, Markowski, Skwarska and Wawrzyniak2019). We also estimated the potential random effects caused among grids and years. The processing of variables and the analyses of models were performed using R Statistical Software (v4.1.3) (R Core Team Reference Team2022). To eliminate multicollinearity, we examined the pair-wise correlations among all the predictors using Hmisc package (v 4.6-0) (Harrell Reference Harrell2021), and deleted one of the two correlated variables (|r|>0.70), and retained the one that was biologically important for the response variables (Table 1). We then standardised all fixed variables to have zero mean and a standard deviation of 0.5 (hereafter “standardised”) before parameter estimation in order to make them comparable within models as recommended (Grueber et al. Reference Grueber, Nakagawa, Laws and Jamieson2011). In order to retrench the model, we ran these GLMMs as model iterations using the MuMIn package (v1.43.17) (Bartoń Reference Bartoń2020), respectively, and selected the top sub-models using Akaike information criterion corrected for sample size (AICc) to include those sub-models with the difference in AICc relative to the best model <4 (Burnham and Anderson Reference Burnham and Anderson2002). This step did not remove any variable from these models. In addition, to further address potential problems caused by spatial autocorrelation, we fitted spatial GLMMs with a Matérn correlation structure using the spaMM package (Rousset and Ferdy Reference Rousset and Ferdy2014). These models treated spatial correlation among grids as random effects and assumed that spatial autocorrelation among grids declines exponentially with distance (Table 1). The fixed effects were tested for significance using the function “anova”.
Table 1. Models for the five breeding indices of Saker falcons in central Mongolia.

a BD indicates breeding density during 2013–2015.
b FED, CS, FS, and NS indicate the first egg date, clutch size, fledged brood size, and nest survival rate during the whole nesting period. FED, BD and CS indicate the standardised data set of FED, BD, and CS, with zero mean and a standard deviation of 0.5.
c x and y indicate the longitude and latitude of the nest grids.
Furthermore, we also investigated the relationships between a proxy SMI and saker breeding performance and NDVI in 2012. In addition, we used a spatial GLMM to simulate the effects of climate variables on NDVI during the vegetation growth season, taking precipitation and temperature during the previous winter and those of the contemporary period into account (Table S2 in Appendix 3).
Results
Variation of breeding parameters
Over our study period, the number of breeding attempts at the artificial nests was 162, 342, 528, 719, and 559, with these pairs producing an estimated 365 ± 24, 1,126 ± 31, 1,737 ± 42, 2,205 ± 50, and 1,264 ± 49 fledglings in each year from 2011 to 2015, respectively. Some breeding attempts may not have been recorded if they failed before our first visit or were initiated and failed between visits, while some pairs laying replacement clutches after failure of the first clutch may be responsible for two nesting attempts. Overall, sakers in Mongolia started laying eggs from late March (earliest mean laying date = 27 March in 2014) to the first half of April (latest mean laying date = 12 April in 2011); mean FED = 02 April, with later clutches potentially including replacements for early nest failures (Figure 2a). The latest egg laying was in 2011, with smaller clutches and the lowest nest success, after which laying date advanced each year until 2014, but clutches were laid later in 2015. Clutch and fledged brood sizes increased from 2011 to 2014, but declined in 2015, while nest survival was higher in 2012 and 2013 (90% ± 2% and 87% ± 2%, respectively) than the other three years (Figure 2b).
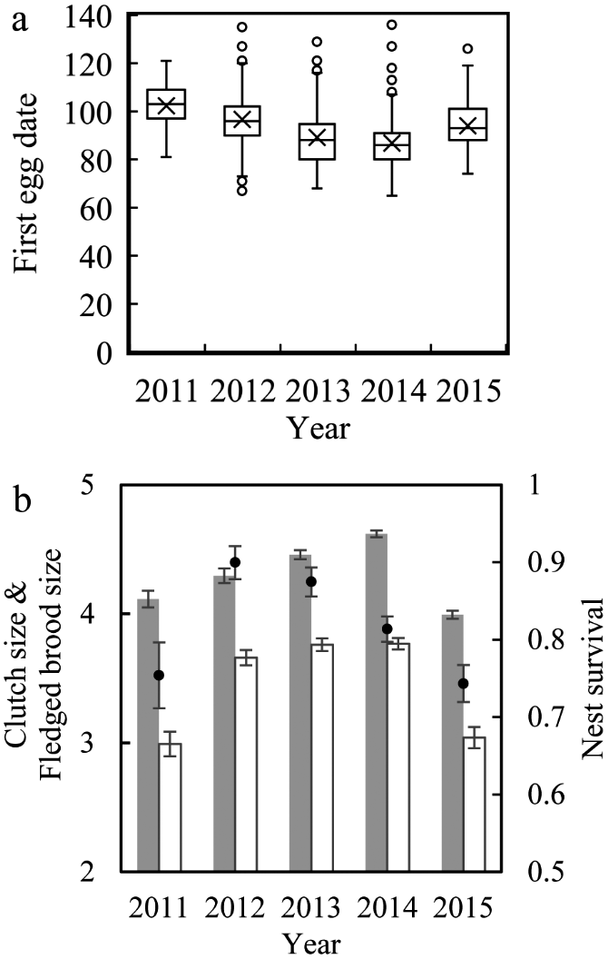
Figure 2. Dynamics of Saker Falcon breeding parameters in central Mongolia from 2011 to 2015. (a) Box plots show first egg date (1 = 01 January) with quartiles (horizontal line), outlier points (dot), and mean (cross). (b) Filled columns show mean clutch size with SE bars, open columns show fledged brood size at successful nests with SE, and points show mean nest survival rate with SE for each year.
Influence of environmental factors on breeding performance
Vegetation growth in the previous growing season (NDVIp48) was significantly correlated with saker breeding density (ß = 0.053 ± 0.016) and earlier laying date (ß = -3.069 ± 1.649) (Table 2). We found an interaction between temperature and precipitation during pre-breeding and egg-laying period (February and March ß = -3.444 ± -.606), with warmer, drier conditions resulting in earlier clutches. In addition, earlier laid clutches were larger than those laid later in the season. Temperature during the incubation and nestling period (April–June) had significant positive effects on fledged brood size at successful nests, with one unit of standardised temperature (about 2°C) warming corresponding to an incremental increase of 0.3 fledglings (Table 3, Figure 3). The interrelated factors of earlier, larger clutches were positively associated with fledged brood size and nest survival. Based on the above results, we constructed a relationship network of climate factors, NDVI, and breeding performance (Figure 3).
Table 2. Summary of modelling outputs from spaMM models for the influence of fixed variables on the breeding variables across grids of artificial nests in central Mongolia. NDVI = normalised difference vegetation index.

Table 3. Summary of modelling outputs from spaMM models for the influence of fixed variables on fledged brood size at successful nests and nest survival rates across artificial nests in central Mongolia. NDVI = normalised difference vegetation index.


Figure 3. Relationships among climate factors, NDVI, and breeding indices of Saker Falcons in Mongolia. Values indicate the estimated increase or decrease of breeding variables caused by one unit of standardised value of the former variables (P <0.05). When a variable was standardised, all the data were centred and standardised to have zero mean and a standard deviation of 0.5 (Grueber et al. Reference Grueber, Nakagawa, Laws and Jamieson2011). *The effect was marginally significant (P = 0.076). NDVI = normalised difference vegetation index.
SMI and breeding performance
Using the mean number of small mammal prey items in pellets as an index of their relative availability across our artificial nest grids in 2012 (i.e. SMI), we found that clutches were laid earlier when SMI increased, while breeding density, clutch size, and nest survival increased with SMI (Figure 4). However, although fledged brood sizes tended to increase with small mammal availability, the relationship was not significant. The relationship between vegetation growth in the previous growing season (NDVIp48) and SMI was positive but not significant.

Figure 4. Relationship between SMI and Saker Falcon breeding performance: (a) breeding density; (b) first egg date; (c) clutch size; (d) fledged brood size; (e) nest survival; (f) relationship between NDVI during the growing season in the previous year (NDVIp48) and SMI across grids of artificial nests in central Mongolia, 2012. NDVI = normalised difference vegetation Index; SMI = small mammal index.
Discussion
The provision of artificial nests in nest site-limited areas of the Mongolian steppe increased the breeding productivity of sakers. The number of sakers breeding in our study area prior to establishing the artificial nest grids was very small; we found only four saker nests in the flat open plains selected for placement of artificial nests, all of which were on structures associated with water wells. Apart from poles and pylons of electricity transmission and distribution lines that crossed open landscapes in our study region, where sakers bred at densities of 8–10 pairs/100 km (Dixon et al. Reference Dixon, Purev-Ochir, Galbalt and Batbayar2013), there were few potential nesting sites for the species. No saker nests were recorded on the small lengths of powerline that were within our grid areas. Following colonisation of the artificial nest grids, the mean annual study population of 602 pairs (range 528–719) produced an average of 1,735 fledged sakers per year (range 1,264–2,205) from 2013 to 2015. The provision of artificial nests also resulted in a large increase in the breeding population of other raptors that primarily feed on rodents, i.e. Upland Buzzard (Buteo hemilasius), Common Kestrel (Falco tinnunculus), and Common Raven (Corvus corax) (see Rahman et al. Reference Rahman, Purev-Ochir, Batbayar and Dixon2016). Having previously demonstrated that artificial nests can increase the range, size, and productivity of the saker breeding population, while nest design also influences occupancy rates and breeding productivity (Rahman et al. Reference Rahman, Purev-Ochir, Etheridge, Batbayar and Dixon2014, Reference Rahman, Purev-Ochir, Batbayar and Dixon2016), we have shown here that artificial nests can be deployed at landscape scale to create new breeding groups of sakers across large areas of nest site-limited habitat where few pairs existed previously. Artificial nests facilitate monitoring and the collation of demographic data on vital rates and population trends, which are required to parameterise adaptive harvest models (Dixon et al. Reference Dixon, Batbayar, Ochir, Fox, Watson, Cade, Fuller, Hunt and Potapov2011; US Fish and Wildlife Service 2021).
We found demographic parameters correlated significantly with environmental variables of temperature, precipitation, vegetation cover, and prey availability. The breeding density of sakers at the artificial nests was positively correlated with vegetation growth in the previous year as indicated by NDVI. NDVI has been used as a reliable proxy to predict seasonal changes in prey abundance of predators (Trierweiler et al. Reference Trierweiler, Mullie, Drent, Exo, Komdeur and Bairlein2013; Smith et al. Reference Smith, Steenhof, McClure and Heath2016), and closely correlates with vegetation productivity in grasslands, where it has been shown to be a useful indicator to predict habitat use by herbivorous and non-herbivorous mammals (Marston et al. Reference Marston, Armitage, Danson, Giraudoux, Ramirez, Craig, Schaepman, Liang, Groot and Kneubühler2007; Mueller et al. Reference Mueller, Olson, Fuller, Schaller, Murray and Leimgruber2007). Vegetation growth in the previous year may be associated with the availability of herbivorous prey species in the early spring, by increasing overwinter survival of small mammals dependent on vegetation food stores (Shi et al. Reference Shi, Hai, Jin and Liu1997; Wang et al. Reference Wang, Wang, Liu and Zhong2004; Jiang et al. Reference Jiang, Zhao, Liu, Xu, Yu and He2011), resulting in more sakers settling to breed at the artificial nests. Similarly, prey abundance mediated by vegetation growth in the previous year may explain earlier clutch initiation, which is further influenced by the interaction between precipitation (snowfall) and temperature in February and March, when warmer and drier conditions favoured earlier laying. Less snow cover potentially increases the availability of prey such as small mammals and wintering lark flocks for sakers in the pre-laying period.
Earlier egg laying resulted in larger clutches and fledged brood sizes, similar to results reported in studies of other species (Torti and Dunn Reference Torti and Dunn2005; Reed et al. Reference Reed, Warzybok, Wilson, Bradley, Wanless and Sydeman2009; Dunn and Winkler Reference Dunn, Winkler, Møller, Fiedler and Berthold2010). In Mongolia, breeding may be timed to match the maximum energy requirement of chicks with the peak of food abundance, such as Brandt’s vole which has a population peak from May to August (Zhang and Zhong Reference Zhang and Zhong1979). A meta-analysis has shown that overall production of young in bird populations has been declining over the past 50 years across the globe with rising temperatures mainly affecting offspring production of migratory and larger-bodied species (Halupka et al. Reference Halupka, Arlt, Tolvanen, Millon, Bize and Adamík2023). Our study found that a warmer climate during the breeding season significantly improved fledged brood sizes of sakers, with no significant effects of climate conditions on clutch size. Climate conditions may influence prey availability through direct effects, for example, cold winter but less snow cover to provide thermal insulation for overwintering small mammals, or indirect effects on primary productivity that determine rodent population demographics and visibility to predators. An index of prey availability was positively correlated with breeding density, earlier egg laying, clutch size, and nest survival, indicating its critical role in determining breeding success in sakers. Previous studies in raptors have shown that both reproduction and survival are influenced by prey availability and climate (Brommer et al. Reference Brommer, Pietiäinen and Kolunen2002; Millon et al. Reference Millon, Petty, Little, Gimenez, Cornulier and Lambin2014), with positive covariation between these two demographic rates being strongly linked when prey availability varies (Fay et al. Reference Fay, Michler, Laesser, Jeanmonod and Schaub2020). Covariation among demographic rates indicates that breeding data, which are relatively straightforward to obtain from artificial nesting populations, can potentially be a valid proxy for data that is more challenging to collect, such as survival and recruitment rates (but see Kenward et al. Reference Kenward, Katzner, Wink, Marcström, Walls and Karlbom2007; Hou et al. Reference Hou, Xu, Lin, D’urban-Jackson, Dixon and Bold2018).
The development of an adaptive management framework to establish a sustainable, regulated harvest for the saker is a key tenet of the CMS SakerGAP (Kovacs et al. 2014). Within this context, we have demonstrated that the provision of artificial nests enables the saker to be managed at a scale appropriate for trade and expedites the acquisition of demographic data required to model sustainable harvest quotas, noting that vital demographic rates can vary in relation to environmental conditions.
Acknowledgements
We thank M. Al Bowardi and M. Al Mansouri for their support. We thank the many international and Mongolian field assistants who helped to monitor raptors breeding at artificial nests in Mongolia during this study, and Xuan Liu for comments on the manuscript. This project was funded by the Environment Agency – Abu Dhabi under a MOU with the Ministry of Nature, Environment and Tourism, Mongolia. Data analyses were supported by the Strategic Priority Program of the Chinese Academy of Sciences (XDB31000000), National Natural Science Foundation of China (31930013, 31900340, 32270455), and the Third Xinjiang Scientific Expedition Program (Grant No.2022xjkk0800). Author contributions: Andrew Dixon, Xiangjiang Zhan, and Yuke Zhang contributed to the study conception and design; data collection was performed by Batbayar Bold, Batmunkh Davaasuren, Batbayar Galtbalt, Amarkhuu Gungaa, Gankhuyag Purev-Ochir, Nyambayar Batbayar, Lutfor Rahman, and Andrew Dixon; data analysis was performed by Yuke Zhang, Zhongru Gu, Batbayar Bold, Xinhai Li, Qiang Dai, Andrew Dixon, and Xiangjiang Zhan; the manuscript was written by Andrew Dixon and Yuke Zhang, and all authors read and approved the final manuscript.
Supplementary material
The supplementary material for this article can be found at http://doi.org/10.1017/S095927092300031X.


