


LEARNING OBJECTIVES
After reading this article you will be able to:
• learn the steps to construct a test for any social science concept that needs to be measured
• understand the concepts and techniques to make the constructed test psychometrically robust
• master the method to translate an existing psychological test to create an equally valid scale in another language.
There will be no clinician working in the broad area of mental health who has not used a psychological test/rating scale, either for research or in their clinical practice. The need also arises in the field of social sciences either to develop a new scale or to translate a scale into the local language for use in a particular population. For any scale to be used within a specific sample, it has to be valid in that group – hence, it will require validation prior to use. The process of developing and validating an instrument is in large part focused on reducing error in the measurement process. In this article, we take the reader through easy-to-follow practical steps involved in three processes: developing a test, validating it and translating it.
Why construct a psychological test?
Understanding and assessing a person's behaviour usually requires in-depth interaction with or observation of the person over a period of time. We can also get information about the person from those in constant contact with them or from records about them. A quicker method is to get the answers from them directly, through self-report. They can answer self-report questions on the basis of their past behaviour or their possible response to various imagined situations. Put together, these questions can give a sample of the person's behaviour.
This direct method of self-report has several advantages, in that it is quick, can be obtained from several people simultaenously, is comparable, and is directly obtained from the person rather than based on inferences made by an observer. But it also has several potential problems. For example, failure to elicit authentic information about feelings and behaviour if the person wrongly perceives themselves or the question; falsification of responses to impress; forgetfulness; surface replies because of lack of involvement; and, most important, factors relating to the test items, such as their relevance, the response options given and also how they are worded (Ackroyd Reference Ackroyd and Hughes1981). The same question worded differently and asked by different people can elicit different answers. For example, the following three questions are aimed at finding out whether a person is depressed: ‘Are you terribly depressed?’; ‘Considering your family's complaints about your constantly low mood, would you say you are depressed?’; ‘On a scale of 1–10, with 10 being very high, can you rate your level of depression?’. The first question might elicit a ‘Yes’ or ‘No’ response, but no indication of the severity of the depression; the second might make the respondent defensive and, in rebellion, they might falsely respond ‘No’; the third item, however, if well understood by the respondent, might show us not only whether the person feels depressed, but also how severely.
A well-constructed test that taps all aspects of a concept or situation in a scientific way and has been confirmed to be consistent can offset many of these problems and be a quick and accurate tool. Psychological tests are being increasingly used in research, clinical practice and educational settings, because of their reliability and the ease and speed of gathering, comparing and differentiating data. A new scale is usually created when instruments or tests to measure the construct of interest are not readily available or existing tests do not fully satisfy the requirement or are not in the required language.
A psychological test is a systematic procedure for obtaining samples of behaviour relevant to cognitive or affective functioning, and for scoring and evaluating those samples according to standards (Urbina Reference Urbina2004). Psychological tests are useful for making decisions in clinical and career settings, for understanding the self and others, and as personal growth indicators. They are also useful in research to understand psychological phenomena and individual differences. They can be ability tests, achievement tests, attitude and aptitude tests, personality tests, intelligence tests or neuropsychological tests. Strictly speaking, the term ‘test’ should be used only where the individual's responses are evaluated, on the basis of their quality or correctness, as an indicator of some aspect of their cognitive functioning, knowledge, skills or abilities. Instruments whose responses are neither evaluated nor scored as right/wrong or pass/fail are called inventories, questionnaires, surveys, checklists, schedules or projective techniques, and are usually grouped under the rubric of personality tests (Urbina Reference Urbina2004).
The construction of a test
Test construction usually involve three main procedures:
• item generation and selection
• item analysis.
Item generation and selection
Draft item creation
The initial step in creating draft items involves understanding the concept thoroughly through reading related literature, talking to experts, sharpening one's own thinking and observation. Attention must also be paid to whether it is a uniform concept or if there are sub-aspects to it (Irvine Reference Irvine and Kyllonen2002). For illustrative purposes, let us take the example of anxiety. Anxiety involves not only the feeling aspects of being fearful, feeling discouraged and anxious, but also cognitive aspects such as constantly thinking of failures, problems and negative consequences, as well as physiological aspects such as tremors, palpitations, feeling faint, cold clammy hands, dry mouth and upset stomach. A pool of items representing all the sub-aspects of the concept must be prepared by the test constructor, ideally with a team of experts. Shortcomings at this stage with regard to the relevance and wording of the test items can contribute to the error variance. Error variance is variance due to random, irrelevant sources, as opposed to the true variance, which is variance due to true difference (Cohen Reference Cohen and Swerdlik2009).
Test format
The test format also has to be decided. Will the test be open-ended (also called free response or constructed response) or will it be closed (objective or forced choice)? Open-ended responses may involve writing samples (e.g. in an ability test), free oral responses (e.g. in projective tests) or even performance of some kind of task. They are good for exploring concepts/situations/phenomena and provide a wider range of possibilities, richer samples of the individual's behaviour and allow for their unique characteristics to emerge. However, scoring is more complex and time-consuming, and the reliability and validity of such tests are lower than in closed-response (forced-choice) tests (Urbina Reference Urbina2004).
The forced-choice format presents a limited number of alternatives from which the respondent must choose. The choice can be on the basis of multiple choice, true/false statement, rating, ranking and matching, as well as rearrangement of the options provided. Well-known among them is the Likert scale, where the items are listed and the respondent expresses their degree of agreement or acceptance or frequency of occurrence by choosing one of an odd number (3, 5, 7 or even 9) of response options, with the midpoint usually signifying a neutral or middle-of-the-road position (Dawes Reference Dawes2008). The sum of the responses to all the items is taken as the score. The 5-point Likert scale is particularly popular, with response options such as ‘strongly agree’, ‘agree’, ‘neither agree or disagree’, ‘disagree’ and ‘strongly disagree’ (Derrick & White Reference Derrick and White2017). Seven or more response options are used if there is just a single item for measurement, as in the Net Promoter Score, a single-item customer loyalty measure where customers are asked how likely it is that they will recommend a company or product to others (Sauro Reference Sauro and Dumas2009).
The forced-choice format is the most frequently used option for test items because of the ease and speed of scoring. The objectivity of the responses makes it more reliable. It can be applied in individual or group testing. However, errors are possible if the respondent guesses in ability tests, or answers manipulatively or carelessly in personality tests. These can reduce the reliability and validity of the test. Also, preparing a forced-choice test requires thorough familiarity with the concept and specialised test development and item-writing skills. Most of this article focuses on this type of test construction.
Item analysis
Qualitative item analysis
The order, type and wording of the measurement items, the introduction, the instructions, the transitions and the closure/ending of a test ideally should encourage respondents to provide accurate and adequate information. They should also discourage them from discontinuation or refusing to answer specific questions. Test item wording also has to be sensitive to the target group. The following tips help meet these aims.
• Use simple language, short sentences and terms that the participant understands (e.g. in the item ‘I dread panic attacks’, the respondent might not know what ‘panic attacks’ are).
• Ensure that all possible response alternatives are provided for forced-choice (closed-response) items (e.g. in asking about ‘Frequency of panic attacks’, if the response options range from ‘once in a year’ to ‘several times a day’, someone who has never experienced a panic attack ever is forced to chose an option that does not apply to them).
• Ensure that the wording of the item matches the response options (e.g. if the item reads ‘Do you feel fearful for no reason?’, the response options ‘strongly agree’, ‘agree’, ‘disagree’, ‘strongly disagree’ will not be suitable as they are meant for a statement and not a question).
• Ensure that all the items are relevant and needed.
• Avoid double-barrelled items (e.g. ‘Do you have digestive problems and shortness of breath?’ – if the patient has only one and not the other, how will they answer?).
• Avoid leading, biased wording (e.g. ‘Anxiety is often accompanied by irritability; rate your level of irritability on a scale of 1 to 10’).
• Avoid ambiguous words with broad or abstract meaning. For example, words such as ‘generally’, ‘on average’ and ‘regularly’ can mean different things to different people.
• Avoid items that require effort and distant recall (e.g. ‘Did you experience anxiety attacks 5 years ago?’)
• Avoid asking for ego-threatening, embarrassing or private information if it is not essential (e.g. income, moral stand, private habits).
A test maker should also be aware of ‘response set’ while creating the final form of the test. The response a person makes to a test is a function not just of the item content but also of the form of the items and the test direction. Going for speed rather than accuracy, tendency to opt for the neutral category, tendency to guess when in doubt, tendency to mark extreme categories, tendency to agree or like, tendency to respond desirably are all examples of an individual's response set when completing a test. A person's response set is the consistency in the manner of their response to the test's form rather than its specific content (Cronbach Reference Cronbach and Lee1950). For example, if all the items of the test refer to the anxiety symptoms such as trembling, fearfulness, thoughts of failure, this might induce a temporary preference to respond in a set way to all the items. To avoid this response set, some of the items could be worded in the reverse direction (‘reverse wording’), with corresponding reverse scoring. For example, ‘I am usually calm most of the time’ instead of ‘I am often fearful’.
Administering the draft version of the test to a small sample of 15–30 respondents, representative of the population the test is intended for, can help to ensure that the test items are understandable and answerable. Thus in this qualitative item analysis phase, the content coverage, wording and sentence structure of the item pool are fine tuned by the test constructor, then submitted to reviewers for their comments and for further revision, if any.
After the refinement at these three levels by the test constructor, using information from the pilot study and the reviewers’ comments, the test is ready for the important stage of quantitative item analysis, which is carried out on a much larger sample of 200+ respondents.
Quantitative item analysis
This involves a variety of statistical procedures used for the final selection of the items of a test on the basis of the responses obtained from the samples used in the process of test development. Two important concepts used for selecting items from the pool are their difficulty level and discriminative power.
Difficulty level is a measure of the proportion or percentage of respondents who answered the item correctly; for this reason it is frequently called the P-value (Anastasi Reference Anastasi1954; Urbina Reference Urbina2004). It can range between 0.0 and 1.0, where 1.0 indicates that 100% of examinees responded to the item correctly, indicating that it is an easy item. In criterion-referenced tests, where each respondent's performance is compared directly with the standard, without considering how others perform on it (e.g. classroom-achievement tests), the item difficulty is kept in the range 0.7–0.8, as it has to be within the reach of the majority of respondents. On the other hand, norm-referenced tests, where the purpose is usually to rank and compare respondents, are designed to be harder and to spread out the examinees’ scores. To achieve this purpose, an item difficulty index between 0.4 and 0.6 is chosen for such tests (Urbina Reference Urbina2004). Difficulty level is critical in ability tests, as it differentiates between people of high and low ability, but in personality tests, difficulty level is applicable only to ensure that the respondents are in a position to understand and respond as required.
Discriminative power refers to the extent to which items elicit responses that accurately differentiate test takers in terms of the behaviours, knowledge or other characteristics that the test is designed to evaluate (Urbina Reference Urbina2004). For every type of test, be it an ability test, an achievement test, an attitude or a personality test, this is one of the most important, as well as basic, qualities an item must possess: individuals high on what the test aims to measure should score high on the item and those low on that variable should score low on the item.
A simple way to compute the index of discrimination (D) using the classical test theory (CCT) approach is to arrange the respondents’ total scores (sum or average of all the items) for the test in descending order and classify the respondents into three distinct groups: those scoring the highest 27% of marks, those scoring lowest 27% and those in the middle. For each item, the percentage of respondents in the upper and lower groups who answer correctly or answer in the intended direction is calculated. The difference is one measure of item discrimination. The formula is:

The possible range of the discrimination index is −1.0 to 1.0. A negative discrimination index may indicate that the item is measuring something other than what the rest of the test is measuring. More often, it is a sign that the item score has been wrongly entered. This can also happen due to carelessless or when the items are written in reverse direction.
Another method of determining discriminative power for questions with a right and wrong answer is the point-biserial correlation (PBC), which measures the correlation between the correct answer (viewed as 1 = right and 0 = wrong) on an item and the total test score of all students (Wright Reference Wright1992). The PBC is sometimes preferred because it identifies items that correctly discriminate between high- and low-scoring groups, as defined by the test as a whole, instead of the upper and lower 27% of a group.
Summary
Item analysis will thus help the test constructor to decide on the items to select for the final test by choosing those with levels of difficulty and discriminative power suited to their purpose.
Pilot testing
The revised version of the newly constructed test should be pilot tested on a small sample (15–40) from the target population, as well as evaluated by a subject expert, to assess its acceptability and comprehensibility. The respondents should be asked whether they understand the meaning of the items and to describe them in their own words (Ntourantonis Reference Ntourantonis, Panagopoulos and Iliopoulos2017).
Checking the reliability and validity of the test
Just as we would expect a weighing scale to display what we actually weigh (validity) and to show the correct weight every time we use it (reliability), the same trustworthiness is expected in psychological testing, even though the concepts being measured are not tangible. Reliability is an indicator of how consistent or stable a test score is over time and validity is an indicator that the test measures what it is intended to measure. Interestingly, a measure can be reliable without being valid, but a measure cannot be valid without being reliable (Eldridge Reference Eldridge, Boswell and Cannon2017; Kimberlin Reference Kimberlin and Winterstein2008). This section discusses how the reliability and validity of the constructed test be measured and ensured.
Item analysis, both qualitative and quantitative, aims to increase the reliability by taking care of the errors that can occur due to lack of clarity of test items and instructions and also ensuring the inclusion of only relevant and discriminating items. Estimating the reliability and validity is aimed at making the scale even more robust.
Reliability
Reliability (stability or consistency) of a constructed test can be checked using a variety of methods (Box 1).
BOX 1 Types of reliability used in test checking
• Test–retest reliability
• Parallel forms reliability
• Split-half reliability
• Internal consistency
Test–retest reliability
The most straightforward method is where the test is administered once and then a second time to the same or a similar group after a suitable gap (not too short that they remember the items, and not too long that respondents could have changed with respect to the variable being measured). This is called test–retest reliability, and it measures the temporal stability. The correlation of the scores between the two administrations will give the test–retest reliability. Scores above 0.70 indicate reasonable reliability.
Parallel (or alternate) forms reliability
To overcome the possible practice effect of the test–retest method, instead of the same test, a similar version of the test is administered to the same group. This is called parallel or alternate forms reliability (it is also called equivalence). A high correlation of above 0.70 between the two test scores indicates reliability.
Split-half reliability
A third type of reliability, which requires only a single test administration is split-half reliability, checks the reliability by splitting the test into two comparable halves and finding the correlation between the data for each half.
Internal consistency reliability
A single administration is also enough to determine internal consistency reliability, which measures how well each item measures the content or construct under consideration. The logic here is that different items that measure the same construct should display high relation with each other. There are a variety of internal consistency measures. Usually, they involve determining how highly these items are correlated and how well they predict each other. Cronbach's alpha is one commonly used measure if the variable is unidimensional, and it can be quickly calculated using statistical software.
Test length
It was believed that the longer a test is, the more reliable it is because more items reduce the error of measurement. Indeed, a sufficient number of items must be included to cover the content areas tested; however, the quality of items can contribute to how efficiently a test measures and separates respondent's ability. Thus, if the quality of the items is high, a shorter test can have higher reliability than a longer one (Urbina Reference Urbina2004).
Validity
Ensuring the validity of a test can also be done in several ways (Box 2).
BOX 2 Types of validity used in test checking
Content validity
Face validity
Construct validity:
• convergent
• divergent
Criterion validity:
• concurrent
• predictive
Content validity
Content validity is the extent to which test items are relevant to and representative of the concept being measured (Urbina Reference Urbina2004). Psychological tests designed to aid in the diagnosis of psychiatric disorders often include, or may even be entirely composed of, items that reflect critical symptomatic aspects of the syndromes they are designed to diagnose. Here again, the relevance and representativeness of the items sampled by these instruments are of crucial importance in determining their usefulness for diagnostic purposes. One way to provide evidence for content validity is by using subject matter experts to review a measure for any construct deficiency or contamination. For example, a test of anxiety can be relevant if it adequately covers the emotional, cognitive and behavioural symptoms of anxiety and also does not inadvertantly cover symptoms of depression, which is another concept.
Criterion validity
Criterion validity uses various strategies that focus on the correlation between the score obtained from the test being matched on a known outcome indicator (i.e. criterion) for the construct being tested. Criterion validity can be manifested by concurrent validity and predictive validity. Concurrent validity refers to the extent to which the score (of the test being validated) is related to an outcome indicator score that is measured at the same time, whereas predictive validity refers to how well the score can predict a criterion obtained later (Hubley Reference Hubley, Zumbo, Geisinger, Bracken and Carlson2013; Messick Reference Messick1995). For example, the scores of a newly constructed test of intelligence are matched to students' current grades in class (concurrent) and are also matched to their final grade point average a year later.
Construct validity
Construct validity is ‘the degree to which a test measures what it claims, or purports, to be measuring’ (Cronbach Reference Cronbach and Meehl1955). In the classic model of test validity, construct validity is one of three main types of validity evidence, alongside content validity and criterion validity. Modern validity theory defines construct validity as the overarching concern of validity research, subsuming all other types of validity evidence (Messick Reference Messick1998). Key to construct validity are the theoretical ideas behind the concept under consideration. There is no single way to measure it: construct validity should be demonstrated from a number of perspectives, by an accumulation of evidence (Brown Reference Brown1996).
Convergent validity and discriminant validity are two subtypes of construct validity. Convergent validity represents the correlation between the score obtained from the target test (e.g. a newly developed scale for anxiety) and the score on a test for an existing highly related construct (e.g. emotional stability) or the score derived from another well-validated test that measures the same construct (e.g. another scale to measure anxiety). Discriminant validity indicates the relationship between the scores of anxiety and of an unrelated construct (e.g. intelligence).
Face validity
Face validity refers to the superficial appearance of what a test measures, from the perspective of a test taker or any other naive observer. Improving face validity does not improve the test's objective validity, but it is needed for cooperation and public relations – for test users, for those who select and decide on which tests to be used, for the observer, and for judicial and legislative purposes. For example, in measuring the numerical aptitude of engineers, having test items that deal with machines and tools might elicit more involvement than items about flowers and oranges.
Factor analysis
The newly constructed test, with its original items and revised (or reduced) items, should be subjected to exploratory factor analysis (EFA) and confirmatory factor analysis (CFA) to investigate and verify its factor structure. This method is used to further check its construct validity. The principle goal of factor analysis is to reduce the number of dimensions needed to describe data derived from a large number of measures, and in this case it is to explore the dimensions underlying the variable being measured. Although theorists differ in the use of both EFA and CFA, one view is that EFA can be used to establish a preliminary construct validity and CFA can be used if there is theory to support the factor structure (Urbina Reference Urbina2004). The following sections briefly explain EFA and CFA.
Exploratory factor analysis (EFA)
The first step is to collect a new set of data using the test with the items that survived the pilot test. There is no clear-cut requirement for sample size, but a sample of over 300 or at least 10 observations per item of the draft scale is recommended to achieve a stable result. The data are then submitted to EFA to examine the underlying theoretical structure of the test. EFA starts with finding the correlations among the scores obtained by the respondents to the test items, and the end product is a factor matrix that lists the loadings of each test item on the factors extracted from the analyses. The quality of the test is assessed by three elements: factor structure (i.e. the number of factors to be retained), factor loading and total explained variance. A brief account of evaluating the three elements is provided below. A detailed explanation of conducting an EFA is beyond the scope of this article. Interested readers can refer to Fabrigar et al (Reference Fabrigar, Wegener and MacCallum1999), Osborne et al (Reference Osborne, Costello, Kellow and Osborne2008) and Tabachnick & Fidell (Reference Tabachnick and Fidell2013).
Factor structure (factors to be retained)
Scree plots and eigenvalues are the two widely used indicators to determine the number of factors to be retained. A scree plot is a curve that shows the eigenvalues in a downward direction (Fig. 1). The number of factors to be retained is determined by referring to the left of the point where the ‘elbow’ of the graph seems to level off. Factors with eigenvalue greater than 1.0 should be retained. For instance, if the EFA shows five factors but only the first three factors’ eigenvalues exceed 1, then a three-factor, instead of five-factor, solution is recommended.
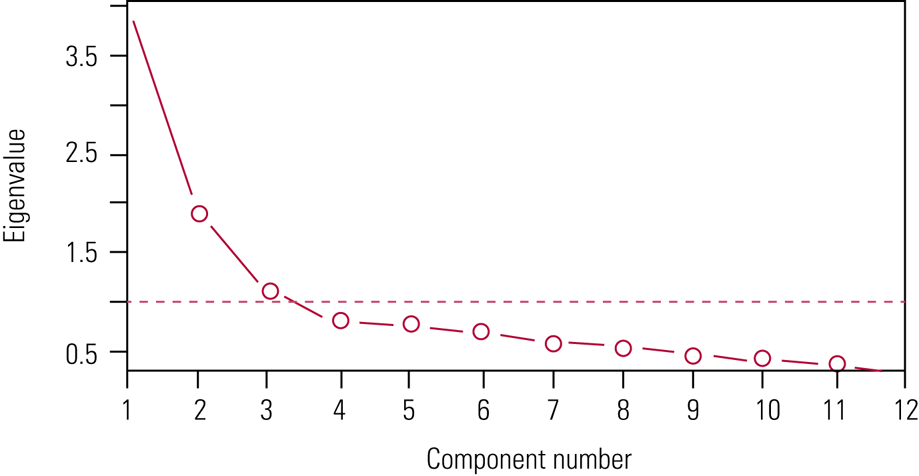
FIG 1 A scree plot shows the eigenvalues for a 12-item test. Factors sitting to the left of the point where the ‘elbow’ of the graph levels off are those to be retained. Here, three factors should be retained.
It is important to note that that the eigenvalue method is not without limitations. Researchers can fix the number of factors according to the underlying theory of the test.
Factor loading
After identifying the number of factors to be retained, the next step is to examine the loading pattern of the items. Loading shows the variance explained by the item on that particular factor. Theoretically speaking, items that are designed for a specific factor should load onto the target factor. Moreover, such items are expected to demonstrate (a) a high factor loading (e.g. ≥0.40) on the target factor and (b) lower factor loading on non-target factors. For example, in the anxiety scale, items that measure biological responses such as hand tremors and palpitations should have a high factor loading (e.g. ≥0.40) on the physiological response factor and lower factor loading on the emotional and cognitive factors.
If the factor-loading results are different from the expected, for example the factor loading of an item is consistently low on all factors, researchers can remove such item(s) and submit the remaining items to another EFA. The procedure can be repeated until all the items show satisfactory factor loading. When the results find more than one item that deserves deletion, it is advisable to remove them one item at a time (starting with the item with the lowest factor loading) and then to re-run EFA. The sequence of removing items does matter and should be reported. In addition, it is possible that an item may have acceptable factor loading on both target and non-target factors. Two solutions are suggested to deal with this cross-loading problem. Some researchers suggest removing such items to enhance clarity of the structure and ease interpretation of results; others argue that cross-loading is not uncommon and should be allowed, especially when it is theoretically adequate.
Explained variance
Finally, after identifying a satisfactory factor structure with acceptable factor loadings, it is critical to examine whether the structure has a high percentage of total explained variance, which is the part of the model's total variance that is explained by factors that are actually present (e.g. >50%). Higher percentages of explained variance indicate low discrepancy between a structure (or model) and actual data (i.e. low error variance) and hence better predictions can be made (Rosenthal Reference Rosenthal and Rosenthal2011).
Summary
Taken together, a EFA result consists of an interpretable factor structure, clear-cut factor loading and adequate explained total variance. Note, however, that EFA may generate three types of result: exactly identical to the structure of the original version of the test, slightly different or totally different from the original version. Regardless of the results, it is necessary to collect another set of data and further examine the qualities of the test using CFA.
Confirmatory factor analysis (CFA)
In scale or test development, the purpose of CFA is to examine the fitness of the structure of the test (also called a model in CFA) or how closely observed data match the relationships specified in a hypothesized model. Having been through EFA, the test should next be submitted to CFA (using a new data-set) to further examine whether the structure is supported.
More than a dozen different model fit statistics have been suggested for examining the fitness of a model and the options continue to increase. Although each statistic has its pros and cons, some are more widely used than others. For example, Kline (Reference Kline2015) recommends reporting the χ2-test (and ratio of the χ2-value to degrees of freedom), the root mean square error of approximation (RMSEA), standardised root mean square residual (SRMR) and comparative fit index (CFI). The χ2-test, RMSEA and SRMR belong to the category of absolute fit indices, which examine how far the model being tested is from perfect fit. Put differently, these measures indicate how bad the model is. A larger value represents a poorer fit. On the contrary, the CFI is a type of relative fit index, which indicates the goodness of a model. The larger the value, the better the model is.
Experts have suggested cut-off points for these tests. Specifically, a good-fit model shows a ratio of χ2-values to the degrees of freedom <3, RMSEA ≤ 0.05, SRMR < 0.08 and CFI > 0.95 (Hu Reference Hu and Bentler1999; Tabachnick & Fidell Reference Tabachnick and Fidell2013). If the model shows poor fit, researchers can refer to the modification indices for recommendations, such as adding error covariance to improve fitness. However, strictly speaking, modification should be avoided. Recall that the purpose of CFA is to verify the model suggested by EFA. If the model is modified, its results should be interpreted as exploratory instead of confirmatory. Moreover, researchers should collect a new data-set and conduct another CFA to verify the modified model.
A detailed description of conducting CFA and model comparison is beyond the scope of this article. Interested readers are referred to Byrne (Reference Byrne2016), Brown & Moore (Reference Brown, Moore and Hoyle2012) and Kline (Reference Kline2015).
CFA for translated tests
CFA is also conducted for tests that have been translated into another language to ensure that the translated version is true to the original (translation is discussed in more detail below). It is noteworthy that the best model of a translated test that is supported by both EFA and CFA could be the same or different from the structure of the parent version. When the same structure is found, it implies that translation has had very little impact, if any, on the structure of the test. Therefore, one can confidently believe that the same respondents would perceive items of the parent and translated versions equally. On the other hand, minor or major differences imply either that translation has distorted the meaning of the items or that the theoretical concept or construct of the test is cross-culturally different. In the latter case, researchers may want to examine the target population's perception of the construct assessed by the test using a qualitative approach. Alternatively, if possible, researchers may collect data using both the parent and the translated versions and evaluate the variance of the structure of the two tests to identify the sources (e.g. different structure, factor loading) of any differences.
Preparing the test manual
Once the test has proven to be psychometrically sound, with high reliability and validity, a manual is created that summarises the test-making procedure as well as giving instructions on how to use the test. The manual should thus cover: (a) the concept being measured; (b) the target group and purpose of the test; (c) how the test items were developed and selected; (d) the reliability and validity methods (including factorial structure obtained through EFA) used and their values; (e) how the test is to be conducted; and (f) how to score and interpret the results.
Translating a rating scale/questionnaire
In certain situations, standardised rating scales/questionnaires might not be available in the language desired. Rather than create a new test in the required language, existing tests can translated using the process described below to ensure that the psychometric qualities of the original remain and are not diluted or tampered with. This involves the processes of forward and backward translation (Box 3).
BOX 3 The steps in translating a test into another language
1 Forward translation by at least two translators working separately
2 Backward translation by at least two translators working separately
3 Check by committee of experts
Forward translation
The original questionnaire should be translated into the required language by at least two independent translators working separately to produce two translations. The translators should be fluent in the original and target languages and cultures to be able to understand the nuances of the concept being measured and the test items (Beaton Reference Beaton, Bombardier and Guillemin2000). Best results are obtained if one translator is a language expert and the other translator is a subject expert, to ensure that language complexity as well as subject matter intricacies are not missed. The two versions should be compared and discrepancies between them discussed and resolved between the translators, preferably with input from the researcher or another unbiased bilingual translator not involved in the previous translations.
Backward translation
After a single agreed version in the required language is created, it should be translated back into the original language to ascertain the accuracy of translation. This should be done by at least two translators not involved in the previous exercise, to avoid the influence of familiarity with the original test. During this phase too, the translators should be fluent in both languages and, ideally, one should be a subject expert and the other a language expert.
Check by experts
After checking that the backward translation matches the original test, an expert committee familiar with the concept being measured, as well language experts (previous translators can be included) and the researchers, should review the translations to reach a consensus on all items so as to produce a final version of the translated test that is equivalent in meaning and metric to the original (Tsang Reference Tsang, Royse and Terkawi2017). As discussed in the previous section, fresh data can be collected and a CFA can be run on the translated test to see whether it maintains the same structure as the original.
Conclusions
We have outlined the steps (Box 4) as well as guidelines for developing, validating and translating a psychological test. The development of a psychological test requires the test constructor's thorough understanding of the concept or construct being measured, familiarity with test formats to select the best format for the test and creation of items appropriate to the population to be tested. After the test development stage, a pilot study is conducted to see whether the items are being understood correctly by the intended respondents. The next stage of validation involves a series of procedures to gauge the test's reliability and validity to make it psychometrically sound. The process of translating a test involves forward and backward translation and review of the translations by an expert committee.
BOX 4 Key steps in constructing, piloting and validating a test
1 Test-construction decision
2 Investigation into concept
3 Test-format decision
4 Item writing
5 Item review by expert
6 Data collection using draft test version 1
7 Item analysis of test
8 Creation of draft version 2 using the chosen items
9 Pilot testing of draft version 2
10 Determine validity and reliability of draft version 2
11 Exploratory factor analysis (EFA)
12 Creation of draft version 3 after EFA
13 Confirmatory factor analysis (CFA) of draft version 3
14 Creation of final test (version 4) after CFA
15 Construction of a manual
Author contributions
J.F. conceived the idea for this paper and wrote the draft. C.S.T. and S.G. helped write and revise the manuscript.
Declaration of interest
None.
ICMJE forms are in the supplementary material, available online at https://doi.org/10.1192/bja.2020.33.
MCQs
Select the single best option for each question stem
1 In quantitative item analysis, the item difficulty index D lies in the range:
a 0–1000%
b 50–70%
c 0.0–1.0
d −1 to +1
e 0.8–1.
2 The various kinds of reliability used in test checking do not include:
a face reliability
b split-half reliability
c test–retest reliability
d parallel forms reliability
e interrater reliability.
3 Predictive validity is part of:
a construct validity
b criterion validity
c face validity
d content validity
e retest validity.
4 Backward translation involves:
a only the researcher
b a language expert
c a language expert and a subject expert
d machine translation
e respondents to the pilot study.
5 In determining factor structure, factors are extracted on the basis of:
a eigenvalues
b explained variance
c the magnitude of the factor loading of the items under each factor
d a scree plot
e all of the above.
MCQ answers
1 c 2 a 3 b 4 c 5 e


eLetters
No eLetters have been published for this article.