


Rice is the most commonly consumed staple food and the major dietary source of carbohydrates in many Asian countries. However, refined white rice has been classified as a high glycaemic index (GI) food in previous studies( Reference Yang, Chang and Lin 1 , Reference Boers, ten Hoorn and Mela 2 ), and daily consumption of a high-GI rice-based diet may induce hyperglycaemia after meals, even in healthy people( Reference Robert, Ismail and Rosli 3 ). A sustained elevated postprandial blood glucose level is strongly associated with an elevated risk of type 2 diabetes mellitus (T2DM)( Reference Kolb and Eizirik 4 ). It is estimated that the number of diabetes patients will reach 123·0 and 201·8 million in 2035 in South East Asia and the West Pacific region, respectively( Reference Guariguata, Whiting and Hambleton 5 ). Dietary interventions that can attenuate postprandial glycaemic responses (GR) have been proven beneficial for T2DM prevention( Reference Tuomilehto, Lindstrom and Eriksson 6 ), and these interventions are encouraged by professional bodies( Reference Ceriello and Colagiuri 7 ).
As a staple food, rice is usually co-consumed with other dishes, such as vegetables, meat, fish and soya foods in East Asia and South Asia. The addition of vegetables deserves to be highlighted as vegetables are high nutrient density food, rich in dietary fibre and phytochemicals such as polyphenols and carotenoids. Accumulating epidemiological evidence and intervention trials support that sufficient vegetable intake, especially the intake of green leafy vegetables( Reference Cooper, Sharp and Luben 8 – Reference Wu, Zhang and Jiang 10 ) and cruciferous vegetables( Reference Jia, Zhong and Song 11 ), are associated with reduced risk of T2DM.
A number of research reports have shown that, compared with the GR of pure rice, the GR of rice-based mixed meals could be reduced by the incorporation of a variety of vegetables, although the amount of total available carbohydrate of the vegetable–rice mixed meal was higher than that of the pure rice meal( Reference Wolever, Jenkins and Vuksan 12 – Reference Sun, Ranawana and Leow 14 ). Eating vegetable dishes before taking carbohydrate-based food improved postprandial glucose excursions in day-long glycaemic tests and lowered the HbA1c after year-long intervention in diabetes patients( Reference Imai, Matsuda and Hasegawa 15 ). Leafy vegetable juices were also reported as a possible contributor to supressing postprandial GR in preload studies in both healthy adults( Reference Kasuya, Okuyama and Yoshida 16 ) and rats( Reference Tiwari, Jyothi and Tejeswini 17 ) when consumed before ingestion of high-GI foods.
The possible mechanisms of mitigating GR by adding vegetable to a high-GI carbohydrate diet can be explained as follows: (1) dietary fibre can delay gastric emptying( Reference Yu, Ke and Li 18 , Reference Gopirajah, Raichurkar and Wadhwa 19 ); (2) soluble fibre may lower the postprandial GR( Reference Argyri, Sotiropoulos and Psarou 20 ) and (3) phytochemicals, including polyphenols, may inhibit intestinal α-glucosidase activity and thus could slow the digestion rate of food carbohydrates( Reference Kumar, Anusha and Oruganti 21 ). However, the gastric emptying process may be affected by food texture factors, and the type of dietary fibre might make a difference in the GR-suppressing effect, as insoluble fibre has been shown to be ineffective in lowering food GI or GR( Reference Samra and Anderson 22 ).
In the previous studies, the vegetable samples were prepared as salad( Reference Imai, Matsuda and Hasegawa 15 ), boiled( Reference Ballance, Knutsen and Fosvold 23 ), microwaved( Reference Kumar, Anusha and Oruganti 21 ) or juiced( Reference Kasuya, Okuyama and Yoshida 16 , Reference Kumar, Anusha and Oruganti 21 ). However, it has not yet been reported whether the physical structures of vegetable samples or their cooking status could significantly contribute to their glycaemic suppression capacity.
Therefore, we assumed that texture/physical properties of vegetables would have a crucial effect on postprandial GR. To examine this hypothesis, three kinds of commonly consumed vegetables including Pak choi, cauliflower and eggplant were chosen as samples. The vegetables were (1) cooked, (2) cooked and homogenised or (3) homogenised raw, before being incorporated into vegetable–rice mixed test meals. The acute GR of the test meals, as well as the in vitro carbohydrate digestion indicators of the above-mentioned vegetable–rice mixed meals, was measured.
Methods
Pre-treatment of test foods
Pak choi (Brassica rapa var. chinensis), cauliflower (Brassica oleracea L.) and eggplant (Solanum melongena L.) were brought from the local market. Pak choi leaves were peeled from the roots and were washed in tap water for 4 min. Floret bouquets were cut from the cauliflower heads and were washed in tap water for 4 min. Eggplant was washed in tap water for 2 min and cut into 4-mm slices.
Preparation of test meals
After the pre-treatment, a preliminary sensory test was conducted to evaluate the acceptability of multiple vegetable samples cooked with minimal amount of oil (2·5/300 g fresh vegetable). The steamed eggplant, boiled cauliflower and boiled pak choi were chosen for their satisfactory acceptability. Subjects were offered nine different white-rice-based meals, as shown in Fig. 1. Glucose (50 g of Glucolin® (The British Dispensary (L.P.) Co. Ltd) dissolved in 250 ml of water) and rice containing 50 g of available carbohydrates were prepared as dual reference foods. The tested rice meals were as follows: (1) cooked rice (R) (2) cooked rice with cooked vegetables, including cooked pak choi (CP), cooked cauliflower (CC) and cooked eggplant (CE); (3) cooked rice with homogenised raw vegetables, including homogenised raw pak choi (HRP), homogenised raw cauliflower (HRC) and homogenised raw eggplant (HRE); and (4) cooked rice with homogenised cooked vegetables, including homogenised cooked pak choi (HCP), homogenised cooked cauliflower (HCC) and homogenised cooked eggplant (HCE). The sensory test showed that homogenised raw vegetables had lower scores compared with their non-homogenised counterparts, but they were accepted by the subjects.
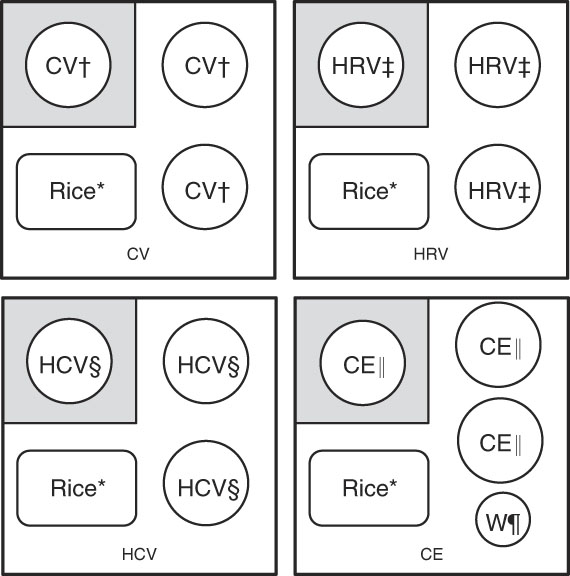
Fig. 1 Composition of vegetable–rice mixed meals; the size of each meal is 569·1 g (water used for cooking or balancing the weight included) or 370 g (water used for cooking or balancing the weight not included); participants were given one serving of a vegetable sample first (shown in grey squares), and they were instructed to consume two additional servings of vegetable samples with cooked rice. CV, cooked vegetable; HRV, homogenised raw vegetable; HCV, homogenised cooked vegetable; CE, cooked eggplant; W, water. * Cooked rice (raw materials: 66·1 g of raw rice and 99·0 g of water). † One serving of cooked vegetable, except CE. ‡ One serving of HRV. § One serving of HCV. || One serving of CE. ¶ 100 g of W.
The test meals were combinations of cooked rice and 300 g of vegetable samples (Table 1). Long-grain fragrant white rice was used and steamed in a single-portion plastic container at 1000 W for 40 min. Each rice portion (66·1 g of raw rice) was cooked individually using 99·0 g of water. The vegetables were prepared as follows. (1) Cooked vegetables were prepared by either boiling or steaming, including steamed eggplant, boiled pak choi and boiled cauliflower. For boiling, well-cut pak choi/cauliflower was placed in a saucepan with 300 g of boiling water, 1·5 g of salt and 2·5 g of sesame oil. Vegetables were cooked for exactly 2 min at a power of 1000 W with an induction cooker. The boiled vegetables were given to the subjects along with the remaining water (about 100 g). For steaming, sliced eggplant was tiled on the removable bottom of an electric steamer (Viva Collection; Philips) and steamed for exactly 10 min. The steamed eggplant was immediately placed on a plate and sprinkled with 2·5 g of oil and 1·5 g of salt. To balance the size of the meals, half a glass of water (100 g) was offered, when participants consumed the steamed eggplant. (2) Homogenised raw vegetables were prepared by putting the raw vegetables in a high-performance blender (WBL1031S; Midea) along with 100 g of water, 2·5 g of oil and 1·5 g of salt and was mashed for exactly 30 s at the top speed (25 000 rpm). (3) Homogenised cooked vegetables were cooked before mashing. The prepared vegetable samples were equally divided into three servings before the blood glucose tests, each serving containing 100 g of raw vegetable (Fig. 1).
Table 1 Composition of test mealsFootnote *
ACHO, available carbohydrate; G, glucose; R, cooked rice; ND, not detected, soluble dietary fibre content <0·01/100 g; CP+R, cooked pak choi with cooked rice; HRP+R, homogenised raw pak choi with cooked rice; HCP+R, homogenised cooked pak choi with cooked rice; CC+R, cooked cauliflower with cooked rice; HRC+R, homogenised raw cauliflower with cooked rice; HCC+R, homogenised cooked cauliflower with cooked rice; CE+R, cooked eggplant with cooked rice; HRE+R, homogenised raw eggplant with cooked rice; HCE+R, homogenised cooked eggplant with cooked rice.
* Proximates were obtained for individual foods (raw pak choi, raw cauliflower, raw eggplant and raw rice) and used to calculate the nutrient composition of the mixed meals.
† For vegetable–rice mixed meals, one portion included three servings (300 g) of vegetable and rice.
‡ Including the water used for cooking or balancing the weight.
§ Not including the water used for cooking or balancing the weight.
Chemical analysis of test meals
The nutrient composition and phenolic compound content of vegetables and rice were analysed as follows. Total starch content was examined using a Megazyme assay kits (Megazyme International Ireland Limited) according to AOAC 996.11. Reducing sugar content was assayed using Lane–Eynon general volumetric method according to AOAC 945.66 and AOAC 923.09. Available carbohydrate content was calculated by the sum of total starch content and reducing sugar content( Reference Ek, Wang and Copeland 24 ). Protein content was estimated using the method of Kjeldahl according to ISO 1871:2009. Total fat content was assessed by ISO 6492:1999. Total dietary fibre, soluble dietary fibre and insoluble dietary fibre contents were examined using an enzymatic–gravimetric method according to AOAC 991.43. Water content was determined according to ISO 1026:1982. Total energy was calculated as described by EU Council Directive 1169/2011( 25 ). Total polyphenol content was determined with Folin–Ciocalteu reagents according to the method of Singleton et al. ( Reference Singleton, Orthofer and Lamuela-Raventós 26 ), and expressed as mg gallic acid equivalent/100 g fresh weight (FW) basis. Total flavonoid content was determined with aluminium trichloride reagents, and expressed as mg rutin equivalent/100 g FW basis( Reference Xu, Yuan and Chang 27 ). Total tannin content was determined using acidified vanillin( Reference Broadhurst and Jones 28 ) and expressed as mg catechin equivalent/100 g FW basis.
Glycaemic response testing subjects
Healthy young women aged between 18 and 24 years with BMI between 20 and 24·9 kg/m2 were recruited through advertisements on the university website. Questionnaires were given to subjects to ensure that all individuals met the following criteria: not pregnant; not in their menstrual period; non-smoker; non-drinker; free from food allergies; stable weight for the past 3 months; regularly eating three meals, not skipping breakfast; not on diet to gain or to lose weight; not on prescription medication in the past 3 months; no metabolic disease or familial history of diabetes; and no impaired glucose tolerance or impaired fasting glycaemia. The sample size was calculated using PASS 13 Power Analysis and Sample Size software (NCSS). It revealed that the test would have 80 % power to examine a difference (P<0·05) with sixteen subjects in incremental AUC (iAUC) of 20·0 mmol/l×2 h. Potential female subjects who met these initial criteria were invited to the laboratory to finish additional exams, including an oral glucose tolerance test and a rice control test, which were tested twice for each subject. All eligible individuals signed informed consent forms. This study was conducted according to the Declaration of Helsinki and carried out at the College of Food Science and Nutritional Engineering, China Agricultural University. The study protocol was approved by the Ethics Committee of China Agricultural University (ethics no. 2016011) and all the subjects signed written informed consent. There was no uncomfortable occasion during the test sessions.
Glycaemic response testing procedures
The study protocol used was in line with the standard procedures recommended by the FAO and the WHO. This study was conducted using a randomised crossover design in which subjects ate test meals in a randomised order on thirteen separate mornings, including nine times for different vegetable–rice mixed meals, twice for glucose control and twice for rice control, with a wash-out period of 1 week between each test session. In all, 1 d (24 h) before each trial day, the participants were instructed to refrain from excessive eating, alcoholic beverages, staying up late and strenuous exercise. The subjects arrived at the laboratory at 08.00 hours, and their baseline blood glucose level was tested after a 10-min rest. The test meals were given to the subjects at 08.15 hours. At the beginning of each test meal, participants were given one serving (equivalent to 100 g of vegetable material) of a vegetable sample first (preload), and they were instructed to consume the preload in 10 min. Then they were given two additional servings of vegetable samples with cooked rice (co-ingestion) and were asked to finish the meal within 20 min. The ingestion time was recorded and the eating rate was calculated as the total energy of a meal (kJ) consumed per unit time (min). The finger-prick blood samples were taken at 30, 45, 60, 90, 120, 150, 180, 210 and 240 min following the start of the test meals (Fig. 2). The second drop of blood was used for testing to avoid possible plasma dilution. Subjects were served 200 ml of water between 90 and 120 min. Subjects were provided with books, magazines and Wi-Fi and were advised to remain seated during the test session. They were not permitted to eat foods that were not related to the experiment or to discuss the test meals. To assess the reliability of the study procedure, the glucose reference and the rice samples were tested twice. Plasma blood glucose was analysed using a ONE TOUCH UltraEasy glucometer (Johnson & Johnson), which used the glucose oxidase method.
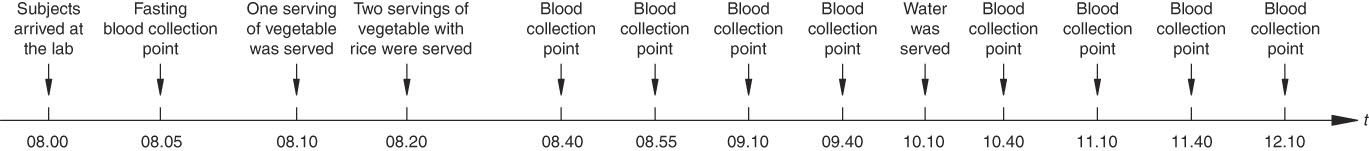
Fig. 2 Glycaemic response test flow.
In vitro determination of starch digestibility
In vitro digestion of starch from the test meals was assessed using a modified Englyst method( Reference Englyst, Veenstra and Hudson 29 , Reference Englyst, Englyst and Hudson 30 ). The enzyme solution was prepared by adding 0·45 g of porcine pancreatic α-amylase (150 U/mg; EC 3.2.1.1; A3176; Sigma) into 16 ml of water at 37°C. The mixture was stirred for 10 min and centrifuged for 10 min. Then, 2 ml of amyloglucosidase (3000 U/ml, EC 3.2.1.3.; Megazyme) was quickly added to 10 ml of the enzyme supernatant. The pre-treatment and cooking procedures of the white rice and vegetables were the same as those used in blood glucose testing. After treatment, a portion of cooked rice and three servings of vegetable samples were mashed together evenly with a Midea high-performance blender at the lowest speed (3000 rpm) for 30 s to simulate chewing. Approximately 500 mg of mash was mixed into 4 ml of sodium acetate buffer (0·1 mol/l, pH 5·1). The mixture was incubated in a shaking water bath (37°C, 200 strokes/min) as soon as 1 ml of the fresh enzyme solution was added. The aliquot (200 μl) from this phase was mixed with 95 % ethanol at 0, 2, 5, 10, 20, 60 and 120 min to stop enzyme activity. Released glucose was analysed using a GAGO20 Glucose Assay Kit (Sigma).
Statistical analysis
The total AUC of postprandial GR (iAUC), the incremental value of peak blood glucose and the maximum amplitudes of glucose excursion in 240 min (MAGE240)( Reference Brandmiller, Stockmann and Atkinson 31 ) were calculated. The iAUC of postprandial GR was determined using the trapezoidal method( Reference Wolever 32 ), ignoring the area beneath the fasting level. The rapidly digestible starch (RDS), slowly digestible starch (SDS), resistant starch (RS) and hydrolysis index (HI)( Reference Englyst, Veenstra and Hudson 29 ) were also calculated. The GI was defined as the iAUC0–120 of the blood glucose response curve of 50 g of the glycaemic carbohydrate portion expressed as a percentage of the response to the same amount of carbohydrate from the glucose as a reference. The GI was calculated from the two iAUC0–120 areas. The data were analysed using SPSS 21.0 software (SPSS Inc.). The Kolmogorov–Smirnov test found that most data were normally distributed, and natural logarithmic transformation was used where data failed to present normality. Then data analysis was performed by one-factor repeated-measures ANOVA, with post hoc analysis when applicable. P values were adjusted for multiple comparisons using the Bonferroni correction. Statistical significance was considered to be P<0·05. The correlation of data was determined using Pearson’s correlation analysis, P<0·05. Data were presented as mean values (standard deviations) or mean values (standard errors) where appropriate.
Results
Chemical composition of test meals
The nutrient composition of raw vegetables is shown in Table 1, and phenolic compound content of vegetable meals (rice not included) is presented in Table 2. CE had the highest total polyphenol and total flavonoid contents. There was no difference between cooked vegetables and homogenised raw vegetables in terms of total polyphenol and total flavonoid contents.
Table 2 Phenolic compound content of test vegetables (per serving, 100 g) (Mean values and standard deviations)
GAE, gallic acid equivalent; RUE, rutin equivalent; CAE, catechin equivalent; CP, cooked pak choi; HRP, homogenised raw pak choi; HCP, homogenised cooked pak choi; CC, cooked cauliflower; HRC, homogenised raw cauliflower; HCC, homogenised cooked cauliflower; CE, cooked eggplant; HRE, homogenised raw eggplant; HCE, homogenised cooked eggplant.
a,b,c,d,e Mean values within a column with unlike superscript letters were significantly different (P<0·05).
* Total polyphenol content is expressed as mg GAE/100 g fresh weight.
† Total flavonoid content is expressed as mg RUE/100 g fresh weight.
‡ Total tannin content is expressed as mg CAE/100 g fresh weight.
Subject enrolment
The study subject flow of both reference food tests and vegetable–rice mixed meals is shown in a Consolidated Standards of Reporting Trials (CONSORT) flow diagram (Fig. 3). A total of sixteen subjects completed all the test meals and reference food, and each subject was a control of themselves. All data were included in analyses.
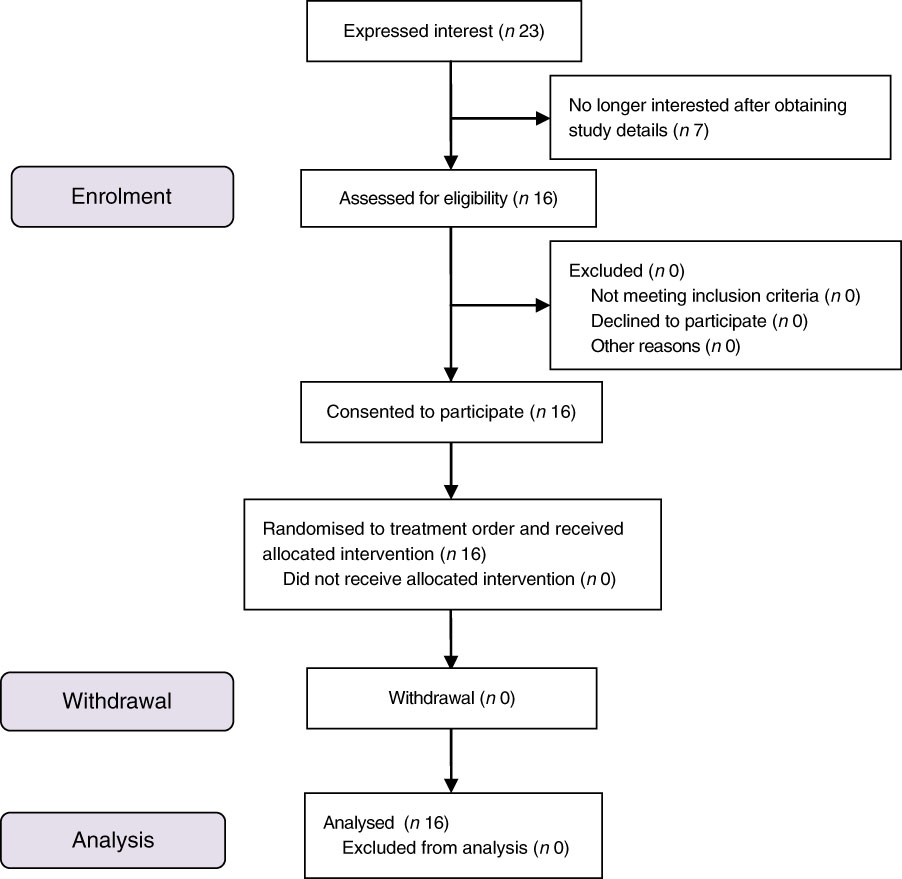
Fig. 3 Consolidated Standards of Reporting Trials (CONSORT) flow diagram of the study subjects.
Subject characteristics
Subject baseline characteristics are shown in Table 3.
Table 3 Subject baseline characteristics (Mean values and standard deviations, n 16)
Blood glucose
The postprandial GR for all test meals are shown in Fig. 4. In all, sixteen subject had a mean fasting blood glucose concentration of 4·8 (se 0·4) mmol/l, and there was no difference among treatments in terms of fasting blood glucose concentrations. All rice-based meals attained peak glucose values at 45 min. Compared with the rice control (7·2 (se 0·2) mmol/l), the CE+R meal had significantly lower glucose levels at both 30 and 45 min (6·5 (se 0·2) mmol/l, P=0·008; 6·7 (se 0·2) mmol/l, P=0·005, respectively), whereas the CP+R and CC+R meals had significantly lower blood glucose values at 60 min (6·4 (se 0·3) mmol/l, P=0·033; 6·4 (se 0·3) mmol/l, P=0·037, respectively). The CP+R and CC+R meals better maintained glucose concentrations than the rice control did during 150–240 min.
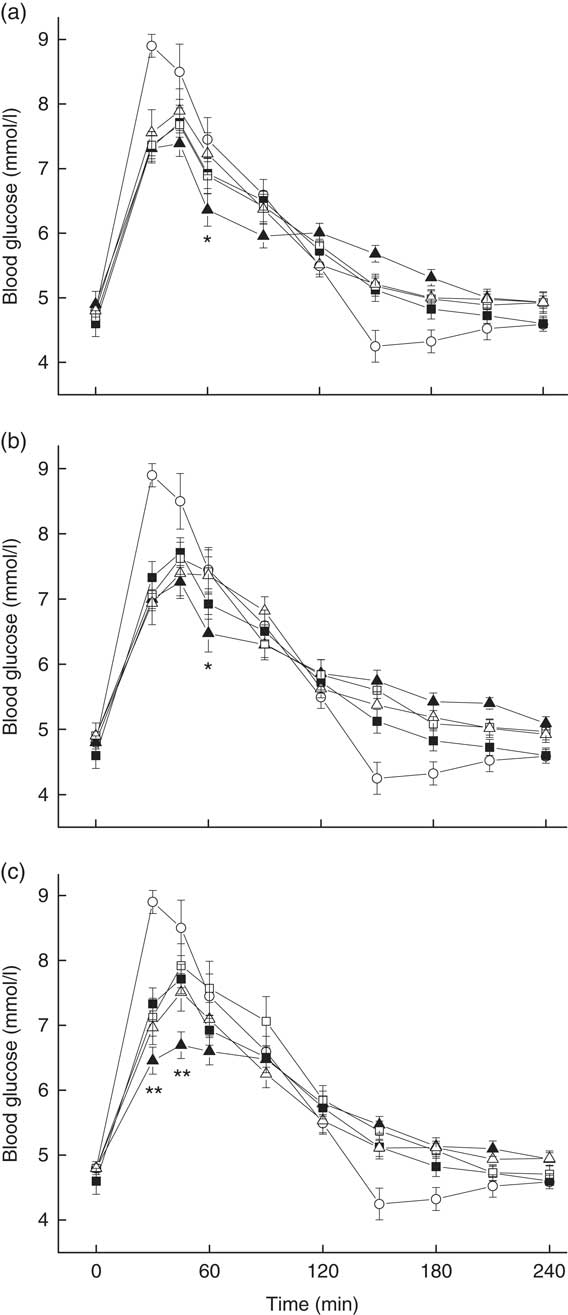
Fig. 4 Postprandial plasma glucose changes in subjects after the consumption of reference food and test meals, including (a) pak choi meals, (b) cauliflower meals and (c) eggplant meals, with glucose and rice as references (![]() , glucose;
, glucose; ![]() , cooked rice;
, cooked rice; ![]() , cooked pak choi with cooked rice;
, cooked pak choi with cooked rice; ![]() , homogenised raw pak choi with cooked rice;
, homogenised raw pak choi with cooked rice; ![]() , homogenised cooked pak choi with cooked rice;
, homogenised cooked pak choi with cooked rice; ![]() , cooked cauliflower with cooked rice;
, cooked cauliflower with cooked rice; ![]() , homogenised raw cauliflower with cooked rice;
, homogenised raw cauliflower with cooked rice; ![]() , homogenised cooked cauliflower with cooked rice;
, homogenised cooked cauliflower with cooked rice; ![]() , cooked eggplant with cooked rice;
, cooked eggplant with cooked rice; ![]() , homogenised raw eggplant with cooked rice;
, homogenised raw eggplant with cooked rice; ![]() , homogenised cooked eggplant with cooked rice). Values are the mean changes in blood glucose levels (n 16), with their standard errors represented by vertical bars. Differences between the cooked vegetable–rice mixed meal and two homogenised vegetables (cooked or raw) are shown (*P<0·05, **P<0·01).
, homogenised cooked eggplant with cooked rice). Values are the mean changes in blood glucose levels (n 16), with their standard errors represented by vertical bars. Differences between the cooked vegetable–rice mixed meal and two homogenised vegetables (cooked or raw) are shown (*P<0·05, **P<0·01).
All three kinds of non-homogenised vegetable–rice mixed meals had significantly reduced GI values compared with the rice control. Compared with ingestion of rice control, ingestion of the CE+R meal significantly reduced the peak, iAUC0–120 and MAGE240 values, which resulted in a medium GI value of 67 without causing a significant reduction in the iAUC120–240 value (Table 4). The iAUC0–120 values of both CE+R and CC+R were significantly smaller than those of the rice control. However, their homogenised counterparts did not show significant reduction in any of the glycaemic characteristics compared with the rice control.
Table 4 Postprandial glycaemic characteristics and eating rates of test meals in 240 min* (Mean values with their standard errors, n 16)
iAUC, incremental AUC; MAGE, maximum amplitudes of glucose excursion; GI, glycaemic index; G, glucose; R, cooked rice; CP+R, cooked pak choi with cooked rice; HRP+R, homogenised raw pak choi with cooked rice; HCP+R, homogenised cooked pak choi with cooked rice; CC+R, cooked cauliflower with cooked rice; HRC+R, homogenised raw cauliflower with cooked rice; HCC+R, homogenised cooked cauliflower with cooked rice; CE+R, cooked eggplant with cooked rice; HRE+R, homogenised raw eggplant with cooked rice; HCE+R, homogenised cooked eggplant with cooked rice.
a,b,c,d Mean values within a column with unlike superscript letters were significantly different (P<0·05).
*The iAUC0–120, iAUC120–120 or iAUC0–240 for postprandial glycaemic response was determined for the time interval in 2 h or 4 h using the trapezoidal method, ignoring the area beneath the fasting level. MAGE240 were determined for maximum amplitude of the glucose excursion in 4 h.
Eating rates
The eating rates of CC+R and CE+R were significantly lower than those of pure rice and rice mixed with homogenised vegetables (Table 4). The eating rates of the meals showed a significant positive correlation with postprandial glycaemic characteristics, including iAUC0–120 values, peak values and MAGE240 values (P<0·01).
In vitro starch digestibility
The amounts of glucose released from rice–vegetable meals and rice alone increased rapidly over 20 min during in vitro digestion and reached plateaus at 60–90 min (Fig. 5). The percentages of in vitro starch hydrolysis of CP+R, CC+R and CE+R were significantly lower than the percentages of the white rice sample at 20 min and beyond. The in vitro starch hydrolysis percentages of CE+R at 20, 60 and 120 min (52·5, 58·3 and 62·2 %) were significantly lower than the percentages of HRE+R (73·8 %, P=0·008; 77·9 %, P=0·006 and 84·4 %, P=0·011) and HCE+R (67·2 %, P=0·001; 72·6 %, P=0·005 and 77·0 %, P=0·002) at the time points mentioned above.
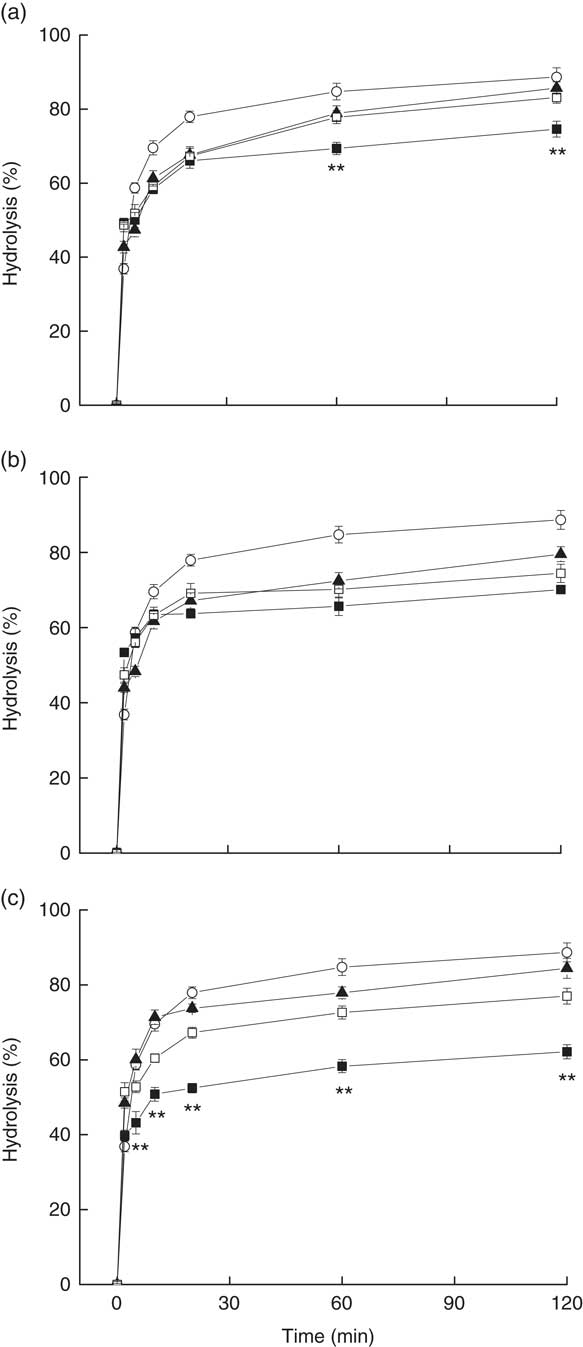
Fig. 5 Rates of in vitro starch hydrolysis of rice mixed with (a) pak choi, (b) cauliflower and (c) eggplant in different treatments, with rice as the reference food sample (G, glucose; ![]() , cooked rice;
, cooked rice; ![]() , cooked pak choi with cooked rice;
, cooked pak choi with cooked rice; ![]() , homogenised raw pak choi with cooked rice;
, homogenised raw pak choi with cooked rice; ![]() , homogenised cooked pak choi with cooked rice;
, homogenised cooked pak choi with cooked rice; ![]() , cooked cauliflower with cooked rice;
, cooked cauliflower with cooked rice; ![]() , homogenised raw cauliflower with cooked rice;
, homogenised raw cauliflower with cooked rice; ![]() , homogenised cooked cauliflower with cooked rice;
, homogenised cooked cauliflower with cooked rice; ![]() , cooked eggplant with cooked rice;
, cooked eggplant with cooked rice; ![]() , homogenised raw eggplant with cooked rice;
, homogenised raw eggplant with cooked rice; ![]() , homogenised cooked eggplant with cooked rice). Values are the mean hydrolysis percentages, with their standard errors represented by vertical bars. Differences between the cooked vegetable–rice mixed meal and two homogenised vegetables (cooked or raw) are shown (**P<0·01).
, homogenised cooked eggplant with cooked rice). Values are the mean hydrolysis percentages, with their standard errors represented by vertical bars. Differences between the cooked vegetable–rice mixed meal and two homogenised vegetables (cooked or raw) are shown (**P<0·01).
Among all test meal samples, the HI value and RDS content of CE+R were the lowest, whereas the RS fraction of CE+R was the highest (Table 5). The addition of CC, CP, HRC and HRE increased the RS content, whereas the ingestion of HCC, HCP and HRP with rice caused an increase in SDS content. However, none of the homogenised vegetable samples increased the RS contents of the meals. A good consistency between HI in vitro and GI in vivo was observed (r 0·727, P=0·17).
Table 5 Hydrolysis index and constituents of starch fractions of meal samples (Mean values and standard deviations)
RDS, rapidly digestible starch; SDS, slowly digestible starch; RS, resistant starch; HI, hydrolysis index; R, cooked rice; CP+R, cooked pak choi with cooked rice; HRP+R, homogenised raw pak choi with cooked rice; HCP+R, homogenised cooked pak choi with cooked rice; CC+R, cooked cauliflower with cooked rice; HRC+R, homogenised raw cauliflower with cooked rice; HCC+R, homogenised cooked cauliflower with cooked rice; CE+R, cooked eggplant with cooked rice; HRE+R, homogenised raw eggplant with cooked rice; HCE+R, homogenised cooked eggplant with cooked rice.
a,b,c,d Mean values within a column with unlike superscript letters were significantly different (P<0·05).
* The percentage of RDS, SDS or RS belonging to total starch.
Discussion
A number of previous studies reported that adding vegetables to a high-GI meal could exert a glycaemic mitigation effect( Reference Kasuya, Okuyama and Yoshida 16 , Reference Tiwari, Jyothi and Tejeswini 17 , Reference Ballance, Knutsen and Fosvold 23 , Reference Gustafsson, Asp and Hagander 33 ), but, to our knowledge, the present study is the first study to compare the postprandial GR of non-homogenised and homogenised vegetables added to rice-based meals.
In this study, both the in vivo postprandial blood glucose tests and the in vitro carbohydrate digestion assays demonstrated that, compared with their homogenised counterparts, non-homogenised low-fat cooked vegetables could contribute more effectively to slow the carbohydrate digestion process or mitigate the postprandial GR. Co-ingestion of three servings (300 g of vegetable) of non-homogenised low-fat cooked pak choi, cauliflower and eggplant significantly lowered the GI values of rice-based meals, whereas the homogenised vegetables failed to achieve significant reduction in GI values. The outcomes of in vitro carbohydrate digestibility of vegetable–rice mixed meals echoed the results of the human blood glucose tests. These results strongly support our research hypothesis – that is, the natural texture of vegetables might play an important role in GR and starch hydrolysis, as the homogenised vegetables, either cooked or uncooked, failed to render comparable glycaemic effects to their non-homogenised cooked counterparts in the first hour after the meal.
Some previous studies reported that both vegetables and vegetable juice might have simultaneous positive effects on GR and insulinaemic responses( Reference Kasuya, Okuyama and Yoshida 16 , Reference Gustafsson, Asp and Hagander 33 ). It was reported that a meal with 164 g of spinach elicited significantly lower insulin and C-peptide responses than the control meal did( Reference Gustafsson, Asp and Hagander 13 ). Compared with a meal consisting of 200 g of boiled rice, a mixed meal consisting of 200 g of rice and 120 g of Chinese cabbage had a 14·6 % lower incremental area above the blood insulin curve over 120 min( Reference Sun, Ranawana and Leow 14 ). In light of these results, the blood-glucose-suppressing effect of vegetables could not be attributed to raising insulin level, although the plasma insulin was not measured in the present study. The mechanism of glycaemic attenuation of vegetables might partly be explained by their slow ingestion, the dietary fibre’s delaying effect on gastric emptying( Reference Yu, Ke and Li 18 , Reference Gopirajah, Raichurkar and Wadhwa 19 ) and the polyphenol’s carbohydrate digestion( Reference Kim, Keogh and Clifton 34 ).
It is noteworthy that the meals added with non-homogenised vegetable had significantly lower ingestion rates compared with their homogenised counterparts. Low eating rates might increase the level of anorexigenic gut peptide glucagon-like peptide 1 and peptide YY, and these peptide hormones have an important role to play in enhancing the glucose-stimulated insulin secretion( Reference Kokkinos, Le and Alexiadou 35 – Reference Kokkinos, Roux and Alexiadou 37 ). It was reported that eating slowly and more chewing were associated with reduced GR and HbA1c and lower risk of diabetes( Reference Yamazaki, Yamori and Asai 38 ). In contrast, eating fast might be associated with insulin resistance in middle-aged individuals( Reference Otsuka, Tamakoshi and Yatsuya 39 ).
The contribution of dietary fibre on glycaemic control has been well established. Soluble fibre such as pectin may absorb water, swell, become viscous and then establish a physical barrier between foods and digestion enzymes( Reference Cassidy, McSorley and Allsopp 40 ). It is reported that pectin could delay gastric emptying of both liquid and solid meals by increasing the viscosity of the meals in normal human subjects while not causing significant variations in plasma insulin levels in healthy subjects( Reference Sandhu, Samahi and Mena 41 ). In an animal study, pectin extracted from citrus improved glucose tolerance through regulation of the phosphoinositide 3-kinase/protein kinase B (PI3K/Akt) signalling pathway( Reference Liu, Dong and Yang 42 ). Soluble dietary fibre could be fermented to generate SCFA, which would up-regulate GLUT-4 and attenuate the postprandial GR( Reference Galisteo, Morón and Rivera 43 ).
However, the vegetable’s texture itself could be an important factor to affect GR. Compared with liquid and semisolid foods, solid foods may have longer gastric emptying times( Reference Okabe, Terashima and Sakamoto 44 , Reference Gonlachanvit, Chey and Goodman 45 ), which in turn delay the absorption of glucose into blood( Reference Ballance, Knutsen and Fosvold 23 ). There is a randomised trial which proved that the physicochemical properties of dietary fibre influenced fibre's capacity for reducing appetite and energy intake when added to a diet as preload, because gelled pectin was more effective compared with the liquid pectin solution, though both the gelled and viscous liquid pectin lowered insulin responses( Reference Wanders, Feskens and Jonathan 46 ).
With the popularity of high-performance blenders in the modern kitchen, homogenised and juiced vegetables (semisolid or liquid) are often consumed instead of traditionally prepared vegetable dishes in many families, especially among young people who are less likely to cook at home. It should be noted that, with respect to their glycaemic benefits, homogenised vegetables may not be as effective as vegetable dishes in which the natural structure is well preserved.
In addition to the effect of fibre, the polyphenols in vegetables have the potential to inhibit the activity of carbohydrate digestion enzymes, such as α-amylase and α-glucosidase( Reference Tan and Chang 47 ). In an in vitro study, polyphenols from eggplant strongly inhibited α-amylase and α-glucosidase activities and thus provided a strong biochemical basis for management of hyperglycaemia-induced pathogenesis( Reference Kwon, Apostolidis and Shetty 48 ). There is evidence that the absorbed polyphenols might up-regulate GLUT-4 in skeletal muscle, PI3K in muscle and adipocytes and AMP-activated protein kinase in muscle, adipocytes, pancreas and liver, which would help to improve glucose homoeostasis( Reference Kim, Keogh and Clifton 34 ).
In this study, the steaming treatment of CE could maximise the phenolic retention, whereas the boiling treatment of CC and CP minimises the loss of polyphenols by the addition of a small amount of water and serving with the remaining water. In an animal study, it was also reported that the polyphenol content, the intestinal α-glucosidase inhibitory activity and the anti-glycation potential of green Amaranthus leafy juice were either enhanced or unchanged after cooking( Reference Kumar, Anusha and Oruganti 21 ).
The timing of ingestion of vegetables might make a difference in terms of glycaemic effect. A study found that co-ingestion of 75 g of spinach with fat-rich and starch-rich meals failed to achieve a lowered GR in both healthy and obese subjects( Reference Wolever 32 ), whereas another study reported that as little as 60 g of spinach or broccoli significantly lowered the iAUC of GR when taken as a side dish before the ingestion of starchy food( Reference Kameyama, Maruyama and Matsui 49 ). In this study, one serving of the vegetable was given before the ingestion of rice, as the effects of eating vegetables before carbohydrate foods on glucose excursions was elaborated by Imai et al.( Reference Imai, Matsuda and Hasegawa 15 ).
It is noticed that the CE+R meal had the lowest GI, peak and MAGE values among all GR test meals, and had the highest RS and lowest RDS in the in vitro digestion tests. Starchy foods of low RDS and high RS tend to result in relatively low postprandial GR( Reference Kuma, Sahoo and Baisakha 50 ), and have the potential to enhance insulin sensitivity. Not coincidently, eggplant had the highest total polyphenol and total flavonoid contents, and the highest fibre content among the three vegetables. As eggplant is rich in polyphenols( Reference Niño-Medinaa, Urías-Oronab and Muy-Rangelc 51 ) and fibre, it has been recommended by the National Diabetes Education Program of National Institute of Health, Mayo Clinic and American Diabetes Association for management of type 2 diabetes( 52 ).
However, given the fact that both the polyphenol and dietary fibre did not have any substantial loss after homogenisation, the difference of glycaemic effect among the three test samples of a same vegetable could only be explained by the divergence in physical structure. In light of this result, it is suggested that the strong GR mitigating effect of vegetables depends on the natural physical structure. The underlying mechanism requires further investigation.
This study has several limitations. First, the human subjects were healthy young Asian women of normal BMI and body fat percentages. Males, overweight and obese people and people with impaired blood glucose tolerance were excluded to avoid the confounders brought by differences in sex or metabolic status. The blood glucose modulation effect of vegetables may be more positive in abdominal obese people and prediabetic people, and thus deserve further investigation. Second, the gastric emptying rates, insulinaemic responses and gastrointestinal hormones were not determined in this study, although they would provide a more convincing explanation of glycaemic control mechanisms of the vegetable–rice mixed diet. Third, we only examined the effect of large amounts (300 g) of non-homogenised and homogenised vegetable on GR and starch digestion, and the effect of small amounts of vegetable was not evaluated. As mentioned above, the impact of small amounts remained controversial. Finally, although we analysed the polyphenols and dietary fibre, the biological active compounds such as solanine in eggplant and glucosinolates in cauliflower and pak choi, which might exert a positive role in GR, were not tested.
In conclusion, we found that both in vitro and in vivo tests supported the hypothesis that the texture/physical properties of vegetables might be a determinant of vegetables’ postprandial glycaemic effects, whereas multiple factors including the eating rate, polyphenol content and dietary fibre content may play important roles in the underlying glycaemic control mechanisms as well.
Acknowledgements
The authors express their sincere gratitude to all the subjects who participated in the blood test study.
This research received no specific grant from any funding agency, commercial or not-for-profit sectors.
This description will cover the contribution of each author to the research. Z. F. and R. Z. formulated the research question, designed the study and wrote the article; R. Z., M. L., Y. H., L. W., T. Y. and J. L. carried out the experiments. R. Z. analysed the data.
The authors declare that there are no conflicts of interest.


