


Type 2 diabetes is a chronic disease with a high social and economic burden and is the most common form of diabetes. Globally, 463 million (9·3 %) adults had diabetes in 2019, and the number is expected to rise to 578 million by 2030(Reference Saeedi, Petersohn and Salpea1). In the USA, 31 million individuals had diabetes in 2019(Reference Saeedi, Petersohn and Salpea1). Diet is one of the most important factors associated with the burden of type 2 diabetes(Reference Steyn, Mann and Bennett2).
Se is a trace mineral that is vital for the synthesis of Selenoproteins in the body(Reference Ogawa-Wong, Berry and Seale3). These proteins are essential for various functions because of their antioxidant and anti-inflammatory properties. They are also involved in redox homoeostasis and metabolism of the thyroid hormone(Reference Zoidis, Seremelis and Kontopoulos4). Because of its antioxidant property, Se has attracted a lot of attention especially in the field of metabolic diseases including diabetes. In the USA, the recommended daily intake of Se is 55 µg/d for adults(5). The intake of Se in the USA ranges from 60 to 220 µg/d and is well above the recommended intake due to high levels of Se in the soil.(Reference Rayman6,Reference Combs7)
The association between Se status and diabetes has mainly been examined using blood or hair Se(Reference Kohler, Foote and Kelley8). In a systematic review published in 2018, among thirteen observational studies, eight found that Se concentration was positively associated with diabetes(Reference Kohler, Foote and Kelley8). On the other hand, conflicting findings on the association between Se intake and diabetes have been reported. Several epidemiological studies found that Se intake was associated with decreased risk of diabetes(Reference Akbaraly, Arnaud and Rayman9,Reference Wang, Lin and Gao10) . For example, a recent study in Canada suggested that a higher intake of dietary Se is inversely associated with insulin resistance when total dietary Se intake was below 1·6 μg/kg per d(Reference Wang, Lin and Gao10). However, several other studies found that high Se intake was associated with increased risk of diabetes(Reference Stranges, Sieri and Vinceti11,Reference Wei, Zeng and Gong12) . A 16-year prospective cohort study of 7182 Italian women suggested that each increment of 10 µg Se intake was associated with 29 % increase of diabetes risk(Reference Stranges, Sieri and Vinceti11).
Studies on the association between mortality and Se intake are limited and the findings are inconsistent(Reference Jayedi, Rashidy-Pour and Parohan13,Reference Sun, Shu and Li14) . No study has examined the interaction between Se intake and diabetes in relation to mortality. Using data from the National Health and Nutrition Examination Survey (NHANES) 2003–2014, this study aimed to (1) explore the association between Se intake, diabetes and mortality in the US general population; (2) examine the interaction between Se intake and diabetes in relation to all-cause and cause-specific mortality.
Methods
NHANES is a cross-sectional survey that uses a multistage probability sampling technique to select a sample that is representative of the non-institutionalised population in the USA. The data are collected using a variety of methods including interviews, questionnaires, laboratory testing and physical examination. Interviews were conducted in each participants’ home, while mobile examination centres were used to conduct physical examination and collect blood samples. The detailed description of the methods used can be found elsewhere(Reference Johnson, Paulose-Ram and Ogden15). National Centre for Health Statistics Institutional Ethics Review Board approved the study, and a written consent was taken from all the participants. The data used in the present study were downloaded from NHANES website (https://www.cdc.gov/nchs/nhanes/index.htm).
Study design and sample
In the current analysis, data from six survey cycles (2003–2004, 2005–2006, 2007–2008, 2009–2010, 2011–2012 and 2013–2014) were used. In total, there were 61 087 participants from the combined cycles (Fig. 1). Participants below the age of 20 were excluded from the study. Those with extreme values of dietary intake (Se intake < 5 or > 400 µg/d) or with missing values of BMI and physical activity were also excluded from the study. We used Goldberg cut-offs to exclude those misreported energy intake (EI)(Reference Black16). Over-reporters and under-reporters were defined as EI: BMR > 2·49 or EI:BMR < 0·96, respectively. BMR was estimated using Schofield’s age- and sex-specific equations based on height and weight(Reference Schofield17). The final analytical sample for cross-sectional analysis included 18 932 participants. The analytical sample for mortality analysis included 18 910 participants after excluding those with missing data on mortality.
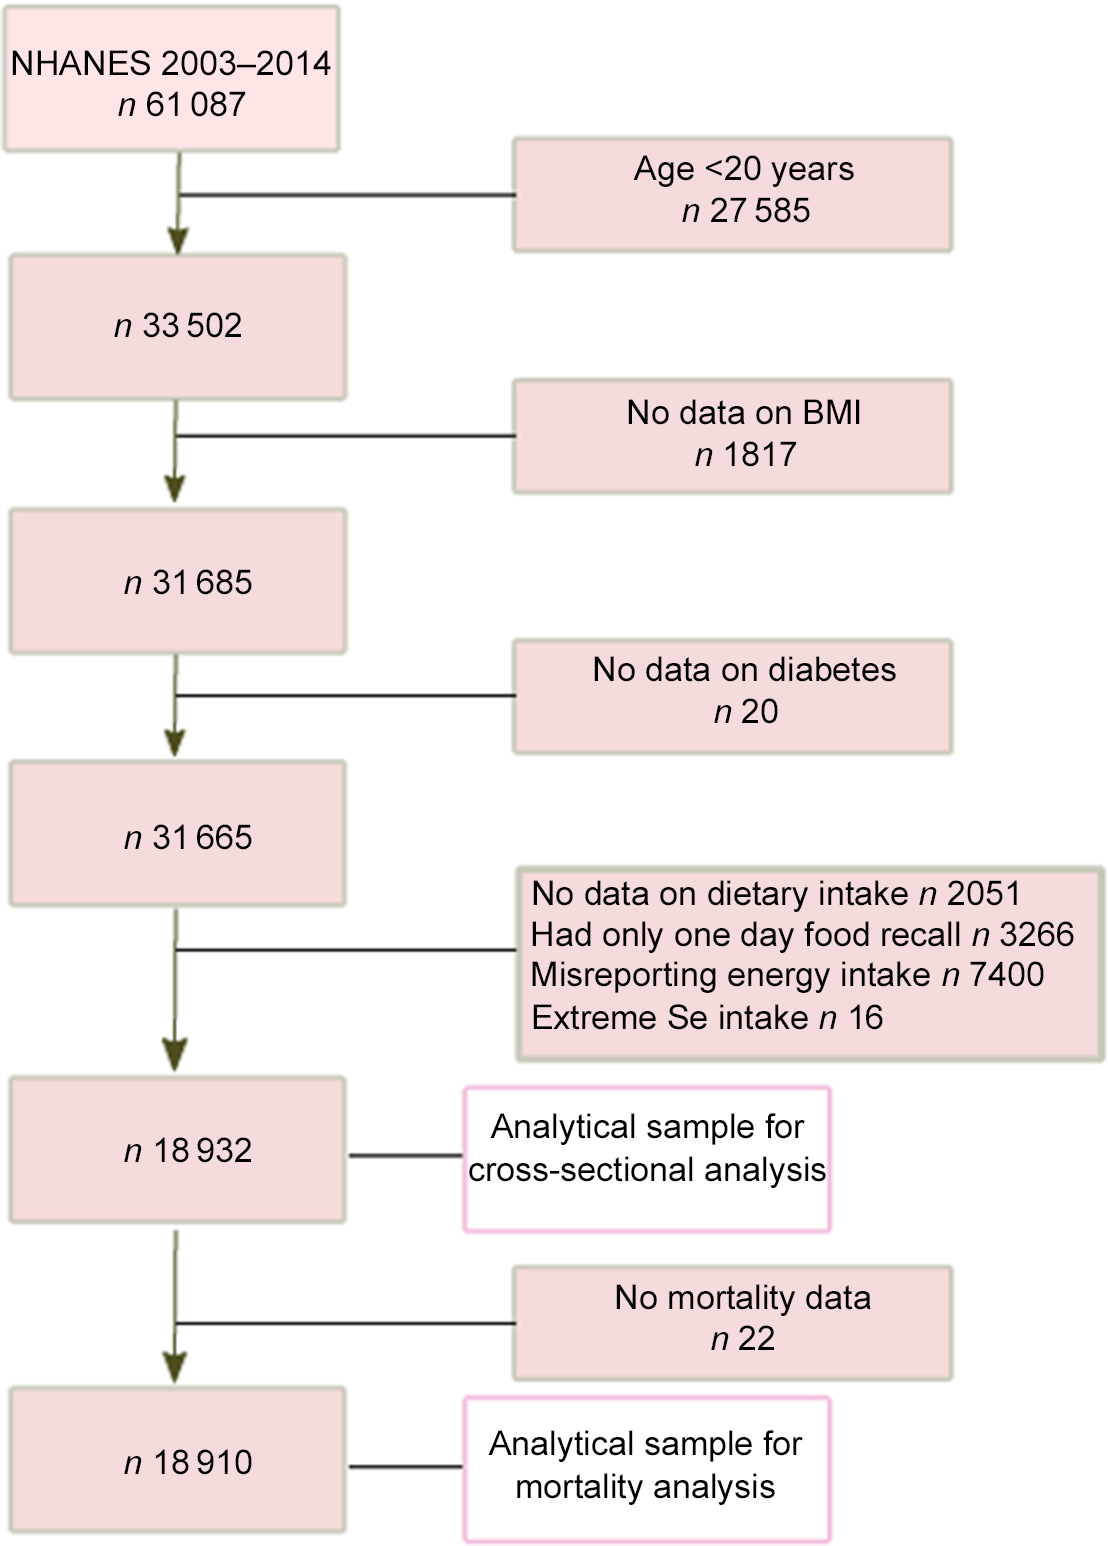
Figure 1. Sample selection process flow chart.
Outcome variable: diabetes and mortality status
Diabetes was defined as having fasting glucose ≥ 126 mg/dl, HbA1c ≥ 6·5 % or 2-h plasma glucose ≥ 200 mg/dl during an oral glucose tolerance test (OGTT) or self-reported doctor-diagnosed diabetes(18). Information on mortality was ascertained via probabilistic matching to the death certificates from the National Death Index recorded up to 31 December 2015(19). The cause of death was coded as per the International Classification of Diseases, Tenth Revision. Mortality was classified as CVD related (ICD codes: I00–I99), cancer-related (ICD codes: C00–C97) and other-cause (including non-cancer and non-CVD diseases). This method has been validated and used in many reports(Reference Heron20,Reference Garcia, Bastian and Rossen21) .
Exposure variable: dietary intake of selenium
Food intake in NHANES was interviewed for two non-consecutive days. The first interview was conducted in-person and the second interview was conducted via phone call. In the current analysis, we used the mean food intake of 2 d. The participants provided details of the meals they consumed in the past 24 h, and each nutrient was estimated using Food and Nutrient Database for Dietary Studies published by the US Department of Agriculture(Reference Ahluwalia, Dwyer and Terry22).
Covariates
The following variables were considered as covariates in this study: age, sex, race (whites, blacks, Mexican Americans, other race), education level (lower than high school, graduated from high school or equivalent institution, any college and college graduate or above), leisure time physical activity (MET min/week), smoking status (non-smoker, ex-smoker and current smoker), alcohol intake and BMI. Age, sex, ethnicity, education level, smoking status and alcohol intake were self-reported. Poverty income ratio was calculated by dividing the income of the family by poverty threshold of the family and was categorised to < 1·3 (low), 1·3–3·5 (moderate) and > 3·5 (high)(Reference Ogden, Carroll and Fakhouri23). Individuals were considered to be hypertensive if they met any of the following conditions: self-reported doctor’s diagnosis of hypertension, currently taking antihypertensive medications, systolic blood pressure ≥ 140 mmHg or diastolic blood pressure ≥ 90 mmHg(Reference Chobanian, Bakris and Black24). Dietary supplement use was assessed by the question ‘Have you used or taken any vitamins, minerals or other dietary supplements in the past month? 1) Yes, 2) No, 7) Refused, 9) Don’t know’.
Statistical analyses
The dietary Se intake was categorised into quartiles with quartile 1 (Q1) and quartile 4 (Q4) as the lowest and highest intake, respectively. Sample characteristics were presented as means and standard deviations or as percentages, and the differences in subject characteristics were determined using one-way ANOVA or χ 2 tests. Survey weights, sample strata and sample clusters were incorporated in the survey statistical procedures to account for the complex multistage probability sampling. Six-wave weights (2003–2014) were created by simple linear scaling of the 2-year weights. Logistic regression models adjusted for multivariable were used to determine association between quartiles of Se intake and diabetes. Follow-up duration was calculated as the difference between the survey date and the last known date alive or censored from the linked mortality file. Multivariate Cox proportional hazards regression was performed, to analyse mortality outcomes and to estimate differences in all-cause, CVD mortality, cancer mortality and other mortality according to quartiles of Se intake. Three models were used in both logistic and Cox regression analyses: model 1 was adjusted for age, sex and EI; model 2 was further adjusted for race, intake of fat, leisure time physical activity, education, income, smoking, alcohol drinking and dietary supplement use; model 3 was further adjusted for BMI (continuous) and hypertension. The variables included in the multivariable models were either socio-economic factors or known risk factors for diabetes or mortality. The Kaplan–Meier survival analysis was used to determine survival by quartiles of Se intake. Subgroup analyses (by diabetes status) were conducted to assess the association between Se intake and mortality. The interaction between diabetes, sex, ethnicity, dietary supplement use and Se intake was assessed by adding the product term of the two in the multivariable model. In sensitivity analyses, we treated Se intake as a continuous variable in a fully adjusted model. All the analyses were performed using STATA (Version 16.1, Stata Corporation).
Results
The basic characteristics of the participants according to quartiles of Se intake are presented in Table 1. The unweighted mean Se intakes in the highest and lowest quartiles were 182·8 (sd 37·4) and 70·6 (sd 12·4) µg/d, respectively. Across the quartiles of Se intake from low to high, the intake of macronutrients, leisure time physical activity, alcohol drinking and income-to-poverty ratio increased but the mean age decreased. Nearly 75 % of the participants in the highest quartile of Se intake were males, while around 73 % of the participants were females in the lowest quartile of Se intake. There was a significant difference in BMI across different levels of Se intake: high intake of Se had a high BMI. However, the prevalence of diabetes was similar across quartiles of Se intake.
Table 1. Sample characteristics by quartiles of Se intake among participants attended NHANES 2003–2014 (n 18 932) (Numbers and percentages)*
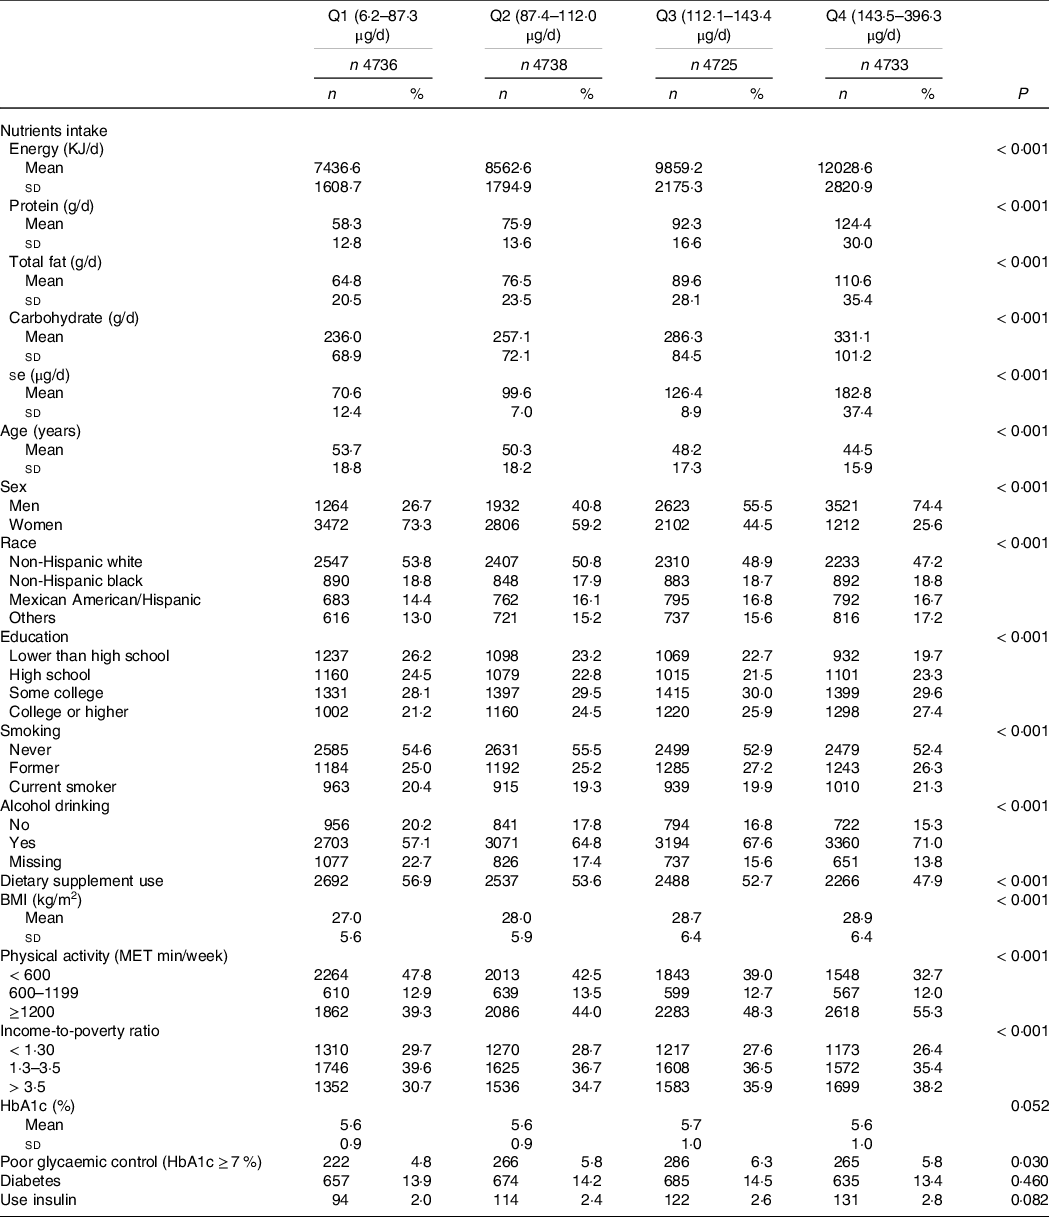
* Data are presented as means and standard deviations for continuous measures and n (%) for categorical measures.
Association between selenium intake and diabetes
Se intake was positively associated with diabetes (Table 2). After adjusting for age, sex and EI, the OR for diabetes across the quartiles of Se intake were 1·00, 1·20 (95 % CI 0·97, 1·49), 1·42 (95 % CI 1·15, 1·74) and 1·62 (95 % CI 1·28, 2·05), respectively. The association was not materially changed after further adjusting for other lifestyle factors including smoking, alcohol drinking, physical activity, dietary supplement use and BMI or hypertension. In the fully adjusted model, the OR for diabetes across the quartiles of Se intake were 1·00, 1·17 (95 % CI 0·92, 1·49), 1·21 (95 % CI 0·94, 1·55) and 1·44 (95 % CI 1·09, 1·89) (P for trend 0·014), respectively. No interaction between Se intake, sex, ethnicity and dietary supplement use in relation to diabetes was found (data not shown). In sensitivity analysis using Se intake as a continuous variable, per 100 µg/d increment of Se intake had an OR of 1·43 (95 % CI 1·17, 1·74) for diabetes (P < 0·001).
Table 2. Association for diabetes by quartiles of Se intake among participants attended the NHANES 2003–2014 (n 18 932) (Odds ratio; 95 % confidence intervals)*
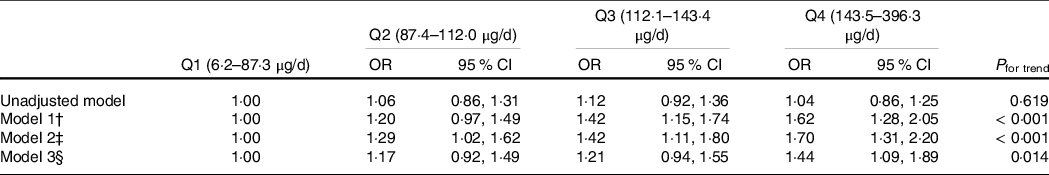
* Values are OR (95% CI) from multivariable logistic regression.
† Adjusted for age, sex and energy intake.
‡ Further adjusted for race, intake of fat, leisure time physical activity, education, income, smoking, alcohol drinking and dietary supplement use.
§ Further adjusted for BMI (continuous) and hypertension.
Association between selenium intake and mortality
During a total of 125 232 person-year follow-up, there were 1627 deaths (312 CVD, 386 cancer, 759 other). The mean follow-up was 6·6 years. Se intake was inversely associated with all-cause mortality (Fig. 2). The incidences of all-cause mortality were 12·47, 9·06, 7·13 and 5·33 per 1000 person-years across quartiles of Se intake from low to high (Table 3). There was a dose–response inverse relationship between Se intake and all-cause mortality with hazard ratios (HR) of 1·00, 0·85 (95 % CI 0·70, 1·04), 0·75 (95 % CI 0·61, 0·93) and 0·77 (95 % CI 0·59, 1·01) across the quartiles of Se intake (P for trend 0·024). No significant association between Se intake with CVD mortality or cancer mortality was found. However, Se intake was inversely associated with other cause mortality. When comparing the extreme quartiles of Se intake, the HR for other mortality was 0·60 (95 % CI 0·40, 0·89) in the fully adjusted model. In sensitivity analysis using Se intake as a continuous variable, per 100 µg /d increment of Se intake had an HR of 0·75 (95 % CI 0·60, 0·95) (P 0·015) for all-cause mortality.
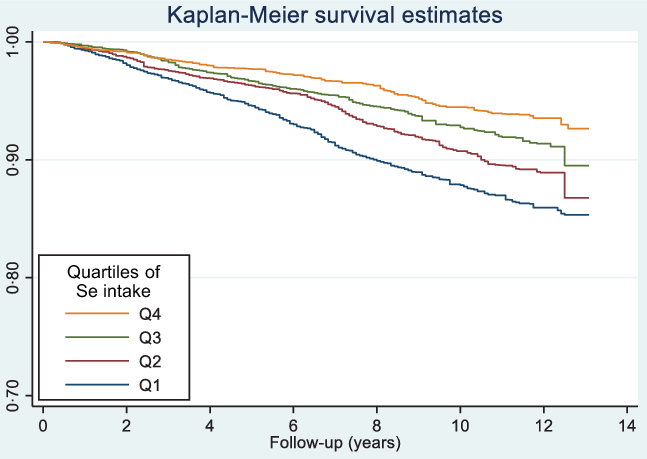
Figure 2. Kaplan–Meier survival curve of all-cause mortality by quartiles of Se intake among participants attended NHANES 2003–2014 (n 18 910).
Table 3. Hazard ratio (95% CI) for different types of mortality by quartiles of Se intake among participants attended NHANES 2003–2014 (n 18 910) (Hazard ratios; 95 % confidence intervals)
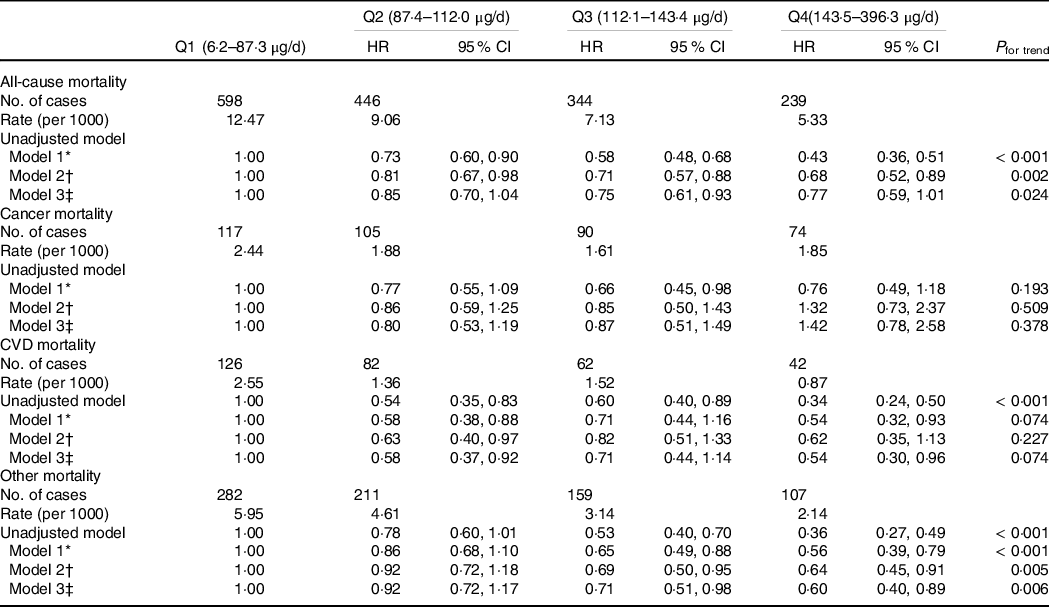
* Adjusted for age, sex and energy intake.
† Further adjusted for race, intake of fat, leisure time physical activity, education, income, smoking and alcohol drinking.
‡ Further adjusted for BMI (continuous) and hypertension.
Interaction between diabetes, sex, ethnicity and selenium intake
There was a significant interaction between ethnicity and Se intake in relation to all-cause mortality (Fig. 3). The inverse association between Se intake and all-cause mortality was only observed in white ethnicity. No interaction between Se intake, sex and diabetes was found in relation to all-cause mortality. However, if we used the first-day food recall data without excluding misreporting of EI, there was a significant interaction between Se intake and sex and diabetes. The inverse association between Se intake and all-cause mortality was only observed in women and those without diabetes (data not shown). No interaction between dietary supplement use and Se intake was found (data not shown).
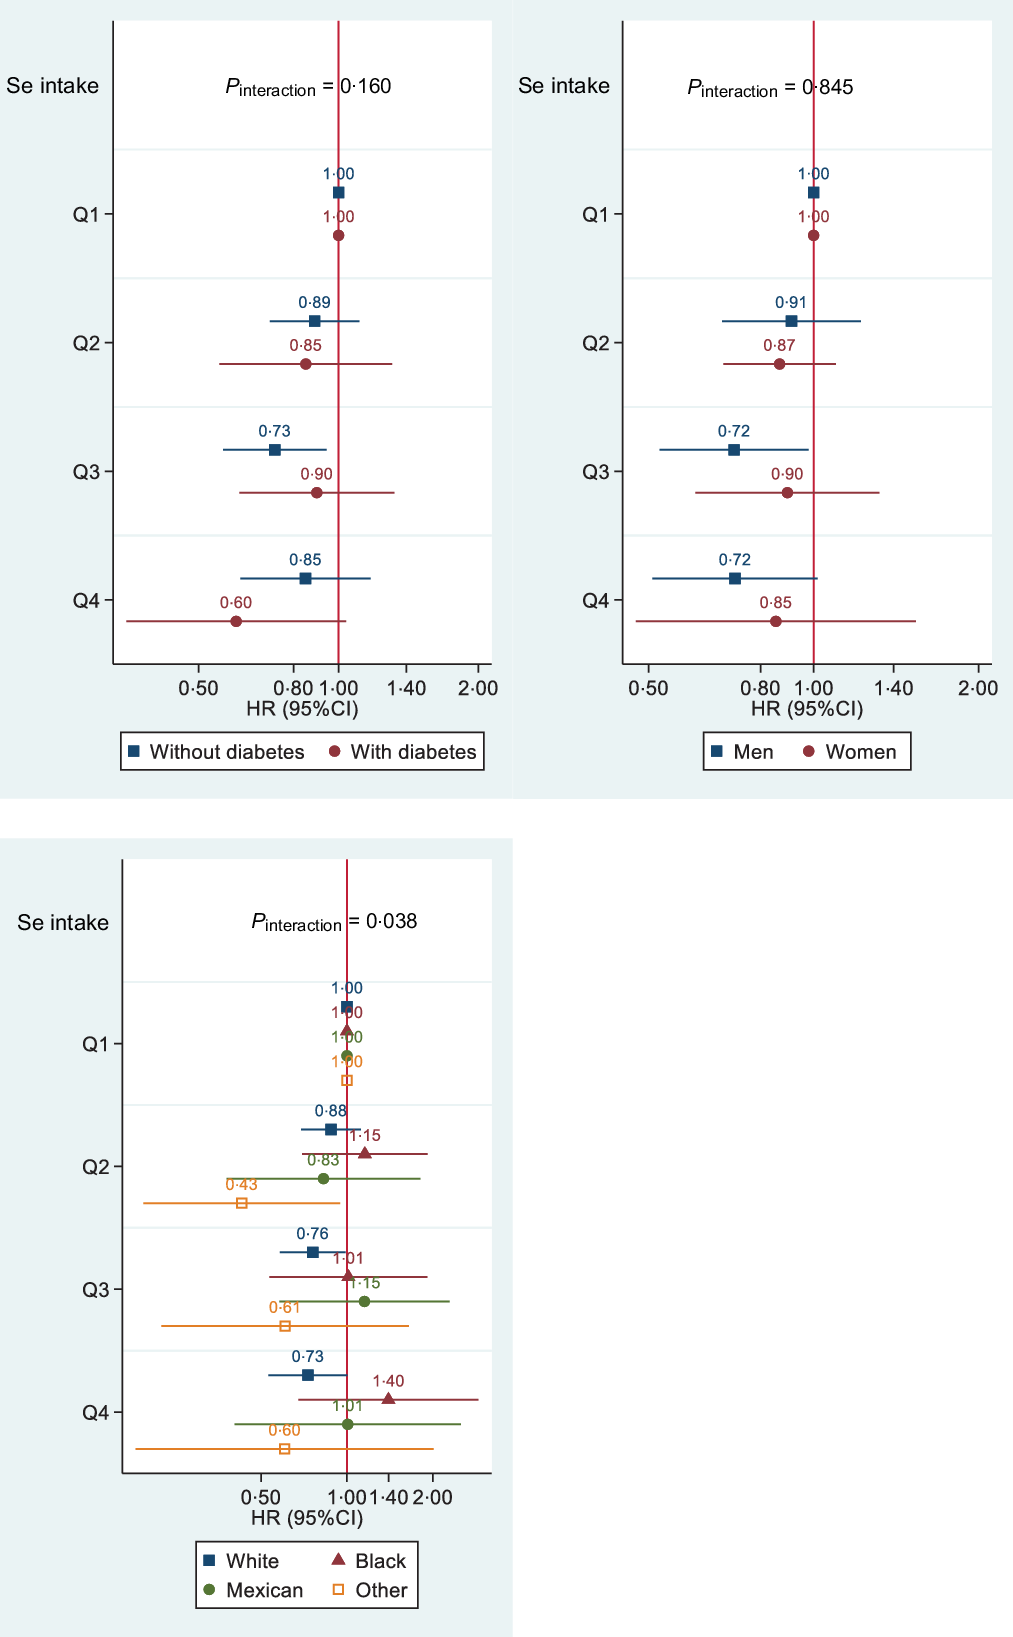
Figure 3. Association between quartiles of Se intake and all-cause mortality by diabetes status, sex and race among participants attending NHANES 2003–2014 (n 18 910). Models were adjusted for age, sex, race, intake of fat and energy, leisure time physical activity, education, income, smoking and alcohol drinking, BMI (continuous) and hypertension. Stratification variables were not adjusted in corresponding models. HR for diabetes and quartiles of Se interaction was 1·04 (95 % CI 0·62, 1·72), 1·60 (95% CI 1·06, 2·41) and 1·15 (95% CI 0·69, 1·91) for quartiles 2, 3 and 4, respectively. HR for sex and quartiles of Se interaction was 0·90 (95% CI 0·63, 1·27), 1·11 (95% CI 0·67, 1·83) and 0·97 (95% CI 0·54, 1·75) for quartiles 2, 3 and 4, respectively. HR for Se intake (continuous) and race interaction was 1·006 (95% CI 1·002, 1·010), 1·008 (95 % CI 1·004, 1·012), 1·009 (95 % CI 1·004, 1·014) for non-Hispanic black, Mexican American/Hispanic and others, respectively.
Discussion
In this study, the association between Se intake and diabetes was investigated in a representative sample of the US population aged 20 years and above. Data collected from six cycles of NHANES from 2003 to 2014 demonstrated a significant positive association between Se intake and diabetes. During a mean of 6·6 years follow-up, Se intake was inversely associated with all-cause mortality. Compared with low intake of Se intake, high intake was associated with 23 % reduced risk of all-cause mortality. The association between Se intake and mortality was only seen for causes other than CVD/cancer and was only among white. There was a significant ethnicity and Se intake interaction in relation to all-cause mortality.
Our findings suggested a higher intake of Se is associated with an increased prevalence of diabetes. The findings are consistent with the existing limited number of studies that have assessed the association between dietary Se intake and diabetes(Reference Stranges, Sieri and Vinceti11,Reference Wei, Zeng and Gong12,Reference Pounis, Costanzo and Persichillo25) . A study conducted in Italian adults showed that each increment of 50 µg/d dietary Se intake was associated with an increase in fasting blood glucose concentrations by 0·14 mmol/l and 0·11 mmol/l in men and women, respectively(Reference Pounis, Costanzo and Persichillo25). In a cross-sectional study of 5423 Chinese adults, compared with low intake of Se, high intake (highest quartile) was associated with an increased likelihood of having diabetes (OR 1·52, 95 % CI 1·01, 2·28)(Reference Wei, Zeng and Gong12). It is worth noting that participants in the Chinese study had an average daily dietary Se intake of 43·51 μg/d, which is much lower than the intakes in the US population.
Se supplementation has been found to be positively associated with diabetes(Reference Stranges, Marshall and Natarajan26–Reference Vinceti, Filippini and Rothman28). A meta-analysis of experimental studies revealed 11 % increased risk of diabetes in people supplemented with Se as compared with placebo(Reference Vinceti, Filippini and Rothman28). Furthermore, a randomised, placebo-controlled trial indicated adverse effects of Se supplementation on plasma glucose homoeostasis in patients with type 2 diabetes(Reference Faghihi, Radfar and Barmal27).
Although the mechanisms of the positive association between Se and diabetes are not clear, evidence from animal studies provides some clues. Se is known for its antioxidant properties. However, the safe window of Se seems to be narrow. Some Se compounds are associated with the generation and accumulation of reactive oxygen species, which ultimately leads to insulin resistance(Reference Misra, Boylan and Selvam29–Reference Wang, Zhang and Chen31). High intakes of Se promote activities of the enzymes containing Se (e.g. glutathione peroxidase 1, Selenoprotein S and Selenoprotein P)(Reference Ogawa-Wong, Berry and Seale3,Reference Zhou, Huang and Lei32) . This up-regulation can interfere in insulin signalling pathways. Increased expression of hepatic Selenoprotein P mRNA was correlated with a reduction in glucose tolerance and high levels of glucose in the fasting stage, both of which are indicative of insulin resistance(Reference Misu, Takamura and Takayama33). In contrast, Selenoprotein P deletion in mice provided protection against insulin resistance and diet-induced obesity(Reference Ogawa-Wong, Berry and Seale3). The role of Selenoprotein P in down-regulating insulin signalling pathways makes it as a drug target for treating diabetes. Metformin, one of the most common drugs prescribed for controlling blood glucose, suppresses Selenoprotein P expression(Reference Speckmann, Sies and Steinbrenner34). Furthermore, the overexpression of these Selenoproteins can lead to over-scavenging of hydrogen peroxide, which can reduce oxidative inhibition of tyrosine phosphatase and counteract insulin signalling pathways(Reference Zhou, Huang and Lei32,Reference Loh, Deng and Fukushima35) .
Despite a positive relation with diabetes in the study, Se intake was inversely associated with all-cause mortality but not with CVD or cancer mortality. The findings are partly in line with other studies(Reference Sun, Shu and Li14). A prospective cohort study among Chinese adults found an inverse association between dietary Se intake and all-cause mortality and CVD mortality(Reference Sun, Shu and Li14). When comparing the extreme quintiles, HR for all-cause mortality was 0·79 (95 % CI 0·71, 0·88) for women and 0·79 (95 % CI 0·70, 0·89) for men; HR for CVD mortality was 0·80 (95 % CI 0·66, 0·98) for women and 0·66 (95 % CI 0·54, 0·82) for men(Reference Sun, Shu and Li14). Most studies on Se status and mortality focused on serum Se and found an inverse association between the two(Reference Bleys, Navas-Acien and Guallar36–Reference Lauretani, Semba and Bandinelli38). In NHANES III, a non-linear inverse association between serum Se levels and all-cause mortality was found(Reference Bleys, Navas-Acien and Guallar36). Increase in serum Se levels up to 130 ng/ml was associated with decreased mortality. In contrast to these findings, a study conducted in LinXian China found no significant association between baseline serum Se (mean = 73 μg/l) and all-cause mortality (RR = 0·93 (95 % CI 0·72, 1·19))(Reference Wei, Abnet and Qiao39).
The underlying biological mechanisms related to high Se intakes and decreased mortality risk remain to be explored. If the inverse association is due to the antioxidant effect of Se, we would expect to see an inverse association with CVD or cancer mortality. However, in the study, no such inverse associations were seen. Further studies with repeated measures of Se intake in different populations should be conducted.
In the analysis using first-day food intake data without excluding those who misreported EI, a significant interaction between Se intake, sex and diabetes was found. However, no such interactions were found when we used the 2-d mean intake and excluded those who misreported EI. It suggests the importance of the use of valid food intake data. The interaction between Se intake and race in relation to all-cause mortality is unexpected. It could be due to residual confounding.
The study has several strengths. Firstly, we used six cycles of NHANES data. The study sample represents the general population. The sample size is large and improves precision of estimates. The findings are generalisable. Secondly, the extensive data on risk factors and cofounding variables for the outcome measures permitted comprehensive adjustments of confounders. However, several limitations also exist that merit consideration. First, the dietary intake was measured via 24-h recalls and did not represent long-term dietary habits. The analysis on the association between Se intake and diabetes was cross-sectional study design. It is not possible to claim any causation. Although we have adjusted a variety of the confounding variables, residual or unmeasured confounding may still exist. In the longitudinal mortality analysis, the use of baseline dietary Se is another limitation. Dietary habits may change over time. Further researches with multiple waves of Se intake are warranted. In the present study, serum Se data were not analysed. However, our findings are supported by other publications on the association between serum Se and diabetes or mortality using data from NHANES(Reference Bleys, Navas-Acien and Guallar36,Reference Laclaustra, Navas-Acien and Stranges40) . Furthermore, diabetes treatment was not adjusted in the analysis. However, in the subgroup analyses, we did not find interaction between Se intake and diabetes in relation to mortality.
Conclusion
High Se intake was positively associated with diabetes but inversely associated with all-cause mortality in the US adults. High Se intakes reduced the risk of all-cause mortality in white but not other ethnicity. There is no interaction between Se intake and diabetes in relation to all-cause mortality. In future research, longitudinal studies with repeated measures of Se intake and serum Se in different populations are warranted to validate the findings.
Acknowledgements
This research uses data from National Health and Nutrition Examination Survey (NHANES).
B. H. contributed to the conception, analysis and interpretation of data; drafting of the report; and has approved the final version for publication. Z. S. contributed to the analysis and interpretation of the data, commented on the report, revising the manuscript and approving the final version for publication. He is the supervisor of the study.
The authors have no conflict of interest.


