


Several studies have analysed individual compounds in faecal samples regarding their association with dietary intake and diseases(Reference Lubinus, Barnsteiner and Skurk1–Reference De Smet, Mensink and Plat3). Faecal animal sterols(Reference Cuevas-Tena, Alegria and Lagarda4), plant sterols(Reference De Smet, Mensink and Plat3, Reference Cuevas-Tena, Alegria and Lagarda4) and bile acids(Reference Reddy2) have been suggested as biomarkers for dietary intake as they can be modified by changes in actual diet(Reference Reddy2, Reference Cuevas-Tena, Alegria and Lagarda4–Reference Ferezou, Gouffier and Coste6). However, it is still unknown whether they also reflect long-term habitual dietary intake.
Exogenous or endogenous cholesterol is metabolised mainly in the liver, and cholesterol and primary bile acids are released via bile secretion into the gut, and undergo further metabolism by the intestinal microbiota to form coprostanol and secondary bile acids (Fig. 1, adapted from Kaddurah et al. (Reference Kaddurah-Daouk, Baillie and Zhu7)). Cholic and chenodeoxycholic acids as the major primary bile acids are synthesised in the liver from cholesterol by side chain oxidation and hydroxylation, conjugated with taurine and/or glycine, and secreted into the small intestine, where 95 % of them get reabsorbed (enterohepatic cycle). The other 5 % reach the large intestine and undergo metabolic transformation by the gut microbiota, forming secondary bile acids, e.g. deoxycholic acid and lithocholic acid and further metabolites of these acids (see e.g. Gerard(Reference Gerard8)).
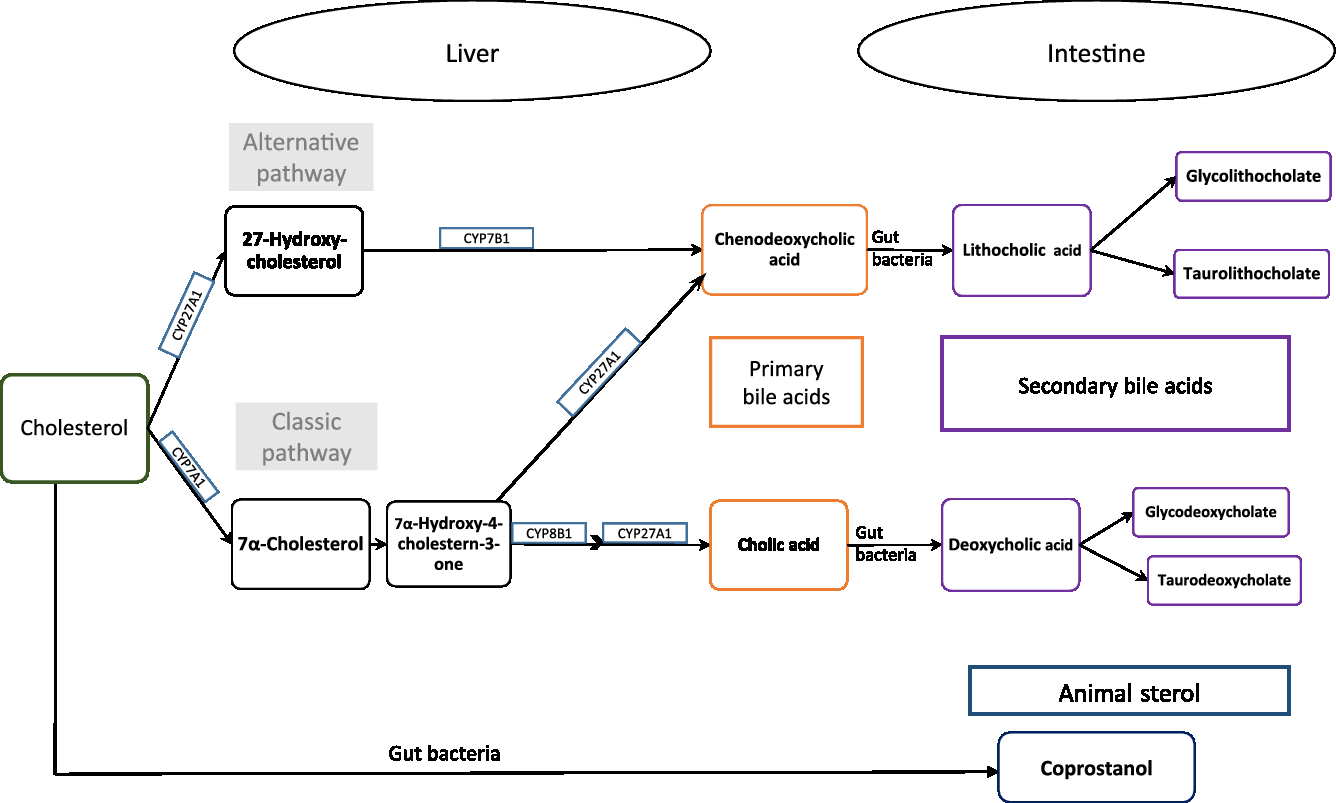
Fig. 1. Cholesterol metabolism pathway. Primary bile acids are produced in the liver by endogenous enzymes in the liver and metabolised into secondary bile acids by intestinal microbiota. Cholesterol is also metabolised to coprostanol by intestinal bacteria with a microbial steroid 5β-reductase enzyme (adapted from Kaddurah-Daouk et al. 2011(Reference Kaddurah-Daouk, Baillie and Zhu7)).
Thus, cholesterol is excreted in faeces either directly or in the form of bile acids. Ferezou et al. (Reference Ferezou, Gouffier and Coste6) described already in the late 1970s that 9·5 % of faecal neutral sterols is cholesterol itself. Among the direct cholesterol metabolites produced in the gut, coprostanol (next to cholestanol and coprostanone) contributes 65 % of faecal neutral sterols(Reference Ferezou, Gouffier and Coste6). From the 5 % of bile acids that reaches the large intestine, metabolites formed by the activity of the gut microbiota are finally excreted in faeces. A detailed description of the metabolic pathway of cholesterol and bile acids, its absorption and excretion in stool is given elsewhere(Reference Gerard8).
Phytosterols, such as stigmasterol or β-sitosterol, are naturally occurring compounds in plant foods and are similar to cholesterol in both structure and biological function. They have an additional ethyl or methyl group at the side chain(Reference Azadmard-Damirchi, Dutta, Preedy and Watson9), and in humans they are obtained only through dietary sources. Thus, dietary intake of plant sterols depends on food consumption habits and differs by population and sex(Reference Klingberg, Ellegard and Johansson10–Reference Escurriol, Mari-Dell’Olmo and Rohlfs12). Vegetable oils are rich in phytosterols; however the serving size of oils is small as compared to the serving sizes of seeds and nuts, grain products, vegetables and fruits(Reference Racette, Lin and Ma5). Campesterol and sitosterol are the most abundant phytosterols in the human diet, unlike their saturated counterparts, campestanol and sitostanol. About 95 % of dietary phytosterols enter the colon(Reference Ling and Jones13), where coprostanol and coprostanone are formed from cholesterol. Sitosterol and campesterol are metabolised to methyl or ethyl coprostanol and methyl or ethyl coprostanone. Absorbed phytosterols from the intestine are excreted faster than cholesterol via biliary secretion, leading to a small pool size of phytosterols compared with animal sterols(Reference Penchala Raju, Aravind Babu and Rakesh Kumar14). According to Gylling & Miettinen(Reference Gylling and Miettinen15), the sum of plant sterols and its derivatives excreted in faeces is proportional to dietary plant sterol intake. Furthermore, the amount of plant sterols consumed does influence the faecal sterol concentrations, since plant sterols enhance cholesterol excretion(Reference Racette, Lin and Ma5).
In the present study, we investigate whether habitual dietary intake, meaning long-term intake, is associated with faecal concentrations of animal sterols, plant sterols and bile acids in participants of the observational, population-based Cooperative Health Research in the Augsburg Region (KORA FF4) study. Such biomarkers of dietary intake would be very helpful in characterising key features of a subject’s habitual diet as well as their effects on metabolism and health.
Materials and methods
Study population and design
The KORA FF4 study (2013–2014) is the second follow-up of KORA S4 (1999–2001), a population-based health survey conducted in the region of Augsburg, Germany(Reference Holle, Happich and Lowel16). Of the 4216 participants aged 25–74 years in KORA S4, 2279 individuals participated in the KORA FF4 survey. The KORA FF4 study was designed to determine changes in lifestyle habits and health status that developed over the follow-up period of, on average, 14 years. This study was conducted according to the guidelines laid down in the Declaration of Helsinki and all procedures involving human subjects were approved by the Ethics Committee of the Bavarian Medical Association (Bayerische Landesärztekammer). Written informed consent was obtained from all participants.
Study participants were invited to the study centre to complete a face-to-face interview (including questions on medication), to undergo physical examinations and anthropometric measurements and to collect bio-specimens.
The flow chart in Fig. 2 illustrates samples sizes and the inclusion and exclusion criteria applied. Stool samples were collected from all 2279 participants in the KORA FF4 study. From these, 1415 stool samples were analysed. Samples were excluded if participants had been on antibiotics within the last two months before sample collection, no laboratory ID number was available, or if storage conditions of the sample were unclear. Furthermore, due to financial constraints, only samples with the best storage conditions were chosen. The stool samples analysed were not exposed to room temperature longer than 3 h overall and were cooled for less than 48 h before they were deep-frozen. Finally, the metabolomics analysis was conducted. The present analysis comprises a subset of 1008 participants (513 men and 495 women) of KORA FF4 for which in addition to the metabolomics data, estimates of habitual food intake were available. Further details on the collection, preprocessing and analysis of stool samples are described below.
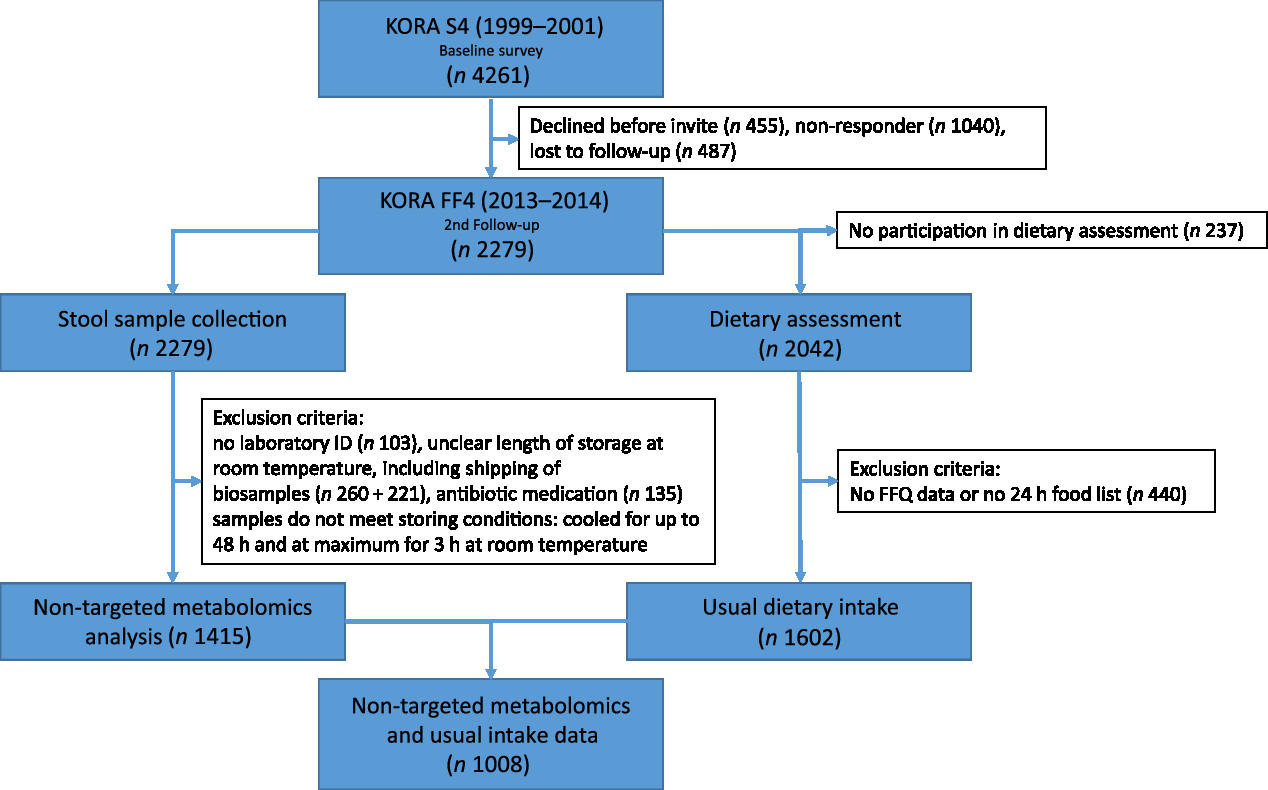
Fig. 2. Flow diagram illustrating the sample sizes and exclusion criteria of metabolite measurements and usual dietary intake in the Cooperative Health Research in the Augsburg Region (KORA FF4) study.
Participants were encouraged to complete at least two web-based 24-h food lists (24HFL) and a web-based FFQ. However, paper-based questionnaires were available upon request. The closed 24HFL encompassed 246 food items used to assess which foods and drinks were consumed over the previous day. A detailed description of the 24HFL has been given elsewhere(Reference Freese, Feller and Harttig17). Briefly, the 24HFL is a closed and structured list of food items used to identify which food items and drinks were consumed over the past day. It neither assesses meals nor portion sizes. For each food item, either yes or no must be answered regarding consumption during the past 24 h. Freese et al. (Reference Freese, Feller and Harttig17) describe that the 246 food items were chosen such that at least 75 % of the variation in nutrient intake was covered. It is important to note that in our study the 24HFL was used in a blended approach. The stand-alone use of the 24HFL was not validated.
The results of the combination of two assessment instruments for usual intake estimation were compared with the isolated use of these instruments. The results clearly demonstrated that the combined use of at least two 24-h recalls and an FFQ gave more valid results on food intake as compared with the use of 24-h recalls or an FFQ alone(Reference Carroll, Midthune and Subar18).
The FFQ included 148 food items to record food consumption frequencies and amounts over the past 12 months. It is based on the German version of the multilingual European Food Propensity Questionnaire (EFPQ)(19) and has been validated(Reference Bohlscheid-Thomas, Hoting and Boeing20). Participants used pictograms to estimate portion size. The frequency of food item consumption was assessed in specified categories (never, once a month or less, two or three times a month, one to two times a week, three to four times a week, five to six times a week, one time per d, two times per d, three times per d, and more than three times per d).
Information on sociodemographic variables and lifestyle factors was collected in an extensive, standardised, face-to-face interview at the study centre. Furthermore, all participants underwent anthropometric assessment that included weight and height measurement.
Stool sample collection, preprocessing and non-targeted metabolomics analysis
Together with the appointment letter, participants were provided with instructions and the necessary equipment to collect faecal samples on the day of their study centre visit or the evening before. Patients were instructed that probes from different areas of the stool samples should be filled directly into two sterile plastic collection tubes. One of the tubes was prefilled with a stabilising agent (for DNA or RNA analysis). The filled tubes should be packed in a sterile plastic bag and put into a box for storage in the refrigerator (4–8°C). A stool collection questionnaire had to be filled out, providing information about the time of collection, description of the stool sample and problems experienced (if any). Participants handed over the stool box upon entry into the study centre where the faecal samples were deep-frozen at −20°C immediately and later stored at −80°C until processing. Using the stool collection questionnaire, storage conditions of the samples were assessed, as these have great impact on the quality of the sample. For our analysis, the native samples without stabilising agent were used. Details on the following laboratory measurements are given in the Supplementary material.
Sample weight correction was achieved by dividing the raw measurement (area counts) by the sample weight. Each participant gave one stool sample from 1 d, so no intra-individual variation was captured. No further technical adjustment was performed, as inspection of data showed consistent performance across all run days. We term these preprocessed metabolite data as metabolite concentrations throughout the paper.
From all finally available 807 metabolites, primary and secondary bile acids and sterols were selected for the analysis. The final preprocessed data set included thirty metabolites measured in 1413 participants. Missing values were imputed by the minimum (preprocessed) value per metabolite, as we assumed that they were not missing due to technical reason but rather being below the limit of detection. Five individual metabolites with more than 25 % of missing values (cholate sulphate, 7-ketolithocholate, glycocholenate sulphate, taurodeoxycholate and ursodeoxycholate sulphate) were excluded from the analysis. Based on the imputed data set, for plant sterols and animal sterols, the sum over all metabolite measurements of the respective group was derived as a further variable to be analysed, generating two further metabolite variables. In total, this results in 30 − 5 + 2 = 27 metabolites to be analysed.
Usual dietary intake
From each participant up to three 24HFL and a FFQ were available to estimate usual, meaning long-term, intake by combining the results of these two instruments. From these two instruments, the usual intake was derived as described in detail in the Supplementary material. We restricted the analysis to the following nineteen main food groups or subgroups: ‘potatoes’, ‘vegetables’, ‘fruits’, ‘nuts, seeds and nut spread’, ‘milk and dairy products’, ‘yoghurt’, ‘cheese (including cream cheese)’, ‘cereal and cereal products’, ‘meat and meat products’, ‘pork’, ‘processed meat’, ‘fish and shellfish’, ‘eggs and egg products’, ‘sugar’, ‘butter’, ‘vegetable oil’, ‘soya products’, ‘non-alcoholic drinks’ and ‘alcoholic drinks’. These variables describing the usual intake were only available for a subsample of 1008 participants for which the stool samples were analysed. When including usual intake values in the regression models described below, each food item was scaled by its standard deviation. The total energy intake (kJ/d) was derived from the usual intake of the participants, taking into account all available food groups and subgroups.
Other covariables
Smoking status was assessed as ‘ex-smoker’, ‘never smoker’ and ‘current smoker’. Following the recommendations given by the German Nutrition Society, alcohol consumption was categorised as ‘no or low alcohol consumption’ (<5 g/d for men and <2 g/d for women), ‘moderate alcohol consumption’ (≥5–<20 g/d for men and ≥2–<10 g/d for women) and ‘heavy alcohol consumption’ (≥20 g/d for men and ≥10 g/d for women) based on the usual alcohol intake per d, estimated from the 24HFL and FFQ as described before(21). Physical activity was assessed in four categories, describing high to no activity. In detail, these were ‘more than 2 h/week regularly’, ‘about 1 h/week regularly’, ‘and about 1 h/week irregularly’ and ‘almost no or no physical activity’, regarding physical activity during leisure time in summer and winter. The years of education reported were categorised as ‘up to 12 years of education’ and ‘more than 12 years of education’. Use of lipid-lowering medication and antidiabetic medications were included. These were identified by ATC codes C10 and A10.
For the descriptive analysis, BMI, computed as weight/height2 (kg/m2), was additionally categorised as underweight (BMI < 18·5 kg/m2), normal (18·5 kg/m2 ≤ BMI <25 kg/m2), preobese (25 ≤ BMI < 30 kg/m2) or obese (BMI ≥ 30 kg/m2); hypertensive status (actual hypertensive or not) and diabetes status (type 2 diabetes or no type 2 diabetes) have also been included. Actual hypertension status was assessed by blood pressure measurements (systolic ≥140 mmHg or diastolic ≥90 mmHg) and/or use of antihypertensive medication, given that the subjects were aware of having hypertension. Diabetic participants include persons with known, validated diabetes as well as those who were newly detected by an oral glucose tolerance test (OGTT) (fasting plasma glucose level ≥126 mg/dl (6·99 mmol/l) or plasma glucose level 2 h after intake of 75 g of glucose ≥200 mg/dl (11·1 mmol/l)). For thirty-one participants, the diabetes status was missing (OGTT information missing or no validation possible), and for two participants, the hypertensive status was missing.
Statistical analysis
Variables included in the statistical analyses were age, sex, BMI, smoking status, alcohol consumption, physical activity, years of education, medication, total energy intake and usual intake of selected food groups and subgroups. Age (years) and BMI were included as continuous variables in the analyses.
The descriptive analysis provided information about percentage of missing values, medians, and 25 %- and 75 %-quantiles of all metabolites and metabolite groups. Median and 25 %- and 75 %-quantiles or absolute numbers and percentage of categories, whatever appropriate for the variables age, food consumption, total energy intake, BMI, smoking status, physical activity, alcohol consumption, years of education, diabetes and hypertension were given for all n 1008 participants that had metabolite measurements and dietary intake data available. All further analyses were performed with log-transformed metabolite data. Sex differences between characteristics of the population were examined by t tests and χ2 tests. To detect sex-specific differences in the usual dietary intake, we chose the Kruskal–Wallis test due to typically skewed intake distributions.
To select relevant variables to be included as adjustment variables in further regression analysis, we examined associations or differences in metabolite levels with the covariates in bivariate analyses. For continuous variables, correlations were examined; for categorical variables, t tests or Kruskal–Wallis tests were performed.
In the main analysis, regression models were fitted for each of the twenty-seven metabolite variables, investigating the effect of the usual intake of a certain food group, adjusted for age, sex, BMI, smoking status, alcohol consumption, physical activity, years of education, diabetes medication, lipid-lowering medication and total energy intake. We report effect estimates and P values. Bonferroni adjustment of the P values was done by dividing 5 % by the number of tests conducted (27 × 19 = 513, leading to 9·746589 × 10–5).
All statistical analyses were performed using the statistical software R, version 3.3.2 (R Development Core Team, 2010, http://www.r-project.org)
Results
The present study was comprised of 513 men and 495 women with a mean age of 60 years and 58 years, respectively. On average, men had a higher BMI and a higher energy intake as compared with women. Most of the participants were non-smokers at the time of assessment and physically active. Further baseline characteristics of the study participants are given in Table 1, stratified by sex.
Table 1. Clinical and lifestyle characteristics of the study population, by sex (n 1008)
(Numbers and percentages; medians and 25%-quantiles, 75%-quantiles)
* t Test for continuous variables, χ2 test for categorical variables.
† Underweight, BMI < 18·5 kg/m2; normal-weight, BMI < 25 kg/m²; preobese, BMI 25–29·99 kg/m²; obese, BMI ≥ 30 kg/m². For the χ2 test underweight participants were discarded.
‡ Physical activity during leisure time in both seasons.
§ No or low alcohol consumption, <5 g/d for men and <2 g/d for women; moderate alcohol consumption, ≥5–<20 g/d for men and ≥2–<10 g/d for women; heavy alcohol consumption ≥20 g/d for men and ≥10 g/d for women.
Table 2 lists descriptive data on dietary intake, given as food group and nutrient intake, and stratified by sex. As expected, mean intake of vegetables, fruit and dairy products was higher in women than in men. In contrast, men had higher consumption of cereals, meat and meat products and alcoholic beverages. These differences in food intake are naturally reflected in the nutrient intake. Higher amounts of alcohol, carbohydrate, fat and protein in men are due to higher intake of alcoholic drinks, cereal products and meat and meat products.
Table 2. Dietary characteristics of the study population, by sex (n 1008)
(Medians and 25%-quantile, 75%-quantile)
* Kruskal–Wallis test (P value is 5 %).
Faecal metabolite concentrations after minimum imputation are described in Table 3. We report the medians, 25 %- and 75 %-quantiles of the data and the percentages of imputed values.
Table 3. Description of metabolite concentrations in faecal samples of the study participants (after imputation) (n 1008)
(Medians and 25%-quantiles, 75%-quantiles)
Table 4 shows the correlations between metabolites. The top 10 % of correlations are highlighted, as are the 10 % of lowest correlations. It is noteworthy that both sitostanol and coprostanol consistently show the weakest correlations with most bile acids.
Table 4. Correlation matrix of metabolites (n 1008)
* Highest 10 % of correlations.
† Lowest 10 % of correlations.
Tables 5 and 6 show the significant findings when analysing the association of food group intake with the log-transformed concentrations of sterols and bile acids. In general, the food groups ‘fruits’, ‘nuts, seeds and nuts spread’, ‘milk and dairy products’, ‘cheese’ and ‘yogurt’ were inversely correlated with the faecal concentration of animal and plant sterols, while ‘potatoes’, ‘meat and meat products’, ‘pork’, ‘processed meat’, ‘eggs and egg products’ and ‘butter’ were positively correlated with animal sterol and plant sterols faecal concentrations. An exception arises with ‘cereals and cereal products’ intake. This food group intake was inversely correlated with cholesterol faecal concentration, whereas positively associated with sitostanol faecal concentration. After Bonferroni correction, ‘fruit’ intake was significantly inversely associated with the faecal concentration of campesterol, cholesterol and the sum of animal sterols. With higher ‘nuts and seeds’ consumption, faecal total cholesterol concentration significantly decreased. Furthermore, consumption of ‘meat and meat products’ was significantly positively related to the faecal concentration of cholesterol. Partial R 2 values show, in general, a small contribution of the dietary intake in the models fitted. Nonetheless, the impact is highest for those associations with the smallest P values.
Table 5. Regression coefficient estimates, standard errors of estimates, P and partial R 2 modelling associations of faecal sterols with habitual intake (only associations with P <5 % are reported†; n 1008)
* P indicating significant associations after Bonferroni correction (P < 9·746589 × 10–5).
† Models were adjusted for age, sex, BMI, smoking status, alcohol consumption, physical activity, years of education, use of lipid-lowering and antidiabetic medication and total energy intake.
Table 6. Regression coefficient estimates, standard errors of estimates, P and partial R 2 modelling associations of faecal bile acids with habitual dietary intake (only associations with P <5 % are reported†; n 1008)
* P indicating significant associations after Bonferroni correction (P < 9·746589 × 10–5).
† Models were adjusted for age, sex, BMI, smoking status, alcohol consumption, physical activity, years of education, medication use and total energy intake.
To find out if our detected inverse association of fruit intake and animal sterols is confounded by meat and meat products intake, we adjusted the fruit intake models for this potential confounder. The sum of animal sterols was still significantly associated with fruit intake at the Bonferroni-corrected significant level. The association of cholesterol and fruit intake was just above the significant level (results not shown). Overall, the intake of ‘fruits’, ‘nuts and seeds’, ‘yogurt’, ‘cheese’, ‘butter’, and ‘soya products’ was mainly inversely associated with selected faecal primary and secondary bile acid concentrations (Table 6). However, some bile acids were also positively associated with ‘fruits’ and ‘yogurt’ consumption (e.g. glycocholate, glycolithocholate sulphate). Additionally, glychochenodeoxycholate was positively associated with ‘fruit’ intake. The dietary intake of ‘potatoes’, ‘vegetables’, ‘meat and meat products’, ‘pork’, ‘processed meat’, ‘eggs and egg products’ and ‘vegetable oils’ was positively related to faecal concentrations of bile acids. Among the associations examined in primary and secondary bile acids, only the secondary bile acid glycocholate showed significant positive association with fruit consumption after Bonferroni correction. No other primary and secondary bile acids were significantly associated with habitual food consumption after adjustment for multiple testing.
Discussion
In the present study, we examined associations between habitual dietary intake and faecal concentrations of sterols and bile acids measured by a metabolomics technique. After correction for multiple testing, we observed a statistically significant inverse association between ‘fruit’ intake and faecal concentrations of campesterol, cholesterol and sum of animal sterols. A higher consumption of ‘nuts and seeds’ was also associated with lower faecal concentrations of these metabolites. Additionally, a significant positive association between ‘meat and meat products’ consumption and faecal cholesterol concentration was found. Concerning the association of bile acids and habitual dietary intake, only one result remained significant after Bonferroni correction: a high fruit consumption was associated with a high glycocholate concentration in faeces. All other identified associations were no longer significant after Bonferroni correction.
Due to the high cholesterol content in foods of animal origin, especially in meat and meat products, the findings concerning higher animal sterols in stool when following a high-meat diet are not surprising(Reference Reddy, Hanson and Mangat22, Reference Reddy and Wynder23). The identified relationship is strong and thus the sum of animal sterols is a promising biomarker of dietary intake of ‘meat and meat products’.
Concerning bile acids, it is reported in the literature that consuming a high-fat, high-beef diet does not alter the activity of faecal bacterial enzymes, although faecal secondary bile acid excretion is increased(Reference Reddy, Hanson and Mangat22). However, Hentges et al. (Reference Hentges, Maier and Burton24) did not observe increasing concentrations of bile acids in faeces of subjects following a high-meat diet. This is in line with our findings of a non-significant increase in bile acid excretion with relatively high meat consumption.
The explanation for the findings of an inverse association of ‘fruits’ and ‘nuts and seeds’ intake with animal sterols in faeces is not as straight forward. At least in part, it may be explainable by the higher plant sterol intake and its physiological consequences on cholesterol absorption and excretion(Reference Weststrate, Ayesh and Bauer-Plank25, Reference Racette, Lin and Lefevre26), which shall be discussed in the following paragraph.
Plant sterols have a plasma cholesterol-lowering property as described in numerous studies(Reference De Smet, Mensink and Plat3, Reference Katan, Grundy and Jones27–Reference Gylling, Plat and Turley31). It is commonly accepted that this effect is mediated by reducing cholesterol absorption through competition of plant sterols with cholesterol for incorporation into micelles(Reference De Smet, Mensink and Plat3). Further, the intestinal absorption rate of cholesterol (40–60 %) is much higher than of plant sterols (15 % or less)(Reference Ling and Jones13, Reference Sudhop, Sahin and Lindenthal32). Weststrate et al. (Reference Weststrate, Ayesh and Bauer-Plank25) analysed faecal concentrations of sterols and bile acids and found a significant increase in faecal neutral sterols after consumption of phytosterol-enriched margarine. Also Racette et al. (Reference Racette, Lin and Lefevre26) concluded that phytosterols act as bioactive compounds that lead to increased cholesterol excretion in faeces. In an intervention study, eighteen participants followed a low-phytosterol diet and received beverages supplemented with 0, 400 or 2000 mg phytosterols/d for 4 weeks each, with 1 week washout period. They reported that consuming dietary phytosterols in moderate or high doses could alter the cholesterol metabolism in human body. The cholesterol excreted was mainly from biliary cholesterol and a smaller proportion from dietary cholesterol. Another intervention study has also observed an increase in faecal excretion of cholesterol through the intake of a phytosterol-rich diet(Reference Lin, Racette and Lefevre33).
In the long-term, however, it is not clear whether a diet relatively high in plant sterols is associated with lower faecal animal sterols. Jaceldo-Siegl et al. (Reference Jaceldo-Siegl, Lutjohann and Sirirat34) examined dietary intake and plasma concentration of plant sterols and cholesterol across five different dietary patterns. Dietary phytosterols were highest in the diet of vegan subjects and lowest among non-vegetarians, whereas total cholesterol consumption was highest among non-vegetarians and lowest in vegans. However, the plasma concentrations of plant sterols and animal sterols did not vary across different diets. In addition, an alteration in the intestinal cholesterol absorption by consuming 0·7–0·9 g/plant sterols per d was observed(Reference Normen, Frohlich and Trautwein35). However, the daily intake of plant sterols following a regular diet ranges between 160 and 400 mg/d(Reference Jaceldo-Siegl, Lutjohann and Sirirat34), which is lower than the required concentration to achieve a higher excretion rate of sterols in faeces(Reference Racette, Lin and Lefevre26).
Our results provide novel information, since no other study has analysed faecal concentrations of sterols in faeces in a population-based study and related it to habitual dietary intake. However, our observations are not consistent with results from intervention studies or other previous projects dealing with the effect of phytosterol intake, as we reported an inverse correlation between fruits and nuts consumption and faecal animal sterols. In our study, on average 4·7 g/d of nuts and seeds were consumed, which is a very small amount, and likely too small for a phytosterol-based effect on cholesterol excretion.
Another aspect explaining the inverse association of fruit consumption and sterols in our study is that fruit intake contributes to the total dietary fibre intake. As high dietary fibre intake leads to increased faecal bulk, and this may result in lower faecal concentration of sterols and bile acids per g of dry weight(Reference Reddy, Hedges and Laakso36).
Diets that are rich in fruits are linked to a decreased colorectal cancer incidence. Regarding bile acids, it is noteworthy that dietary fibres from vegetables and fruits can bind to the secondary bile acid lithocholate and enhance its faecal excretion(Reference Ajouz, Mukherji and Shamseddine37, Reference Jenkins, Wolever and Rao38). This may explain our finding of a positive association between fruit consumption and glycocholate excretion, although for all other bile acids we found (non-significant) inverse associations.
Also, the amount of vegetable oils – rich in phytosterols – consumed in our population sample (on average, 5·7 g/d) is likely not high enough to result in a significant effect on faecal sterols. However, intervention studies did observe an effect of replacing butter consumption with vegetable oils and found a significant increase in faecal excretion of sterols and bile acids(Reference Bosaeus, Belfrage and Lindgren39). In another study, the faecal sterols concentration increased from 30 mg/g to about 50 mg/g dry weight after enriching margarine with 8·6 g vegetable oils(Reference Weststrate, Ayesh and Bauer-Plank25). However, we only observed a correlation between vegetable oils intake and faecal excretion of the secondary bile acid 7,12-diketolithocholate.
Strengths and limitations
To the best of our knowledge, the present study provides, for the first time, data on the association between habitual food intake and faecal concentration of animal sterols, phytosterols and bile acids in a cross-sectional study applying metabolomics techniques. Several studies measured animal and plant sterols in blood and faecal samples(Reference Racette, Lin and Lefevre26, Reference Lin, Racette and Lefevre33) or plasma only(Reference Jaceldo-Siegl, Lutjohann and Sirirat34). Some studies examined faecal samples only in (short- to medium-term) intervention studies(Reference Lubinus, Barnsteiner and Skurk1, Reference Weststrate, Ayesh and Bauer-Plank25, Reference Racette, Lin and Lefevre26, Reference Lin, Racette and Lefevre33).
Our study is of observational nature and stool samples were collected only once per subject. To consider day-to-day variation, collecting faecal samples on 3–5 d from each participant was recommended by Setchell et al. (Reference Setchell, Ives and Cashmore40). This would allow integrating not only day-to-day variation in food consumption, but also differences in stool transit time, gut microbiota activity, etc.
Unlike blood, stool samples usually cannot be collected in the study centre; rather, it is collected at home and thus has to be stored until the study centre visit. Although correct handling and storage was communicated to all participants, not all stool samples were stored cooled until handed over in the study centre. In a prestudy, comparisons were made concerning metabolite concentrations in fresh samples and samples stored under different conditions. Due to the results of this study and in accordance with Loftfield et al. (Reference Loftfield, Vogtmann and Sampson41), samples with storage at room temperature of more than 3 h were excluded from the analysis. Nonetheless, we cannot rule out that metabolite degeneration took place in the selected samples.
Faeces can be easily accessed in a non-invasive manner and make it possible to study the diet–gut microbiota–host interaction via the analysis of unabsorbed metabolites(Reference Matysik, Le Roy and Liebisch42). Further, sterols and bile acids are mainly metabolised by the gut microbiota and excreted in faeces(Reference Gerard8). Therefore, it is more reasonable to estimate especially sterol in faeces rather than in any other biospecimen. Several sterol metabolites have previously been identified in human faeces(Reference Keller and Jahreis43). Phytosterols may be metabolised into C21-bile acids in the liver and not to the common C24-bile acids in mammals(Reference Ling and Jones13). Since only the common C24-bile acids were detected in our study and not the C21-bile acids, we could not observe the total metabolite excretion of plant sterols in faeces.
In our study, no extremely high amounts in the consumption of certain food groups were observed. Unlike the procedures in short-term intervention studies, we analysed estimates of usual dietary intake of food groups and not a specific diet (high in a specific food) on the day before stool sampling. Plant sterols are derived only from diet, and if they are not consumed regularly in high amounts, it is unlikely to find high concentration of phytosterols in faeces. Daily intake of plant sterols ranges from 160 to 400 mg in different populations (see Jaceldo-Siegl et al. (Reference Jaceldo-Siegl, Lutjohann and Sirirat34)). However, to observe significant reduction of plasma LDL-cholesterol concentrations and to obtain cardiovascular health benefits, adults should consume 2 g/d(44), a dose not attainable by habitual diet without supplementation.
In conclusion, the results of this study conducted in participants from the general population indicate an effect of habitual diet on faecal concentrations of animal sterols, while the impact of diet on bile acids is limited. A diet high in ‘fruits’ and ‘nuts and seeds’ is associated with lower concentrations of animal sterols in faeces. As expected, a diet high in ‘meat and meat products’ leads to higher concentrations of animal sterols in faeces. Further studies are necessary for evaluation of faecal animal sterols as biomarkers of diet. Our findings especially need to be confirmed in other populations with diverse dietary habits. Also, the question of possible health benefits or risks of a higher or lower faecal animal sterol content in response to dietary habits needs further discussion.
Acknowledgements
The authors gratefully acknowledge the contribution of all members of field staff conducting the KORA FF4 study and thank all study participants.
Dietary assessment and stool sample collection in KORA FF4 was supported by iMED, a research alliance within the Helmholtz Association, Germany. PhD students involved were funded by the Food Biomarkers Alliance FOODBALL (German Ministry for Education and Research, FK 2814ERA02E) and the ENABLE cluster (German Ministry for Education and Research, FK 01EA1409E). The KORA study was initiated and financed by the Helmholtz Zentrum München – German Research Center for Environmental Health, which is funded by the German Federal Ministry of Education and Research (BMBF) and by the State of Bavaria. The iMED, FOODBALL and ENABLE cluster had no role in the design, analysis or writing this article.
P. M. drafted the manuscript and interpreted the results, N. W. conducted the statistical analysis, S. S., J. K. and A. A. prepared, analysed and processed the samples, J. L. and P. M. formulated the research question and designed the study; B. T., C. M., A. P., H. G., M. H., J. A. and J. L. conducted research and/or provided essential materials; All authors read, critically commented on and then approved the final manuscript.
There were no conflicts of interest.
Supplementary material
To view supplementary material for this article, please visit https://doi.org/10.1017/S000711451900103X


 Open access