


Type 2 diabetes mellitus (T2DM) is a complicated metabolic disorder, identified by defects in the function of insulin(Reference Vetrone, Zaccardi and Webb1). According to the International Diabetes Federation, the number of diabetic patients is increasing in the world. Iran is one of the countries with the highest prevalence of diabetes and is expected that by the year 2030, the diabetes population size reaches 9.2 million(Reference Cho, Shaw and Karuranga2). Oxidative stress and inflammation-related indicators have an influential role in the pathogenesis of diabetes and its complications such as CVD that are the primary cause of death in diabetic patients(Reference Mozaffari, Daneshzad and Surkan3,Reference Evans, Goldfine and Maddux4) .
Diet is a well-known factor that can impact on plasma redox state and is the most important modifiable factor in reducing disease-related oxidative stress(Reference Damavandi, Mousavi and Shidfar5,Reference Daneshzad, Keshavarz and Qorbani6) . Although some researchers indicated that high intake of fruits and vegetables, which are antioxidant-rich foods decreased the risk of death from all-cause mortality and CVD by reducing inflammation and oxidative damage(Reference Xie, Lin and Fang7,Reference De la Iglesia, Lopez-Legarrea and Celada8) . However, these food groups are not the only sources of antioxidants in the whole diet. Also, the evaluation of single antioxidants does not state the total antioxidant ability of the entire diet(Reference Bahadoran, Golzarand and Mirmiran9). In this regard, dietary total antioxidant capacity (DTAC) is an index that estimates the cumulative effect of antioxidants in the whole diet(Reference Mozaffari, Daneshzad and Larijani10). Various methods have been used to estimate DTAC(Reference Pellegrini, Del Rio and Colombi11). To provide comprehensive and clear information, all these different indices should be applied(Reference Mozaffari, Daneshzad and Larijani10). This dietary index is a relevant tool in epidemiological studies for the investigation of diet-disease relationships and diseases associated with oxidative stress(Reference Hermsdorff, Puchau and Volp12,Reference Detopoulou, Panagiotakos and Chrysohoou13) . Some researchers have reported the beneficial effects of a high-total antioxidant capacity (TAC) diet on cardiovascular disease, systematic inflammation, oxidative stress(Reference Mozaffari, Daneshzad and Larijani10).
However, individuals are not affected equally by high-dietary TAC. It means that in addition to environmental factors that are link with the risk of CVD, it can also be affected by genetic variants or interactions between genetic susceptibilities and diet. Among many SNP that have been identified in the Apo A-II gene, –265T/C (rs5082) is the most studied. It has been reported that the replacement of T with C at −265 nucleotide of the Apo A-II gene leads to reduce the transcriptional rate of the Apo A-II and its serum concentration. In this regard, Apo A-II as a major structural protein of plasma HDL which accounts for 20 % of the total protein components of this lipoprotein has a complex metabolic role(Reference van’t Hooft, Ruotolo and Boquist14,Reference Sotos-Prieto and Peñalvo15) . Some researchers reported that variations in the Apo A-II –265 C > T genes differ in cardiometabolic risk factor and is associated with CVD(Reference Wang, Niimi and Nishijima16,Reference della Rovere, Lapolla and Sartore17) . In our previous study, we observed that the variants of Apo A-II − 265T/C polymorphism have various levels of oxidative stress and inflammation. In other words, diabetic patients with minor C allele are susceptible to CVD due to increased levels of inflammation and oxidative stress(Reference Koohdani, Sadrzadeh-Yeganeh and Djalali18,Reference Koohdani, Sadrzadeh-Yeganeh and Djalali19) . Likewise, it is suggested that a higher level of Apo A-II in carriers of the T allele is related to decreased blood leukocytes, lower serum levels of C-reactive protein (CRP), and higher activity of paraoxonase-1 (PON1)(Reference Wang, Niimi and Nishijima16). Given the above, the interaction between the variants of this polymorphism and the DTAC may affect cardiometabolic risk factors.
Since there is no report in regard to the effect of the interaction between this SNP and DTAC on cardiometabolic risk factors and also based on the relation between Apo A-II and inflammation and oxidative status, along with the effects of DTAC on oxidative stress and inflammatory markers, the objective of this study was to investigate the interactions between DTAC and Apo A-II –265T > C rs5082 on inflammation and oxidative stress markers in Iranian diabetic patients to provide evidence for genotype-based dietary recommendations, which can helpful for the delay, prevention and management of CVD in this patients.
Materials and methods
Participants and study design
Of 816 type 2 diabetic patients with identified genotype, who were randomly sampled through the diabetes referral centres in Tehran, two obese and non-obese groups were selected in this study with a ratio of 1:1. Each groups contained ninety patients with equal numbers of each genotype of Apo A-II: (30) TT, (30) CC and (30) TC. Based on the classification of previous studies and similar effects of TT and TC genotypes(Reference Koohdani, Sadrzadeh-Yeganeh and Djalali19–Reference Corella, Tai and Sorlí21), we merged these two groups into one category as T allele carriers (TC + TT). In our previous study, genotype frequencies of this polymorphism were 39·4 %, 47·7 % and 12·9 % for the TT, TC and CC genotypes, respectively(Reference Basiri, Sotoudeh and Alvandi22). BMI ≥ 30 kg/m2 was considered as obesity based on the WHO criteria. All of the participants were 35–65 years old with glucose-lowering medication treatment without insulin use. Exclusion criteria including being a migrant, being pregnant, lactation, addiction, consumption of anti-inflammatory medications, clinical or inflammatory diseases such as coagulation disorders, cancers, CVD, stroke, malignant disease and patients with unexplained total energy intake (< 800 or > 4200 kcal/d)(Reference Willett and Willett23). Overall, 180 T2DM patients aged 35–65 years (both genders) were subdivided into two equal groups based on (BMI ≥ 30; obese = 90) and (BMI < 30; non-obese = 90) and each group includes TT + TC (n 60), or CC (n 30) genotypes.
Demographic data and lifestyle variables (age, gender, job status, education levels, duration of diabetes and its complications, use of supplements or medication either lipid- or glucose lowering) were collected using a self-administered questionnaire. Anthropometric parameters, including weight (nearest 100 g), height and waist circumference (nearest 0·5 cm), were measured based on standard protocols(Reference Krause, Mahan and Escott-Stump24). BMI was computed using the ‘weight (kg)/height2 (m2)’ equation. Also, daily physical activity was estimated in terms of metabolic equivalent × hours per day (MET h/d) using a validated physical activity questionnaire(Reference Klishadi, Khosravi and Famouri25). Before participating in the study, patients provided an informed written consent form. The ethics committee of Tehran University of Medical Sciences (TUMS) has approved the study protocol (identification: 97-03-161-41169).
Biochemical parameters and genotyping
Venous blood samples were collected at 08.00–10.00, after 12-h fasting. Serum lipids level (cholesterol, HDL and LDL and TAG) was measured by an enzymatic method (using kits, Pars Azmun Co.). Serum levels of oxidative stress markers, including, total antioxidant capacity (TAC), superoxide dismutase (SOD) and 8-isoprostaneF2α (8-iso-PGF2α). Serum levels of inflammatory markers, including interleukin-18 (IL-18), high-sensitivity C-reactive protein (hs-CRP) and pentraxin (PTX3). The detailed methods for measuring inflammatory factors(Reference Keramat, Sadrzadeh-Yeganeh and Sotoudeh26), oxidative stress(Reference Zamani, Sadrzadeh-Yeganeh and Sotoudeh20) and Apo A-II − 265T > C polymorphism (rs5082)(Reference Alvandi and Koohdani27) were described in our previous studies.
Dietary assessment and definition of dietary total antioxidant capacity
A validated 147-item semi-quantitative FFQ was used to obtain dietary intakes of patients through the past year(Reference Esfahani, Asghari and Mirmiran28). Participants were asked to report the frequency of their consumption for each item of food in the questionnaire, on average, on a daily, weekly or monthly during the past year. Then the reported frequency intake converted to grams per day using household measures. Four indices were used to calculate DTAC, including the ferric reducing ability of plasma (FRAP) based on Norwegian antioxidant table that includes more than 3000 foods(Reference Carlsen, Halvorsen and Holte29); oxygen radical absorbance capacity (ORAC) based on the USA Department of Agriculture databases(Reference Haytowitz and Bhagwat30); Trolox equivalent antioxidant capacity (TEAC) and total radical-trapping antioxidant potential (TRAP) that were drawn out from Italian food databases(Reference Pellegrini, Serafini and Colombi31) that included most of the foods that are consumed by the Iranian population. For analysing similar food items (e.g. several types of bread), we used the overall mean value(Reference Prohan, Amani and Nematpour32). DTAC values were expressed: as mmol Fe2+/100 g of food for FRAP method or as mmol of Trolox equivalent (mmol TE)/kg of food for TEAC, TRAP and μmol of Trolox equivalent (μmol TE)/100 g of food for ORAC methods(Reference Kobayashi, Murakami and Sasaki33,Reference Safabakhsh, Imani and Shab-Bidar34) . For each patient, the frequencies of consumption of each food were multiplied by their related FRAP, TRAP, TEAC and ORAC values (based on published databases) and then summed to obtain DTAC(Reference Ávila-Escalante, Coop-Gamas and Cervantes-Rodríguez35). Supplements with antioxidant properties were not considered in the calculation of DTAC(Reference Mozaffari, Daneshzad and Larijani10,Reference Daneshzad, Keshavarz and Qorbani36) .
Statistical methods
The sample size was defined according to type I error of α = 0·05 and type II error of β = 80 %. Initially, participants were classified into two Apo A-II genotype groups: CC and TT + TC as T allele carriers. Also, according to the median DTAC, the participants were dichotomised into ‘high’ and ‘low’ categories (≤ and < of median), FRAP (≤ 15·67 and 15·77 > mmol Fe2+/d); TRAP (≤ 7·87 and 7·88 > mmol TE/d); TEAC (≤ 7·27 and 7·28 > mmol TE/d) and ORAC (≤ 26 854·59 and 26 854·60 > µmol TE/d). Normality distribution of data was tested by applying Kolmogorov–Smirnov’s test. Variables with non-normal distributions were log-transformed for analyses. To compare general characteristics between the two groups (CC and TC + TT groups/low and high of DTAC), we used Independent Student’s t test for continuous and Chi-square test for categorical variables with a normal distribution. Mann–Whitney test was used to compare the mean variables that were not normally distributed. ANCOVA test was applied to compare the mean dependents variables with adjusting for confounding variables. ANCOVA multivariate interaction models using the general linear model was tested to find the interaction between Apo A-II polymorphism (rs5082) and DTAC on oxidative stress and inflammatory markers. Additional adjustments were done for (age (years), gender (male/female), smoking (yes/no), supplement use (yes/no), physical activity (continuous), lipid-lowering medication (yes/no), coffee (continuous), fibre (continuous) and total energy intake (continuous)) as confounder factors. Based on the normally distributed, the data were expressed as mean ± sd and median (25th and 75th percentile) for normally and not normally distributed continuous variables, respectively. Categorical variables reported as frequency (%). SPSS software (SPSS Inc., version 21) was used for the statistical analysis. Variance inflation factor > 2 was not used in the models. Also, P-value < 0·05 was considered significant.
Result
Study population characteristics
The 180 diabetic patients were evaluated in this comparative study. General characteristics based on each participant’s genotype are reported in (Table 1). According to our findings, genotype frequency among study participants was as follows CC (33·3 %) and TC + TT (66·7 %). Sex distribution of T2DM population was (male = 36·7 % – female = 63·3 %) in CC genotype and (male = 35·8 % – female = 64·2 %) in T-allele carriers. The mean age was higher in the CC genotype group (P = 0·004). No significant difference was found in the other variables studied (e.g. lipid profiles, physical activity, dietary intake, glucose and lipid-lowering medication) between the two genotype groups. Out of 147 FFQ items, the total antioxidant capacity of the diet in the FRAP, ORAC, TEAC and TRAP methods was estimated from 117(80 %), 72(49 %), 68(46 %) and 61(41 %) food items, respectively. In other studies, the percentage of compliance of the FFQ with international data of DTAC has been reported from 44·8 %(Reference Okubo, Syddall and Phillips37) to 100 %(Reference Devore, Kang and Stampfer38).
Table 1. Characteristics of patients with type 2 diabetes mellitus*

APOA2, apolipoprotein A2; CC, C allele homozygotes; TT/TC, T allele carriers ;TC, Total cholesterol; FRAP, ferric reducing ability of plasma; TRAP, total reactive antioxidant potential; TEAC, trolox equivalent antioxidant capacity and ORAC, oxygen radical absorbance capacity.
* All data are means ± standard deviations unless indicated.
† Obtained using the independent t test for continuous variables and Chi-square test for the categorical variable.
‡ Supplements of vitamins and minerals.
§ Statins, gemfibrozil and andnicotinamide.
|| Metformin, glibenclamide and thiazolidinedione.
Associations between the apo a-II _265T/C SNP and oxidative stress markers
The interaction between Apo A-II –265T > C polymorphism and DTAC (FRAP, TRAP, TEAC and ORAC) on oxidative stress variables (SOD activity, TAC and PGF2α concentration) in the whole population and the obese subgroup are reported in Tables 2, 3, 4, 5, 6, 7, respectively.
Table 2. Interaction between apo a-II –265T > C polymorphism and the dietary total antioxidant capacity (TAC): ferric reducing ability of plasma (FARP), total reactive antioxidant potential (TRAP), trolox equivalent antioxidant capacity (TEAC) and oxygen radical absorbance capacity (ORAC) intake on the superoxide dismutase activity (SOD) activity level

For variables that did not have a normal distribution, the log transformation method was used before analysis.
* P; P interactions are obtained with the general linear model (two-way ANOVA). P 1; the P 1 value of the interaction (model 1) is adjusted for sex (as categorical), smoking (as categorical), coffee and PUFA-w3 intake (as continuous) using ANCOVA test. P 2; the P 2 value of the interaction (model 2) further adjusted for age (as continuous), WC (as continuous), supplement use (as categorical) and total energy intake (as continuous) using ANCOVA test.
Independent samples t test was used to compare the SOD activity level in the two categories of antioxidant intake (†P) or between two genotypic groups (‡P).
Table 3. Interaction between apo a-II –265T > C polymorphism and the dietary total antioxidant capacity (TAC): ferric reducing ability of plasma (FRAP), total reactive antioxidant potential (TRAP), trolox equivalent antioxidant capacity (TEAC) and oxygen radical absorbance capacity (ORAC) intake on the serum TAC level

For variables that did not have a normal distribution, the log transformation method was used before analysis.
* P; P interactions are obtained with the general linear model (two-way ANOVA). P 1; the P 1 value of the interaction (model 1) is adjusted for age (as continuous), smoking (as categorical), supplement use (as categorical) and coffee intake (as continuous) using ANCOVA test. P 2; the P 2 value of the interaction (model 2) further adjusted for sex (as categorical), WC (as continuous), PUFA-w3 and total energy intake (as continuous) using ANCOVA test.
Independent samples t test was used to compare serum TAC level in the two categories of antioxidant intake (†P) or between two genotypic groups (‡P).
Table 4. Interaction between apo a-II –265T > C polymorphism and the dietary total antioxidant capacity (TAC): ferric reducing ability of plasma (FRAP), total reactive antioxidant potential (TRAP), trolox equivalent antioxidant capacity (TEAC) and oxygen radical absorbance capacity (ORAC) intake on the PGF2α level

* P; P interactions are obtained with the general linear model (two-way ANOVA). P 1; the P 1 value of the interaction (model 1) is adjusted for sex (as categorical), supplement use (as categorical), coffee and PUFA-w3 intake (as continuous) using ANCOVA test. P 2; the P 2 value of the interaction (model 2) further adjusted for age (as continuous), smoking (as categorical), WC (as continuous) and total energy intake (as continuous) using ANCOVA test.
Independent samples t test was used to compare the PGF2α level in the two categories of antioxidant intake (†P) or between two genotypic groups (‡P).
Table 5. Interaction between apo a-II –265T > C polymorphism and the dietary total antioxidant capacity (TAC) on the superoxide dismutase activity (SOD) activity level in obese and non-obese patients
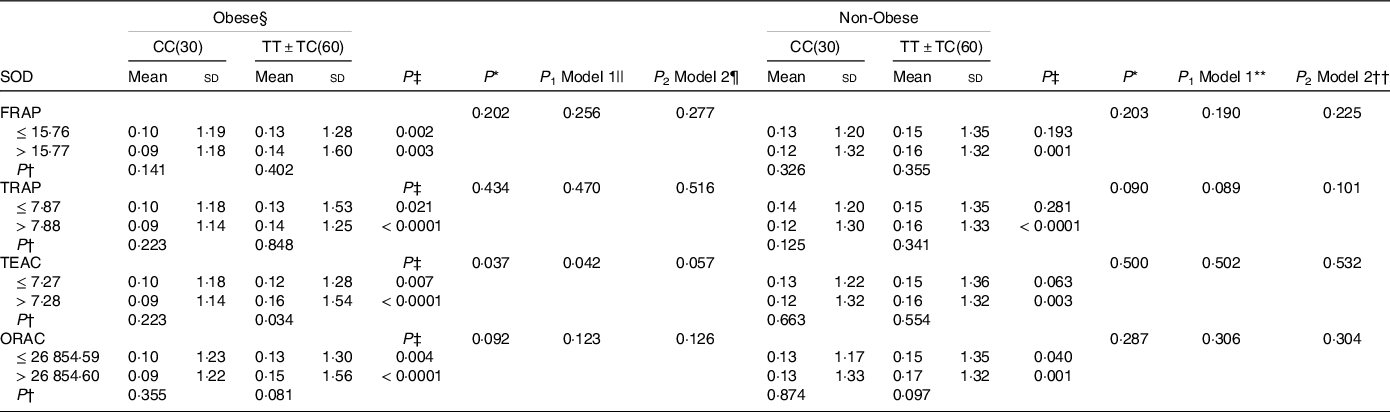
FRAP, ferric reducing ability of plasma; TRAP, total reactive antioxidant potential; TEAC, trolox equivalent antioxidant capacity and ORAC, oxygen radical absorbance capacity. For variables that did not have a normal distribution, the log transformation method was used before analysis.
* P; P interactions are obtained with the general linear model (two-way ANOVA).
Independent samples t test was used to compare the SOD activity level in the two categories of antioxidant intake (†P) or between two genotypic groups (‡P).
§ Obesity was defined as BMI ≥ 25 kg/m2.
|| The P 1 value of the interaction (model 1) is adjusted for age (as continuous), supplement use (as categorical), smoking (as categorical), coffee, PUFA-w3 and total energy intake (as continuous)using ANCOVA test.
¶ The P 2 value of the interaction (model 2) further adjusted for sex (as categorical) using ANCOVA test.
** The P 1 value of the interaction (model 1) is adjusted for age (as continuous), sex (as categorical), smoking (as categorical), coffee, PUFA-w3 and total energy intake (as continuous)using ANCOVA test.
†† The P 2 value of the interaction (model 2) further adjusted for supplement use (as categorical) using ANCOVA test.
Table 6. Interaction between apo a-II –265T > C polymorphism and the dietary total antioxidant capacity (TAC) on the serum TAC level in obese and non-obese patients

FRAP, ferric reducing ability of plasma; TRAP, total reactive antioxidant potential; TEAC, trolox equivalent antioxidant capacity and ORAC, oxygen radical absorbance capacity. For variables that did not have a normal distribution, the log transformation method was used before analysis.
* P; P interactions are obtained with the general linear model (two-way ANOVA). Independent samples t test was used to compare serum TAC levels in the two categories of antioxidant intake (P†) or between two genotypic groups (P‡).
§ The P 1 value of the interaction (model 1) is adjusted for age (as continuous), sex (as categorical), supplement use (as categorical), smoking (as categorical), coffee and PUFA-w3 intake (as continuous) using ANCOVA test.
|| The P 2 value of the interaction (model 2) further adjusted for total energy intake (as continuous)using ANCOVA test.
¶ Obesity was defined as BMI ≥ 25 kg/m2.
Table 7. Interaction between apo a-II –265T > C polymorphism and the dietary total antioxidant capacity (TAC) the PGF2α level in obese and non-obese patients

FRAP, ferric reducing ability of plasma; TRAP, total reactive antioxidant potential; TEAC, trolox equivalent antioxidant capacity and ORAC, oxygen radical absorbance capacity.
* P; P interactions are obtained with the general linear model (two-way ANOVA). Independent samples t test was used to compare thePGF2α level in the two categories of antioxidant intake (†P) or between two genotypic groups (‡P).
§ Obesity was defined as BMI ≥ 25 kg/m2.
|| The P 1 value of the interaction (model 1) is adjusted for age (as continuous), sex (as categorical), supplement use (as categorical), smoking (as categorical), coffee and PUFA-w3 intake (as continuous) using ANCOVA test.
¶ The P 2 value of the interaction (model 2) further adjusted for total energy intake (as continuous) using the ANCOVA test.
** The P 1 value of the interaction (model 1) is adjusted for age (as continuous), supplement use (as categorical), smoking (as categorical), coffee and PUFA-w3 total energy intake (as continuous) using ANCOVA test.
†† The P 2 value of the interaction (model 2) further adjusted for sex (as categorical) using ANCOVA test.
SOD activity is higher in T-allele carriers in individuals with higher DTAC (P TEAC = 0·038 and P ORAC = 0·008) (Table 2). And, this positive relationship between DTAC and SOD level was also observed in obese and non-obese patients with TT + TC genotype than genotype CC (obese: P obese TEAC = 0·034; non-obese: P FRAP = 0·001, P TRAP < 0·0001, P TEAC = 0·003 and P ORAC = 0·001) (Table 5). A significant interaction was observed in obese patients in crude and also adjusted model 1 (P crudeTEAC = 0·037, P 1 TEAC = 0·042) (Table 5).
Serum TAC is also higher in T-allele carriers in individuals with higher DTAC in the whole population (P FRAP = 0·030 and P ORAC = 0·049) (Table 3). However, there was no significant interaction between this SNP and DTAC on the level of serum TAC in the obese subgroup (Table 6).
PGF2α is lower in T-allele carriers only in individuals with higher indices both in obese and non-obese patients (obese: P FRAP = 0·043; non-obese: P FRAP < 0·0001, P TRAP = 0·007, P TEAC = 0·001 and P ORAC < 0·0001). A genotype–DTAC interaction on serum PGF2α was seen in non-obese patients in crude and also adjusted model (P crudeORAC = 0·006, P 1 ORAC = 0·007 and P 2 ORAC = 0·008), (P 1 FRAP = 0·047 and P 2 FRAP = 0·043) and (P 1 TEAC = 0·038 and P 2 TEAC = 0·042) (Table 7).
Associations between the apo a-II _265T/C SNP and inflammatory factors
The interaction between APOA-II –265T > C SNP and DTAC (FRAP, TRAP, TEAC and ORAC) on inflammatory variables (PTX3, hs-CRP and IL18 concentration) in the whole population, and the obese subgroups are reported in Tables 8, 9, 10, 11, 12, 13, respectively.
Table 8. Interaction between apo a-II –265T > C polymorphism and the dietary total antioxidant capacity (TAC): ferric reducing ability of plasma (FRAP), total reactive antioxidant potential (TRAP), trolox equivalent antioxidant capacity (TEAC) and oxygen radical absorbance capacity (ORAC) intake on the PTX3 level

* P; P interactions are obtained with the general linear model (two-way ANOVA). P 1; the P 1 value of the interaction (model 1) is adjusted for age (as continuous), sex (as categorical) and WC (as continuous) using ANCOVA test. P 2; the P 2 value of the interaction (model 2) further adjusted for supplement use (as categorical), smoking (as categorical), coffee, PUFA-w3 and total energy intake (as continuous) using ANCOVA test.
Independent samples t test was used to compare thePTX3 level in the two categories of antioxidant intake (†P) or between two genotypic groups (‡P).
Table 9. Interaction between apo a-II –265T > C polymorphism and the dietary total antioxidant capacity (TAC): ferric reducing ability of plasma (FRAP), total reactive antioxidant potential (TRAP), trolox equivalent antioxidant capacity (TEAC) and oxygen radical absorbance capacity (ORAC) intake on the hs-CRP level

* P; P interactions are obtained with the general linear model (two-way ANOVA). P 1; the P 1 value of the interaction (model 1) is adjusted for age (as continuous), sex (as categorical), smoking (as categorical) and total energy intake (as continuous). P 2; the P 2 value of the interaction (model 2) further adjusted for supplement use (as categorical), and WC (as continuous), coffee and PUFA-w3 intake (as continuous) using ANCOVA test. Mann–Whitney test was used to compare the hs-CRP level in the two categories of antioxidant intake (†P) or between two genotypic groups (‡P).
Table 10. Interaction between apo a-II –265T > C polymorphism and the dietary TAC: FRAP, TRAP, TEAC and ORAC intake on the PGF2α level

FRAP, ferric reducing ability of plasma; TRAP, total reactive antioxidant potential; TEAC, trolox equivalent antioxidant capacity and ORAC, oxygen radical absorbance capacity.
* P; P interactions are obtained with the general linear model (two-way ANOVA). P 1; the P 1 value of the interaction (model 1) is adjusted for sex (as categorical) smoking (as categorical) coffee and PUFA-w3 intake (as continuous) using ANCOVA test. P 2; the P 2 value of the interaction (model 2) further adjusted for age (as continuous), supplement use (as categorical), WC (as continuous) and total energy intake (as continuous) using ANCOVA test. Mann–Whitney test was used to compare the IL18 level in the two categories of antioxidant intake (†P) or between two genotypic groups (‡P).
Table 11. Interaction between apo a-II –265T > C polymorphism and the dietary TAC on the PTX3 level in obese and non-obese patients

FRAP, ferric reducing ability of plasma; TRAP, total reactive antioxidant potential; TEAC, trolox equivalent antioxidant capacity and ORAC, oxygen radical absorbance capacity.
* P; P interactions are obtained with the general linear model (two-way ANOVA). Independent samples t test was used to compare the PTX3 level in the two categories of antioxidant intake (†P) or between two genotypic groups (‡P).
§ Obesity was defined as BMI ≥ 25 kg/m2.
|| The P 1 value of the interaction (model 1) is adjusted for age (as continuous), supplement use (as categorical), coffee and PUFA-w3 and total energy intake (as continuous) using ANCOVA test.
¶ The P 2 value of the interaction (model 2) further adjusted for sex (as categorical) and smoking (as categorical) using ANCOVA test.
** The P 1 value of the interaction (model 1) is adjusted for age (as continuous), smoking (as categorical), coffee and PUFA-w3 and total energy intake (as continuous) using ANCOVA test.
†† The P 2 value of the interaction (model 2) further adjusted for sex (as categorical) and supplement use (as categorical) using ANCOVA test.
Table 12. Interaction between apo a-II –265T > C polymorphism and the dietary TAC on the CRP level in obese and non-obese patients

FRAP, ferric reducing ability of plasma; TRAP, total reactive antioxidant potential; TEAC, trolox equivalent antioxidant capacity and ORAC, oxygen radical absorbance capacity.
* P; P interactions are obtained with the general linear model (two-way ANOVA). Test Mann–Whitney test was used to compare the CRP level in the two categories of antioxidant intake (†P) or between two genotypic groups (‡P).
§ The P 1 value of the interaction (model 1) is adjusted for age (as continuous), supplement use (as categorical), smoking (as categorical), coffee and PUFA-w3 and total energy intake (as continuous) using ANCOVA test.
|| The P 2 value of the interaction (Model 2) further adjusted for sex (as categorical) using ANCOVA test.
¶ Obesity was defined as BMI ≥ 25 kg/m2.
Table 13. Interaction between apo a-II –265T > C polymorphism and the dietary TAC on the IL18 level in obese and non-obese patients

FRAP, ferric reducing ability of plasma; TRAP, total reactive antioxidant potential; TEAC, trolox equivalent antioxidant capacity and ORAC, oxygen radical absorbance capacity.
* P; P interactions are obtained with the general linear model (two-way ANOVA). Mann–Whitney test was used to compare the IL18 level in the two categories of antioxidant intake (†P) or between two genotypic groups (‡P).
|| The P 1 value of the interaction (model 1) is adjusted for sex (as categorical), supplement use (as categorical), smoking (as categorical), coffee and PUFA-w3 and total energy intake (as continuous) using ANCOVA test.
¶ The P 2 value of the interaction (model 2) further adjusted for age (as continuous) using ANCOVA test.
** The P 1 value of the interaction (model 1) is adjusted for age (as continuous), sex (as categorical), supplement use (as categorical), smoking (as categorical), PUFA-w3 and total energy intake (as continuous)using ANCOVA test.
†† The P 2 value of the interaction (model 2) further adjusted for coffee intake (as continuous) using ANCOVA test.
§ Obesity was defined as BMI ≥ 25 kg/m2.
Serum PTX3 level is significantly higher in T-allele carriers only in non-obese diabetic patients with lower DTAC, than the CC genotype (P TRAP = 0·031), while other measures did not illustrate this relationship (Table 11). Also, no significant genotype–DTAC interaction was observed in the serum level of PTX3 (Tables 8 and 11).
Serum hs-CRP level was significantly lower in T-allele carriers in individuals with higher DTAC (P FRAP = 0·010, P TRAP = 0·002, P TEAC = 0·003 and P ORAC = 0·020) (Table 9). This association between DTAC and the hs-CRP level was also observed in non-obese patients carrying the T allele (P FRAP = 0·002, P TRAP = 0002, P TEAC = 0·005 and P ORAC = 0·018) (Table 12).
Serum IL18 was lower in T carrier groups who consumed high-DTAC. But no gene–diet interaction was found in the whole population (Table 10). On the other hand, obese individuals with 2 copies of the minor allele (CC) who consumed greater amounts of DTAC tended to have greater serum IL18 compared with individuals with low intake of DTAC (P FRAP = 0·047 and P ORAC = 0·008). Also, this interaction was significant in obese patients both in crude (P FRAP = 0·048 and P ORAC = 0·018), adjusted model 1(P 1 FRAP = 0·036 and P 1 ORAC = 0·012) and also adjusted model 2 (P 2 FRAP = 0·027 and P 2 ORAC = 0·007) (Table 13).
Discussion
According to our knowledge, this study is the first attempt to examine the interaction between Apo A-II –265T > C polymorphism and DTAC intake on some oxidative stress and inflammatory markers in diabetic patients. In this regard, we have previously reported that the Apo A-II –265T/C SNP was associated with oxidative stress and inflammatory markers. Such that, we observed that the diabetic patients with CC genotype had lower SOD activity. Also, in the T-carrier group, the serum levels of PGF2α and hs-CRP were significantly higher in the obese v. non-obese subjects. Besides, we previously observed that obesity is a risk factor for increased oxidative stress and inflammation in the T carriers group(Reference Koohdani, Sadrzadeh-Yeganeh and Djalali18,Reference Koohdani, Sadrzadeh-Yeganeh and Djalali19) .
In this present study, we found that the levels of oxidative stress and inflammatory factors were still higher in the CC genotype group in individuals with higher DTAC. In another word, high-DTAC could not modify the adverse effects of being in the CC genotype. Moreover, we observed that the presence of the T allele in diabetic patients with an antioxidant-included diet is a protective agent against inflammation and oxidative stress. These results could reflect the anti-atherogenic properties of Apo A-II. Also, we founded that following a diet with high contents of antioxidant can prevent or delay the complications of diabetes in the T carrier genotype more effectively than the CC genotype.
In general agreement with our study, Moradi et al. have pointed out that losing weight through calorie restriction could increase the Paraoxonase-3 enzyme more efficiently in T allele carriers compared to C allele carriers.(Reference Moradi, Mahmoudi and Saedisomeolia39). In this regard, it has been reported that Paraoxonase-3 is an enzyme that plays an important role in the antioxidant properties of HDL and consequently protects against atherosclerosis(Reference Manco, Porzio and Carusone40). In addition, energy restriction exerts anti-oxidative effects in animals and humans through maintaining a proper cellular redox status and modulation of pro-inflammatory genes such as TNFα, IL-6 and CRP(Reference Rahman, Halade and Bhattacharya41). Also, one intervention study has reported that energy restriction for six week in twenty-eight diabetic patients resulted in a shift to smaller HDL sub-fractions in patients carriers of the –265 T allele compared to the CC genotype(Reference Moradi, Mahmoudi and Saedisomeolia42). In this regard, Kontush et al. indicated that small and dense HDL has an important role in protecting LDL from oxidation(Reference Kontush, Chantepie and Chapman43). Therefore, it seems that improved nutrition may be considered as an effective way to reduce the risk of CVD in the T carrier group.
In the current survey, we also observed a significant gene–diet interaction on the inflammatory factors only in obese diabetic patients. It has been reported that the phenotypic response to diet is determined partly by the baseline value of the phenotype that is itself affected by genetic factors(Reference Pérusse and Bouchard44). In this regard, obesity is known to increase inflammation. Also, researchers stated that obesity is an important risk factor for elevated levels of inflammation and consequently CVD in the T allele carrier group(Reference Koohdani, Sadrzadeh-Yeganeh and Djalali18,Reference Koohdani, Sadrzadeh-Yeganeh and Djalali19) . Our findings suggest that diabetic patients with obese status may express a more effective response to lifestyle modification and antioxidant-rich foods intake. The possible mechanism may be due to the association of the Apo A-II with human appetite and satiety signals(Reference Corella, Arnett and Tsai45). However, further studies are needed to get a better understanding of the genes–DTAC interactions, and their effect on inflammatory parameters in obese patients.
Regarding gene–DTAC interaction, some nutritional genomics studies illustrated interactions between Apo A-II gene polymorphism and a Mediterranean diet as an antioxidant-rich dietary pattern(Reference Ros, Martínez-González and Estruch46,Reference Corella, Peloso and Arnett47) . Besides, Keramat et al. reported that there is a significant interaction between genetic variations at this locus with environmental factors such as dietary intake of anti-inflammatory fatty acids (e.g. n-3 PUFA and MUFA) and pro-inflammatory FA (e.g. SFA) on inflammatory markers(Reference Keramat, Sadrzadeh-Yeganeh and Sotoudeh26). Also, they found that a higher intake of n-3 PUFA and MUFA was associated with decreased serum levels of IL-18 and hs-CRP in the CC genotype. Moreover, Zamani et al. indicated that there is a positive association between n-3 PUFA intake and serum SOD activity in the CC genotype, which is inconsistent with our results(Reference Zamani, Sadrzadeh-Yeganeh and Sotoudeh20). In this regard, some studies have shown that n-3 PUFA, like dietary antioxidants, have anti-inflammatory properties. The anti-inflammatory mechanism of n-3 PUFA is related to inhibition of the toll-like receptors. Whereas antioxidants exert this anti-inflammatory impact through inhibiting nuclear factor-κB(Reference Kim, Jung and Lee48). According to our finding, two studies indicated that C homozygote carriers diabetic patients appeared to be less modifiable with less the inflammatory potential of the diet(Reference Karimi, Tondkar and Sotoudeh49) and high antioxidants capacity(Reference Azad, Yaseri and Daneshzad50). Based on the recent studies in this area of research, it seems that anti-inflammatory fatty acids and antioxidant-rich diets can be effective in the prevention of the progression of diabetes complications in T allele carriers and C-allele homozygotes, respectively.
The mechanisms behind these novel observed interactions are not still clearly understood; however, multiple lines of evidence support our findings. Apo A-II is the second apolipoprotein in HDL and plays a complex and unknown role in lipoprotein metabolism and atherosclerosis susceptibility. The −265T/C polymorphism can be applied to examine the physiological role of Apo A-II in humans. It has been suggested that −265T/C SNP is found in the middle of element D on chromosome 1 and affects binding nuclear factors (such as AIID1, AIID4 and AIID2) to the promoter of the Apo A-II gene. Such that, this SNP probably interrupts the delicate balance of binding of the nuclear factors. The corollary is that the transcription rate of the Apo A-II gene and its plasma concentration are reduced in constructs containing the −265C site compared with constructs containing the −265T site(Reference van’t Hooft, Ruotolo and Boquist14,Reference Cardot, Pastier and Lacorte51) .
There are some dialectical findings regarding the relation between serum Apo A-II level, oxidative stress and inflammation status. Some researchers indicated an inverse relationship between Apo A-II level and the risk of CVD in type 2 diabetic patients(Reference della Rovere, Lapolla and Sartore17)and healthy people(Reference Birjmohun, Dallinga-Thie and Kuivenhoven52). Also, it has been reported that the serum level of Apo A-II is negatively correlated with hs-CRP as an inflammatory marker which is directly related to oxidative stress(Reference Yi, Jeong and Lee53). In contrast, some researchers indicated that serum Apo A-II concentration may be a powerful risk marker of CAD in T2DM patients(Reference Syvänne, Kahri and Virtanen54). Also, Xiao et al. revealed that Apo A-IIrs5082 SNP appears to be cardioprotective(Reference Xiao, Zhang and Wiltshire55). Apo A-II may be effective on anti-atherogenic pathways through the amphipathic α-helices as structural domains of this apolipoprotein, which are related to anti-atherogenic functions(Reference Shelley, Sharpe and Baralle56). Also, Apo A-II interacts with heat shock proteins that are related to repair damaged proteins induced by various stresses. In this regard, it has been reported that among the heat shock proteins family, HSP60 is a high-affinity HDL-binding protein particularly via binding of the Apo A-II(Reference Blanco-Vaca, Escolà-Gil and Martín-Campos57).
The findings of animal studies are also inconsistent. Some studies have shown that overexpression of human Apo A-II in transgenic mice is associated with decreased PON1 activity and increased the size of atherosclerotic lesions(Reference Ribas, Sánchez-Quesada and Antón58,Reference Castellani, Navab and Van Lenten59) . However, one animal study reported that human Apo A-II transgenic rabbits exhibited lower levels of serum CRP and blood leukocytes as an inflammatory marker and higher PON1 activity compared with non-transgenic rabbits(Reference Wang, Niimi and Nishijima16). Our results are consistent with animal studies that have been performed in rabbits. The reason for the discrepancy in the results of animal studies is probably due to the difference in the amount and type of Apo A-IIs expressed(Reference Wang, Niimi and Nishijima16). Also, studies have been conducted in mice that are not the best animal model for examining human Apo A-II metabolism(Reference Birjmohun, Dallinga-Thie and Kuivenhoven52,Reference Brousseau and Hoeg60) . Human Apo A-II in transgenic mice is higher than plasma human Apo A-II concentration, which could lead to malfunction of the HDL antioxidant system(Reference Ribas, Sánchez-Quesada and Antón58). However, one animal study performed in the transgenic mice indicated that human Apo A-II protected VLDL from oxidation more efficiently than the HDL of controls(Reference Boisfer, Stengel and Pastier61).
On the other hand, a diet rich in antioxidants may be effective in the prevention of CVD. The possible mechanism may be due to the NF-κB-regulated pathway which is be involved in the production of parameters related to inflammation(Reference Kobayashi, Murakami and Sasaki33). Also, antioxidants may regulate adiponectin expression via peroxisome proliferator-activated receptor-g(Reference Detopoulou, Panagiotakos and Chrysohoou62). Moreover, the observed associations in the current study may be due to the fibre content of foods with high DTAC. The typical antioxidant-rich foods are high in fibre and provide a synergistic effect on the level, function and bioaccessibility of the antioxidant substances present in the diet(Reference Saura-Calixto63). Fibre and short-chain fatty acids from their fermentation in the intestine are another factor that could also contribute to the relation between dietary TAC and CVD-related risk factors through inhibit NF-κB and stimulate the peroxisome proliferator-activated receptor-a pathway(Reference Galisteo, Duarte and Zarzuelo64). However, in one study has been stated that the inverse association between high-DTAC and mortality remained significant even after adjusting for fibre intake(Reference Bastide, Dartois and Dyevre65). Other studies found no relationship between DTAC and cardiometabolic risk factors(Reference Stringa, Brahimaj and Zaciragic66,Reference Yang, Chung and Floegel67) . Did not capture the usual dietary intake and use only one method to estimate DTAC may be the reasons for the lack of association observed in some studies(Reference Mozaffari, Daneshzad and Surkan3). Some documents revealed that the antioxidant-rich diets are associated with the serum TAC(Reference Khalil, Gaudreau and Cherki68,Reference Pitsavos, Panagiotakos and Tzima69) . However, we did not find any significant association between DTAC and rs5082 variants on this factor. This finding is in agreement with other studies, which suggest that DTAC may not be related to serum TAC(Reference Rautiainen, Serafini and Morgenstern70,Reference Pellegrini, Salvatore and Valtueña71) . It seems that serum TAC reaches its peak plasma concentration 2 h after consuming antioxidant-rich foods(Reference Wang, Yang and Lee72). On the effect of diet on the genome, two human studies have shown that adherence to a healthy lifestyle(Reference Sun, Shi and Prescott73) and higher DTAC(Reference García-Calzón, Moleres and Martínez-González74) have favourable effects on telomere length, which are highly sensitive to the hydroxyl radical.
As mentioned before, a gold standard or specific method for measuring the DTAC is not available yet. Generally, there are two principal mechanisms that antioxidants can neutralise radicals: single electron transfer mechanism, which is the base of FRAP and TEAC methods, and hydrogen atom transfer mechanism, which is the base of ORAC and TRAP methods(Reference Prior, Wu and Schaich75). Redox-related status is multifactorial, and every single method provides specific information(Reference Serafini and Del Rio76). In our study, the most significant interactions were observed in single electron transfer-based methods, particularly in the TEAC method.
Limitation
The strength of this study is that it is the first attempt to investigate the interaction between rs5082 genotypes and DTAC on some oxidative stress and inflammatory marker in the Middle East and that it was a community-based study. This research conducted in Tehran. Tehran, as the third most populous metropolis in the Middle East, is always faced with migration from other cities and therefore in terms of population distribution includes almost all ethnicities. Thus, cross-sectional studies with a genetic approach can be the best choice. To calculate the antioxidant potential, four methods to estimate DTAC (FARP, TRAP, TEAC and ORAC) were used. In addition, this gene–diet interaction was also investigated in terms of patients’ weight status (obese/non-obese). Also, identification of these gene–diet interactions could be useful in recommendations or proper planning for personal nutrition to the prevention and management of CVD in diabetic patients.
It is essential consideration some limitations in this study. First, the cross-sectional design of the study prevented us from inferring causation. Second, DTAC indexes were calculated based on international databases. Since the antioxidant content may vary according to geographic location, this may lead to underestimation of DTAC, attenuation or invalidity of the assessed association. Third, subjects with high-DTAC may also have healthier eating behaviours that may affect our findings. To reduce these errors, the findings were adjusted for several confounding factors, including smoking, physical activity, obesity and supplement use. Fourth, the FFQ that used for the evaluation of the usual intake of participants was not particularly validated for the estimation of diet’s TAC. With regard to DTAC estimation, when no data were available regarding cooked foods (typically have higher DTAC values), the value of raw foods was substituted. Fifth, metabolism and bioavailability of antioxidants are not considered in the DTAC. Sixth, we lacked data on socio-economic status, anxiety status, sleep status, body composition, alcohol consumption and blood glucose as a potential moderator of CVD. Seventh, dietary supplements did not consider for calculating DTAC. Eighth, it is possible that observed associations affected by functional polymorphisms in other genes.
Conclusion
This study indicates that this could be a novel link between DTAC and Apo A-II rs5082 polymorphism in diabetic patients. Based on these results, dietary recommendations for antioxidant-rich foods intake might be useful in the delay or prevention of diabetes complications in the T carrier genotype more effectively than the CC genotype. Future researches are needed to confirm these results, by replicating the same study in different populations and preferably with a bigger sample size.
Acknowledgements
We would like to acknowledge all patients who participate in this study.
This research has been supported by Tehran University of Medical Sciences &Health Services (grant number: (97-03-161-41169)). Also, this study was approved by the ethics committee at Tehran University of Medical Sciences (IR.TUMS.VCR.REC.1398.298).
F. K. and M. Y. designed research. B. J. A. conducted research. B. J. A. and M. Y. analysed data. B. J. A. was involved in drafting the manuscript. E. D. edited the manuscript and was involved in acquisition of data. F. K. had primary responsibility for final content. All of the data are available with reasonable request from the corresponding author. All authors read and approved the final manuscript.
The authors declare that they have no conflict of interest


