


Diet is one of the most important modifiable risk factors for some non-communicable diseases (NCDs), including cardiovascular disease (CVD), some cancers and diabetes mellitus (DM)(1). Since diet is comprised of a combination of nutrients and other bioactive compounds, where some interact with each other synergistically and/or antagonistically(Reference Ocké2), using a single nutrient approach in epidemiological studies may underestimate the effects of nutrients on health outcomes(Reference Jacobs and Tapsell3). It is necessary to take into account the inter-correlation of nutrient constituents contained in each meal(Reference Jannasch, Kroger and Schulze4). A number of approaches are used to measure dietary pattern (DP)(Reference Schulze, Martínez-González and Fung5). One main approach is a posteriori or data-driven that identifies DP from comprehensive dietary data through multivariate analysis such as principal component, exploratory factor or cluster analysis(Reference Ocké2,Reference Tapsell, Neale and Probst6) . Another approach is a priori or investigator-driven in which a diet quality index (DQI) is constructed based on pre-defined scoring criteria for adherence to dietary recommendations, such as dietary guidelines(Reference Newby and Tucker7–Reference Kant9) or a specific DP(Reference Ocké2). Based on a pre-defined ‘ideal diet’, a DQI can rank individuals within a population from lower to higher diet quality (DQ)(Reference Hodge and Bassett10). It can describe the overall diet of the population of interest and can be replicated in various populations(Reference Moeller, Reedy and Millen11). It is easy to understand, and the summation technique is more straightforward than any other statistical methods of DP analysis(Reference Moeller, Reedy and Millen11).
In studies assessing the relationship between diet and NCD, overall DQ measured by construction of DQI based on the dietary recommendations or guidelines(Reference Newby and Tucker7–Reference Kant9) is widely used. The growing body of evidence suggests that DQ has a preventive role in NCD(Reference Hlaing-Hlaing, Dolja-Gore and Tavener12–Reference Shafiei, Salari-Moghaddam and Larijani18) and NCD multimorbidity (MM)(Reference Hlaing-Hlaing, Dolja-Gore and Tavener12), with studies showing that people with higher scores in DQI had reduced risk of disease outcomes. Of course, separating the effect of diet from other potential confounders can be difficult, and a range of study designs and statistical methods may be needed.
A number of studies have been conducted to measure the associations between DQ and incidence of NCD in a large population-based study setting, the Australian Longitudinal Study on Women’s Health (ALSWH)(Reference Hlaing-Hlaing, Dolja-Gore and Tavener12,Reference Vissers, Waller and van der Schouw19–Reference Hlaing-Hlaing, Dolja-Gore and Tavener27) . Analyses performed were cross-sectional(Reference Hlaing-Hlaing, Dolja-Gore and Tavener12,Reference Vissers, Waller and van der Schouw21,Reference Lai, Hure and Oldmeadow22,Reference Alhazmi, Stojanovski and McEvoy25,Reference Hlaing-Hlaing, Dolja-Gore and Tavener27) or longitudinal(Reference Vissers, Waller and van der Schouw19,Reference Shivappa, Schoenaker and Hebert20,Reference Lai, Oldmeadow and Hure23,Reference Jackson, MacDonald-Wicks and McEvoy24,Reference Lee, Bradbury and Yoxall26) . Longitudinal data, which contain repeated measures for an individual participant, are correlated(Reference Zeger, Liang and Albert28), and that correlation needs to be adjusted for in analysis(Reference Carrière and Bouyer29). There are two common approaches to longitudinal analysis: (i) subject-specific and (ii) population-averaged(Reference Zeger, Liang and Albert28). In the subject-specific approach, it is assumed that there is a parametric distribution in the population, and the source of the covariance among repeated observations for a subject is explained(Reference Zeger, Liang and Albert28). In the population-averaged approach, the response or outcome can be modelled without considering subject to subject variability, and the source of the covariance among repeated observations for a subject is only described(Reference Zeger, Liang and Albert28).
The population-averaged or generalised estimation equation (GEE) approach provides the estimates of population average effects over follow-up periods by considering within-person correlation from repeated measurements of each individual(Reference Hanley, Negassa and Edwardes30). Correlation structures considered in GEE are ‘independent’ structure, assuming that correlation between time points is independent, ‘exchangeable’ structure, assuming that there are equal correlation between all possible measurement pairs, ‘autoregressive’ structure, assuming the highest correlation for adjacent times and reducing correlation with increasing distance between time points, and ‘unstructured’, not assuming any specific correlation(Reference Hin and Wang31). The appropriate correlation structure is selected according to the values of the quasi-likelihood information criterion(Reference Hin and Wang31). Both time-invariant(Reference Zeger, Liang and Self32) and time-varying covariates(Reference Stiratelli, Laird and Ware33) are used in the GEE approach. By using the GEE approach, incidence of NCD over time in study participants at population level according to proportions of exposure can be assessed(Reference Carrière and Bouyer29).
Exploring the longitudinal relationship between DQ and NCD in childbearing women is of interest, because the findings from the ALSWH study suggest there is an increasing trend of NCD occurrence in women aged 25–47 years(Reference Harris, Egan and Forder34). In our previous studies, we have investigated the association between baseline DQ and incident NCD of participants from the ALSWH 1946–1951 cohort(Reference Hlaing-Hlaing, Dolja-Gore and Tavener12) and 1973–1978 cohort(Reference Hlaing-Hlaing, Dolja-Gore and Tavener27), using a repeated cross-sectional design. Based on the results of our systematic review(Reference Hlaing-Hlaing, Pezdirc and Tavener35), we selected three dietary indices measuring various conceptual perspectives in our analysis of data from the ALSWH 1946–1951 cohort: (1) Healthy Eating Index for Australian Adults-2013 that assesses meeting Australian Dietary Guidelines-2013(36); (2) Mediterranean Diet Score that assesses following a specific DP; and (3) Alternative Healthy Eating Index-2010 (AHEI-2010) that assesses adhering DP that highlights foods and nutrients for NCD prevention. Built on our first analysis, the AHEI-2010 was selected in the 1973–1978 cohort by considering its relevance to up-to-date dietary recommendations(Reference Shivappa, Hebert and Kivimaki37) and favourable performance because of its comprehensive measurements for dimension (adequacy, moderation and balance), both foods and nutrients components for healthy and unhealthy ingredients, metric scaling with normative cut points(Reference Hlaing-Hlaing, Pezdirc and Tavener35). Longitudinal analysis testing the association between DQ and NCD is necessary to (i) improve the quality of methods used in studies of diet–disease relationships and (ii) design future effective dietary intervention for NCD prevention. The aim of the current study was therefore to examine the longitudinal relationship between DQ and NCD, measured in Australian women from the ALSWH born between 1973 and 1978 (25–30 years old at baseline) over a 15-year period. The NCD outcomes were coronary heart disease (CHD), hypertension (HT), asthma, cancer (except skin cancer), DM, depression and/or anxiety, and MM.
Materials and methods
Study sample
The current study used data from the ALSWH, an ongoing prospective cohort study that commenced in 1996(Reference Dobson, Hockey and Brown38). Approximately 45 000 women across three cohorts were recruited: those born in 1973–1978 (aged 18–23 years), 1946–1951 (aged 45–50 years) and 1921–1926 (aged 70–75 years) were selected from the Medicare database (Australia’s government-funded universal health care cover)(Reference Dobson, Hockey and Brown38). In 2013, a new cohort of women born between 1989 and 1995 (n 17 012) were recruited. The Human Ethics Committees of the University of Newcastle (approval number: h–076–0795) and University of Queensland (approval number: 200400224) approved the study methods(Reference Dobson, Hockey and Brown38). Further details about the ALSWH on recruitment details, baseline characteristics and attrition rates have been described elsewhere(Reference Dobson, Hockey and Brown38–Reference Loxton, Tooth and Harris40).
The current analysis was performed in the 1973–1978 cohort. Survey 1 (S1) was conducted in 1996 (n 14 247, aged 18–23 years), and these women have been followed through on a roughly 3-year rolling schedule in 2000 (survey 2, S2), 2003 (survey 3, S3), 2006 (survey 4, S4), 2009 (survey 5, S5), 2012 (survey 6, S6), 2015 (survey 7, S7) and 2018 (survey 8, S8). Dietary information was collected at S3 (aged 25–30 years) and again at S5 (aged 31–36 years), using a Food Frequency Questionnaire (FFQ) known as the Dietary Questionnaire for Epidemiological Studies-version 2 (DQES-v2).
We included women who responded at least once between S4 (2006, aged 28–33 years) and S8 (2018, aged 40–45 years). Women were excluded from the current analyses if they had missing data on diet at both S3 and S5 or had NCDs (CHD, HT, cancer and DM) recorded at S1, S2 and S3. There may be fluctuations with acute episodes in depression and/or anxiety(Reference Ayuso-Mateos, Nuevo and Verdes41), and a high prevalence of asthma in this age group(Reference Dobson, Forder and Hockey42). Therefore, we did not exclude women who had a history of depression and/or anxiety, or asthma; however, adjustments were made for the history of these conditions and a current episode was considered an incident case. In total, 8022 women from S3 (2003) and onwards were included (Fig. 1).

Fig. 1. Selection of participants from the Australian Longitudinal Study on Women’s Health (ALSWH), born in 1973–1978. *NCDs at or before survey 3 were coronary heart disease, hypertension, cancer and diabetes mellitus.
Measurement of diet
At S3 (2003) and S5 (2009), dietary intake of the ALSWH 1973–1978 cohort was measured using the DQES-v2(Reference Ireland, Jolley and Giles43). The participants were required to indicate their usual consumption of seventy-four food items and six alcoholic beverages in the preceding year(Reference Ireland, Jolley and Giles43). Food items were asked on a ten-point frequency scale, ‘Never’, ‘Less than once per month’, ‘1 to 3 times per month’, ‘1 time per week’, ‘2 times per week’, ‘3 to 4 times per week’, ‘5 to 6 times per week’, ‘1 time per day’, ‘2 times per day’ and ‘3 or more times per day’. Alcoholic beverages were asked with options ‘Never’, ‘Less than once per month’, ‘1 to 3 days per month’, ‘1 day per week’, ‘2 days per week’, ‘3 days per week’, ‘4 days per week’, ‘5 days per week’, ‘6 days per week’ and ‘Everyday’(Reference Hodge, Patterson and Brown44). Additional questions were also assessed: amount of intakes for fruit, milk, bread, sugar, egg; and types of consumed food for vegetables, milk, bread, spread and cheese(Reference Hodge, Patterson and Brown44). Portion-size photographs of vegetables, potatoes, meat and casserole dishes were provided to guide for reporting a standard serving size(Reference Hodge, Patterson and Brown44). Nutrient intakes were computed from the Australian Food Composition Database (NUTTAB95)(Reference Lewis, Milligan and Hunt45). The validation of the FFQ was investigated in childbearing women using a 7-d weighed food record, and the results showed moderate to strong energy-adjusted correlation coefficients for nutrient intakes (ranging from 0·28 for vitamin A to 0·78 for carbohydrates)(Reference Hodge, Patterson and Brown44).
Measurement of the Alternative Healthy Eating Index-2010
In this study, DQ was measured as the AHEI-2010 at S3 and S5. Selection of the AHEI-2010 was based on its components which are linked with prevention of NCD(Reference Shivappa, Hebert and Kivimaki37), having preferable features of a DQI based on our systematic review(Reference Hlaing-Hlaing, Pezdirc and Tavener35), and the most sensitive index that associated with more NCD in our previous ALSWH 1946–1951 cohort analysis(Reference Hlaing-Hlaing, Dolja-Gore and Tavener12). The scoring criteria for the AHEI-2010 is provided in online Supplementary Table 1.
The components of the AHEI-2010 are foods and nutrients being useful in prevention of CVD, some cancers and DM(Reference McCullough and Feskanich46,Reference Chiuve, Fung and Rimm47) . This index builds on the original Healthy Eating Index (HEI)(Reference Kennedy, Ohls and Carlson48) and the original AHEI(Reference McCullough and Feskanich46). It is composed of eleven components: six components for which the highest intakes are presumed to be healthy (vegetables, fruits, wholegrains, nuts and legumes, long-chain n-3 fats, and polyunsaturated fatty acid (PUFA)), four components for which the lowest intakes are presumed to be healthy (sugar-sweetened beverages (SSB) and fruit juice, red and processed meat, trans-fat, and sodium (Na))(Reference Chiuve, Fung and Rimm47) and one component for which the moderate intakes are presumed to be healthy (alcohol). Each component is assigned to a minimum score of 0 and a maximum score of 10, with intermediate values scored proportionally to their intake(Reference Chiuve, Fung and Rimm47).
The scoring of each component was obtained using data from the DQES-v2. Measurements of positively weighted components were performed. All vegetables intakes except potato (green vegetables, orange vegetables, cruciferous vegetables and tuber vegetables) were summed, and servings were calculated. Servings of whole fruits (citrus, melon, berry, pome, stone and tropical) and nuts and legumes of participants were calculated. Intakes of total wholegrain in grams and long-chain n-3 fats in milligrams were calculated. Intakes of PUFA as percentage of energy was computed. Minimum and maximum scores were assigned as: vegetables (0–5 servings per d), whole fruits (0–4 servings per d), nuts and legumes (0–1 serving per d), wholegrain (0–75 grams per d), long-chain n-3 fats (0–250 milligrams per d), and PUFA (2–10 % of energy).
For negatively weighted components, servings of SSB and fruit juice, and red and processed meat were computed. Intakes of trans-fat as percentage of energy and Na as decile (milligrams per d) were computed. Minimum scores were assigned to higher intakes: SSB and fruit juice (≥ 1 serving/d), red and processed meat (≥ 1·5 servings/d), trans-fat (≥ 4 % of energy), and Na (highest decile (mg/d))(Reference Chiuve, Fung and Rimm47). Maximum scores were assigned to no SSB and fruit juice, no red and processed meat, ≤ 0·5 % of energy from trans-fat or lowest decile (mg/d) of Na(Reference Chiuve, Fung and Rimm47). Participants who consumed alcohol ≥ 2·5 drinks/d were assigned the minimum score and 0·5–1·5 drinks/d were assigned the maximum score(Reference Chiuve, Fung and Rimm47). All component scores are summed to obtain a total AHEI-2010, ranging from 0 (poor adherence) to 110 (excellent adherence)(Reference Chiuve, Fung and Rimm47). Detailed scoring of the AHEI-2010 has been previously reported(Reference Chiuve, Fung and Rimm47).
Measurement of non-communicable diseases
In this study, incidence of NCDs (CHD, HT, asthma, cancer (except skin cancer after S4), DM, and depression and/or anxiety) and MM were the main outcome variables. An incidence case of each disease was counted by self-reported diagnosis or treatment of respective NCD in the ALSHW survey. Self-reported NCD data in the ALSWH participants have been shown to be acceptable(Reference Cristina, Williams and Parkinson49,Reference Stavrou, Vajdic and Loxton50) . At S1 in 1996, participants were asked if a doctor ever diagnosed them with heart disease, HT (high blood pressure), asthma, cancer and/or diabetes (high blood sugar). Women’s depression and anxiety conditions were firstly assessed in S2 as depression (not postnatal) and anxiety disorder. Different wording was used in the assessment of NCD status such as HT other than during pregnancy for HT (from S2 to S4), cancer (specify type) (from S2 to S4), skin cancer and other cancer for cancer (from S5 to S8), and non-insulin-dependent (type 2) diabetes for DM (S2 to S8). Since self-reported data on cancer were separately asked at S5–S8, skin cancer was excluded in calculating the occurrence of cancer during these periods.
NCD were considered as enduring conditions, meaning that participants who reported NCD at any survey were regarded as having that NCD continuously in all successive surveys, except for asthma, and depression and/or anxiety. MM was considered as the presence of two or more of any combination of CHD, HT, asthma, cancer, DM, and depression and/or anxiety between S4 in 2006 and S8 in 2018.
Measurement of covariates
In epidemiological studies, potential confounders are identified and adjusted for in further statistical analyses to obtain unbiased effect sizes(Reference Hébert, Frongillo and Adams51). Various approaches such as statistical prerequisites, criteria for selecting variables and variable selection algorithms are performed in selecting covariates or confounders(Reference Heinze, Wallisch and Dunkler52). The Directed Acyclic Graphic (DAG), selecting variables based on background knowledge, is one of these approaches(Reference Heinze, Wallisch and Dunkler52). A DAG is a non-parametric diagrammatic display of the anticipated data-generating process for a group of variables in examining the causal associations between variables(Reference Tennant, Murray and Arnold53). By viewing DAG, the planned adjustment set of variables for unbiased causal estimand (the desired causal effect of the exposure on the outcome) can be observed(Reference Textor, Hardt and Knüppel54). To specify models that are parsimonious, DAG that proposed the association between the AHEI-2010, covariates and NCDs were constructed (online Supplementary Fig. S1–S7).
In the present study, sociodemographic, lifestyle, previous disease status and childbearing variables at respective surveys were considered as covariates in model adjustments. Selection of covariates based on background knowledge and literature was reported in the previous study(Reference Hlaing-Hlaing, Dolja-Gore and Tavener27). Details on categorisation of covariates, harmonisation of variables related to medication and childbearing have been reported(Reference Hlaing-Hlaing, Dolja-Gore and Tavener27).
Of variables measuring sociodemographic characteristics (residence status, marital status, education, occupation and ability to manage income), the correlation between the latter three variables is significant. Moreover, evidence highlights the inclusion of income as a covariate in diet–health relationship studies, rather than education(Reference Temple55). Lifestyle-related variables were alcohol consumption, smoking, physical activity, prescribed medication and body mass index (BMI). Of these, alcohol consumption was measured as a component in the AHEI-2010(Reference Chiuve, Fung and Rimm47), and smoking was reported to be significantly associated with physical activity(Reference Al-Ibrahim and Jackson56). Regarding prescribed medication in the diet–NCD relationship, we have suggested that its potential involvement in the pathway depends on underlying disease condition(Reference Hlaing-Hlaing, Dolja-Gore and Tavener27). BMI was deemed as a mediator, meaning that it can be altered by DQ(Reference Asghari, Mirmiran and Yuzbashian57) and can impact NCD outcomes(Reference Peacock, Bogossian and McIntyre58–Reference Gondek, Bann and Brown64). Previous disease status of women was considered as a potential confounder in asthma, depression and/or anxiety, and MM. Since the women were of childbearing age, we included variables measuring parity, history of breast-feeding, history of gestational diabetes mellitus for DM, and history of HT in pregnancy for CHD and HT in the adjusted models. Total energy intake has been considered in model adjustment in nutritional epidemiology(Reference Willett65). However, we found that there was significant correlation between the AHEI-2010 and total energy intake of our participants (r = –0·21, P < 0·0001). Additionally, total energy intake of those who developed NCD were not different with those who did not.
According to above reasons, we did not include education, occupation, alcohol consumption, smoking, physical activity, prescribed medication, BMI and total energy intake for adjustments in our main analyses. The covariates included in DAG for adjusting for in the main analyses were those measuring sociodemographic characteristics such as residence, marital status, ability to manage income; previous disease status such as history of asthma for asthma, depression and/or anxiety for depression and/or anxiety, and MM; and childbearing such as parity, history of breast-feeding, history of HT in pregnancy for CHD and HT, and history of gestational diabetes mellitus for DM.
For the management of missing data (0·15–12·15 % for covariates across S3 to S8), the responses from both the preceding and subsequent surveys (for S4 to S7) and from the preceding survey (for S8) were carried forward in the first instance, or back, to fill missing items of covariates (area of residence, marital status, education, occupation, ability to manage income, physical activity and taking prescribed medicine)(Reference Engels and Diehr66). After filling, no variable had more than 5 % of the total data missing. Childbearing variables had missing values less than 5 %, and the carry-forward approach for missing values was not applied. Proportions of missing values, before and after applying imputation of missing data for covariates (area of residence, marital status, education, ability to manage income, physical activity and taking prescribed medicine) across S3 to S8 were provided (online Supplementary Table 2).
Statistical analysis
Continuous data were assessed for normality and expressed as mean and standard deviation. Categorical data were described as number and percentage. Number of respondents in each survey and incidence of NCDs were reported (online Supplementary Tables 3 and 4). The sociodemographic and lifestyle variables of women at S3 according to categories of the AHEI-2010 were investigated using the ANOVA for continuous variables and χ 2 test for categorical variables.
To examine the longitudinal association between the AHEI-2010 (based on the FFQ data at S3 and S5) and incident NCDs (S4–S8), logistic regression models applying GEE approach(Reference Liang and Zeger67) were used. A binomial distribution with logit link function using an independent correlation was applied for all analyses. To examine improved model fit, the quasi-likelihood information criterion(Reference Hin and Wang31) was used, with lower values indicating better fit.
Three models were constructed to analyse the longitudinal association between the AHEI-2010 and NCDs:
-
(i) time-invariant models,
-
(ii) time-varying models, and
-
(iii) time-lagged models.
In model (i), AHEI-2010 and covariates at S4 were used as time-invariant, such that only baseline measurements were used, across all time periods. In model (ii), time-varying covariates and outcomes were considered in analyses. Modelling was performed by using AHEI-2010 and covariates from the same survey at which NCD outcomes were reported. In our final model (iii), temporal relationships between AHEI-2010 and NCDs were investigated. Modelling was performed by assuming the effects of repeated measurements of exposure and covariates at preceding or lagged surveys (S3–S7) were related to NCDs.
The time-invariant model (i) was constructed to examine the association between AHEI-2010 at S3 and incidence of NCDs (S4–S8), adjusting for covariates at S4 (residence, marital status, ability to manage on income, parity, history of breast-feeding, history of gestational diabetes mellitus for DM and history of HT in pregnancy for CHD and HT).
The time-varying model (ii) was constructed to investigate the population-averaged effects of time-varying AHEI-2010 and covariates (S4–S8) on incidence of NCDs (S4–S8). Since diet was measured at S3 and S5, the AHEI-2010 at S3 was applied for S4, and S5 AHEI-2010 was applied for S6, S7 and S8.
The lagged model (iii) was constructed to investigate the population-averaged lagged effects of AHEI-2010 and covariates (S3–S7) on incidence of NCDs (S4–S8). Since diet was measured at S3 and S5, the AHEI-2010 at S3 was applied for S4, and S5 was applied for S6 and S7.
For asthma, two GEE analyses were performed: one model included ‘history of asthma’ as a covariate, and another model did not. The odds ratio (OR) and 95 % confidence interval (CI) for NCD outcomes with respect to the AHEI-2010 were calculated considering the lowest quintile as the reference category. Survey wave indicator was included in all models to investigate any secular trends in NCD risks.
To explore potential selection bias, comparison of sociodemographic and lifestyle characteristics of participants who had been excluded and included in the current study was performed (online Supplementary Table 5). Furthermore, sensitivity analyses that used education, occupation, physical activity and taking prescribed medicine as covariates in GEE analyses were performed (online Supplementary Table 6). The models with AHEI-2010 only were also performed to investigate the effects of diet (only) on NCD outcomes (online Supplementary Table 7). We tested effect modification by adding an interaction term between the survey time and AHEI-2010 in the main analysis (online Supplementary Table 8). P value < 0·05 is considered significant, with consideration given to multiple comparisons, and all statistical tests are two-sided. All analyses were conducted using Stata version 15.1 (StataCorp LP).
Results
The study cohort included 8022 women who were free of NCDs at S3 in 2003, with a mean AHEI-2010 at S3 of 51·6 ± 11·0 (range: 19–91). Women with a higher AHEI-2010 score were more frequently in a married/de facto relationship, living in an urban area, graduated from a university, in paid employment, able to manage on income easily and did more physical activity than women with lower DQ (Table 1).
Table 1. Sociodemographic and lifestyle variables at survey 3 (in 2003) related to the first (Q1, low diet quality) and fifth (Q5, high diet quality) quintiles of the Alternative Healthy Eating Index-2010 (AHEI-2010) of the sampled women (n 8022)
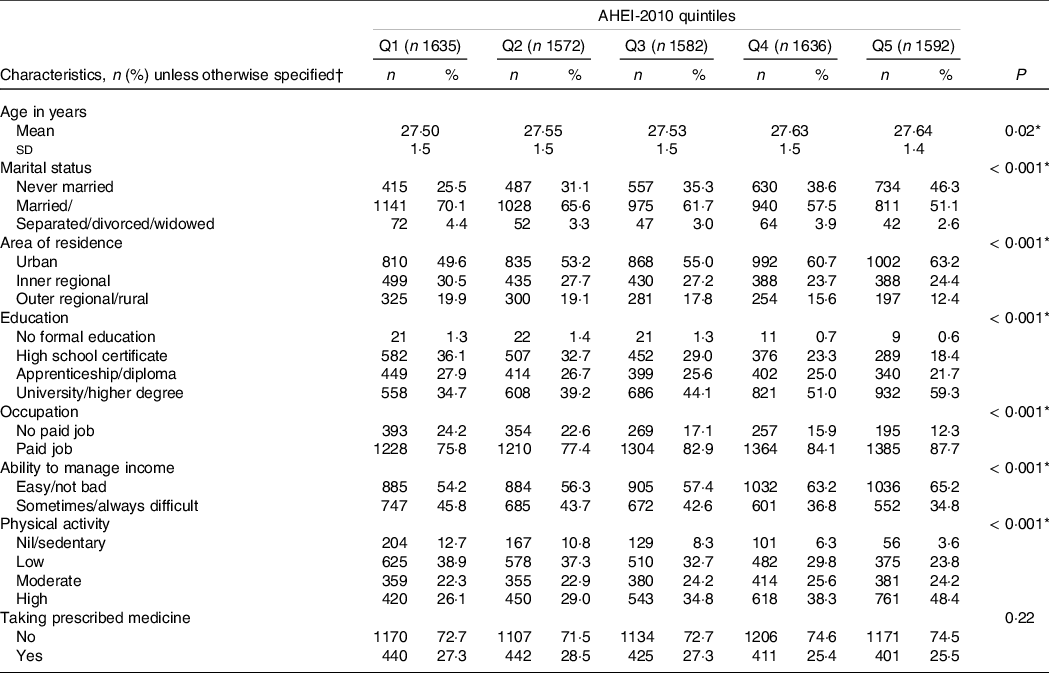
AHEI-2010: Alternative Healthy Eating Index-2010.
* Statistically significant (P < 0·05). Values for categorical variables are given as ‘number (percentage): n (%)’ and for continuous variable as ‘mean (standard deviation): mean (sd).’
† Due to missing data, the sum for each characteristic may not equal n.
Time-invariant model (model i), time-varying model (model ii) and the lagged model (model iii) examining the association between the AHEI-2010 and risk of common NCD (including MM) are shown in Table 2.
Table 2. Longitudinal associations between the Alternative Healthy Eating Index-2010 (AHEI-2010), covariates and risk of common non-communicable diseases (including multimorbidity) for women from the 1973–1978 Australian Longitudinal Study on Women’s Health cohort

AHEI-2010, Alternative Healthy Eating Index-2010; CHD: coronary heart disease; DM: diabetes mellitus; NCD: non-communicable disease; HT: hypertension. OR (95 % CI) described in the table is the odds of having NCDs (each disease, multimorbidity), quintile 5 (high diet quality) compared with quintile 1 (low diet quality) of the AHEI-2010.
Model i: generalised estimation equation adjusted for time-invariant covariates at S4 only.
Model ii: generalised estimation equation adjusted for time-varying covariates at S4–S8.
Model iii: generalised estimation equation adjusted for lagged covariates at S3–S7.
Adjusted covariates were marital status, residence, ability to manage income, parity and history of breast-feeding at S4 in model (i), at S4–S8 in model (ii), and at S3–S7 in model (iii) for all NCD outcomes.
* Statistically significant (P < 0·05).
† History of hypertension during pregnancy at S4 in model (i), at S4–S8 in model (ii) and at S3–S7 in model (iii) were included as a covariate in each model.
‡ Model without history of asthma.
§ History of asthma at S4 in model (i), at S4–S8 in model (ii) and at S3–S7 in model (iii) were included as a covariate in each model.
|| History of gestational diabetes mellitus at S4 in model (i), at S4–S8 in model (ii) and at S3–S7 in model (iii) were included as a covariate in each model.
¶ History of depression and/or anxiety at S4 in model (i), at S4–S8 in model (ii) and at S3–S7 in model (iii) were included as a covariate in each model.
For women with the quintile 5 (high DQ) compared with women with quintile 1 (low DQ), 29–33 % lowered odds of HT were observed in time-varying model (OR: 0·71, 95 % CI 0·50, 0·99) and in lagged model (OR: 0·67, 95 % CI 0·49, 0·91). However, no significant association between the AHEI-2010 and HT was observed in the time-invariant model.
When the prospective associations between DQ and asthma were investigated, the reduced odds of asthma were detected amongst those consuming the highest DQ quintile compared with the lowest quintile. In all models where a history of asthma was not adjusted for, lowered odds of asthma was found in time-invariant (OR: 0·77, 95 % CI 0·62, 0·96), time-varying (0·62, 95 % CI 0·51, 0·76) and lagged (0·70, 95 % CI 0·57, 0·85) models. The association was stronger in the time-varying model (model ii). In the model with history of asthma, the association was attenuated and significant in time-varying and lagged models only.
The inverse association between the AHEI-2010 and MM was found only in the time-varying model, that is, 25 % lowered odds of MM in those with the highest quintile of the AHEI-2010 when compared with those with the lowest quintile. Although lagged and time-invariant GEE analysis effects on MM were in the same direction of effect as the time-varying model, the results were not significant.
For the outcomes of CHD, cancer (excluded skin cancer), DM and depression and/or anxiety, there was no association between DQ and these NCDs in time-invariant, time-varying and lagged models (Table 2). However, there were the effects of time on these NCDs, especially in lagged models.
In performing the sensitivity analyses using physical activity, education, occupation and prescribed medicine as covariates, the odds of NCDs and MM remained consistent (online Supplementary Table 6). When GEE analyses were constructed using the AHEI-2010 only, the results were similar to the main results (online Supplementary Table 7). Compared with the primary analyses, longitudinal associations between the AHEI-2010 and NCDs were broadly coherent with the main results in models with effect modification term. However, wider CIs for ORs were observed (online Supplementary Table 8).
Discussion
Within our sample of Australian young women, longitudinal associations between the AHEI-2010 and incident NCDs such as HT, asthma and MM were observed during a 15-year follow-up. However, there was no association between the AHEI-2010 and CHD, cancer, DM, and depression and/or anxiety. Diet as a preventive factor of NCD in women aged 25–45 years was documented for some NCDs, when accounting for the analysis of time-varying covariates. The effects of time were more significant in lagged models.
In the current study, there was no association between the AHEI-2010 and incident CHD during S4–S8. Some components of the AHEI-2010 are beneficial for cardiovascular health, for example, positively weighted PUFA and negatively weighted SSB(Reference Chiuve, Fung and Rimm47). The inverse association between the AHEI-2010 and CHD incidence has been observed in previous studies: in women-only cohorts(Reference Shan, Li and Baden68) and in mixed cohorts(Reference Xu, Steffen and Selvin69–Reference Hu, Steffen and Coresh71). Compared with previous studies, women in this cohort were younger and have lower number of CHD. Another potential reason might be the limitation of the FFQ which could not be measured with high sugar content drinks such as soda drink and the effect estimates could not be accurate.
When examining the impacts of time in our adjusted models, an association between the AHEI-2010 and HT was found in time-varying and lagged models. Our findings are in line with the previous ALSWH study using different DQI(Reference Vissers, Waller and van der Schouw19,Reference Jackson, MacDonald-Wicks and McEvoy24) . In an ALSWH study that used time-varying GEE analysis, reduced odds of HT was found in women who had high DQ (n 5324, aged 50–55 years)(Reference Jackson, MacDonald-Wicks and McEvoy24). In another study using the lagged GEE approach conducted amongst 7169 women aged 50–55 years at baseline, those consumed pro-inflammatory diet had 24 % increased risk of HT compared with those consumed inflammatory diet(Reference Vissers, Waller and van der Schouw19). Although similar statistical analyses were used in these two studies(Reference Vissers, Waller and van der Schouw19,Reference Jackson, MacDonald-Wicks and McEvoy24) , components of DQI emphasised were different: fruits, vegetables, legumes and nuts in the Australian Recommended Food Score and Mediterranean Diet Score(Reference Jackson, MacDonald-Wicks and McEvoy24), and nutrients, spices, whole food and others in the Dietary Inflammatory Index(Reference Vissers, Waller and van der Schouw19). Current evidence suggest that fruits(Reference Gibbs, Gaskin and Ji72), vegetables(Reference Gibbs, Gaskin and Ji72), legumes(Reference Martini, Godos and Marventano73), n-3 fatty acids and PUFA(Reference Colussi, Catena and Novello74) may be helpful for HT by reducing blood pressure. Despite these components in the AHEI-2010, the previous studies showed conflicting findings(Reference Hlaing-Hlaing, Dolja-Gore and Tavener12,Reference Al-Ibrahim and Jackson56,Reference Wu, Huang and Lei75,Reference Neelakantan, Naidoo and Koh76) . These previous studies were different in sample sizes ranging from 124(Reference Wu, Huang and Lei75) to 7169(Reference Vissers, Waller and van der Schouw19), study type such as case–control(Reference Neelakantan, Naidoo and Koh76) and cohort(Reference Hlaing-Hlaing, Dolja-Gore and Tavener12,Reference Vissers, Waller and van der Schouw19,Reference Jackson, MacDonald-Wicks and McEvoy24,Reference Al-Ibrahim and Jackson56,Reference Wu, Huang and Lei75) , statistical analysis such as logistic regression(Reference Hlaing-Hlaing, Dolja-Gore and Tavener12,Reference Wu, Huang and Lei75,Reference Neelakantan, Naidoo and Koh76) , multinominal logistic regression(Reference Al-Ibrahim and Jackson56), time-varying GEE analysis(Reference Jackson, MacDonald-Wicks and McEvoy24) and lagged GEE analysis(Reference Vissers, Waller and van der Schouw19). Applying lagged GEE analysis has added to the evidence of DQ on HT or blood pressure in longitudinal analyses of cohort studies.
In our sample, women with the highest quintile of the AHEI-2010 had reduced odds of asthma by 23–38 % comparing to the lowest quintile. After accounting for history of asthma in the time-varying and lagged GEE analyses, the effect size was reduced. There is still evolving evidence on DQ and asthma in adults, showing inconclusive results(Reference Bédard, Li, Ait-Hadad and Camargo77). The cumulative evidence from observational studies indicated potential healthful effects of fruits, vegetables, and vitamin E(Reference Guilleminault, Williams and Scott78,Reference Leynaert, Le Moual and Neukirch79) , as well as fibre(Reference Andrianasolo, Hercberg and Kesse-Guyot80), and unhealthful effects of red and processed meat(Reference Andrianasolo, Hercberg and Touvier81,Reference Li, Rava, Bédard and Dumas82) and SSB(Reference DeChristopher and Tucker83) on asthma. Reduced odds of asthma symptoms were documented in two French cohort studies(Reference Li, Kesse-Guyot and Dumas84,Reference Andrianasolo, Kesse-Guyot and Adjibade85) . In our repeated cross-sectional study, we found that women in the highest AHEI-2010 quintile had a 25 % reduction in the odds of asthma at 3 years after diet measurement(Reference Hlaing-Hlaing, Dolja-Gore and Tavener27). By contrast, no association between the AHEI-2010 and adult-onset asthma had been reported(Reference Varraso, Chiuve and Fung86,Reference Han, Jerschow and Forno87) . These mixed findings could be partly explained by the application of different measures for asthma(Reference Bédard, Li, Ait-Hadad and Camargo77) such as continuous scoring variable(Reference Li, Kesse-Guyot and Dumas84,Reference Andrianasolo, Kesse-Guyot and Adjibade85) or diagnosis status(Reference Hlaing-Hlaing, Dolja-Gore and Tavener12,Reference Hlaing-Hlaing, Dolja-Gore and Tavener27,Reference Varraso, Chiuve and Fung86) or present asthma condition(Reference Han, Jerschow and Forno87), and for measures of diet such as FFQ(Reference Hlaing-Hlaing, Dolja-Gore and Tavener12,Reference Hlaing-Hlaing, Dolja-Gore and Tavener27,Reference Li, Kesse-Guyot and Dumas84,Reference Varraso, Chiuve and Fung86) or 24-h recalls(Reference Andrianasolo, Kesse-Guyot and Adjibade85,Reference Han, Jerschow and Forno87) . However, the evidence of DQ in adults could be expanded by longitudinal analysis using GEE approach, especially lagged model. In previous studies, various statistical analyses were performed: for example, linear and logistic regressions(Reference Han, Jerschow and Forno87), negative binomial regression(Reference Andrianasolo, Kesse-Guyot and Adjibade85), mediation analysis(Reference Li, Kesse-Guyot and Dumas84), and cox proportional hazard modelling(Reference Varraso, Chiuve and Fung86).
In the current study, there was no evidence of association between the AHEI-2010 and incidence of cancer. The previous analysis that examined the relationship between DQ and cancer of women from the 1946–1951 ALSWH cohort(Reference Hlaing-Hlaing, Dolja-Gore and Tavener12) and the 1973–1978 cohort(Reference Hlaing-Hlaing, Dolja-Gore and Tavener27) also did not find any association. Nevertheless, an inverse association between the AHEI-2010 and incident cancer was documented in the women-only cohort(Reference Chiuve, Fung and Rimm47) and mixed cohort(Reference Lavalette, Adjibade and Srour88). Given that effects of diet on cancer may be dependent on the type of cancer(Reference Chiuve, Fung and Rimm47), the impacts could not be found when overall cancer was considered as the outcome in this study. Further, self-reported data of cancer in the ALSWH 1973–1978 cohort were asked separately for skin and other cancers in later surveys (S5–S8). This might affect measurement of cancer and effect sizes in our adjusted models.
Beneficial effects of diet measured by the AHEI-2010 on DM risk have been reported across the world. The reduced risks of DM among participants with higher AHEI-2010 score compared with lower score were found in some studies: those conducted only in women(Reference Hlaing-Hlaing, Dolja-Gore and Tavener12,Reference Chiuve, Fung and Rimm47,Reference Cespedes, Hu and Tinker89) and in both sexes(Reference Jacobs, Harmon and Boushey90–Reference Chen, Koh and Neelakantan92). In contrast to these previous findings, no association was observed in this 1973–1978 ALSWH cohort(Reference Hlaing-Hlaing, Dolja-Gore and Tavener27), and the recent analysis performed in the Atherosclerosis Risk in Communities (ARIC) study participants(Reference Xu, Steffen and Selvin69). Collective evidences showed the increased DM risk was related with high intakes of SSB(Reference Malik and Hu93), red and processed meat(Reference Papier, Fensom and Knuppel94), trans-fat(Reference Wang, Imamura and Ma95), yet no strong evidence of the protective consequence of PUFA and long-chain n-3 fatty acids intakes on DM(Reference Brown, Brainard and Song96). A possible explanation of the null finding in this cohort could partly be the low intakes of Australians’ trans-fat intake which is made up of only 0·6 % of total daily energy(Reference Wu, Downs and Catterall97). This low intake might not be captured in the scoring of the AHEI-2010, thereby affecting the discriminating power to detect different levels of trans-fat in our sample.
DP loaded with vegetables, fruits and wholegrains have been recognised as preventive factors to depression(Reference Rahe, Unrath and Berger98). Vitamins and other micronutrients present in vegetables and fruits have supportive effects on the nervous system(Reference Li, Lv and Wei99). Additionally, diet high in n-3 PUFA can reduce pro-inflammatory cytokines(Reference Kiecolt-Glaser100). Regarding red and processed meat and SSB, their possible harmful impacts on depression have been suggested in previous studies(Reference Hu, Cheng and Jiang101,Reference Nucci, Fatigoni and Amerio102) . The scoring of the AHEI-2010 reflects high intakes of favourable diet and low intakes of unfavourable diet(Reference Chiuve, Fung and Rimm47). However, inconsistent findings with regard to the association between the AHEI-2010 and depressive symptoms and/or anxiety were reported: no association(Reference Hlaing-Hlaing, Dolja-Gore and Tavener12,Reference Hlaing-Hlaing, Dolja-Gore and Tavener27,Reference Adjibade, Lemogne and Julia103) and inverse association(Reference Sánchez-Villegas, Henríquez-Sánchez and Ruiz-Canela104,Reference Saneei, Hajishafiee and Keshteli105) . In an ALSWH study that used GEE lagged analysis for exploring the effects of diet on depression, women who consumed anti-inflammatory diet had lower odds of depression(Reference Shivappa, Schoenaker and Hebert20). Comparisons between studies were not directly made because of differences in measurements of diet and statistical analyses. However, longitudinal analysis with time-lagged GEE approach in a cohort study may be useful in nutritional epidemiology.
To date, evidence concerning dietary factors and NCD MM is still evolving(Reference Hlaing-Hlaing, Dolja-Gore and Tavener12,Reference Shi, Ruel and Dal Grande106–Reference Kyprianidou, Panagiotakos and Faka113) . Previously, a few cross-sectional(Reference Jeong, Kim and Lee107,Reference Pereira, Bortolotto and Tomasi108) and prospective(Reference Ruel, Shi and Zhen109–Reference Dekker, de Borst and Meems111) studies demonstrated the reduced odds of NCD MM among those consumed high vegetable and fruits compared with those consumed low intakes. In addition, an analysis of data obtained from 36 663 Australians aged ≥ 16 years indicated that soft drink consumption increased the risk of MM(Reference Shi, Ruel and Dal Grande106). There were a few studies that investigated the link between DQ and MM(Reference Hlaing-Hlaing, Dolja-Gore and Tavener12,Reference Freisling, Viallon and Lennon112,Reference Kyprianidou, Panagiotakos and Faka113) . Preventive potential of diet and MM were demonstrated amongst European adults with high in the modified Mediterranean Diet Score(Reference Freisling, Viallon and Lennon112,Reference Kyprianidou, Panagiotakos and Faka113) and Australian women high in the Healthy Eating Index for Australian Adults-2013 and AHEI-2010(Reference Hlaing-Hlaing, Dolja-Gore and Tavener12). In the present study, longitudinal association between the AHEI-2010 and NCD MM was documented only in the time-varying GEE approach. It may be the effects of time-varying covariates on the occurrence of NCD MM. In finding the effects of diet on NCD MM, longitudinal analysis with time-varying covariates may be useful.
It has been acknowledged that evidence from other research design with appropriate statistical analysis can be used for measuring causal effects in instances where randomised controlled trials are unfeasible(Reference West, Duan and Pequegnat114). Nutritional epidemiological studies assessing diet–health outcome relationships are no exception, and well-conducted prospective cohort studies with long follow-up periods could be alternatives(Reference Satija, Yu and Willett115,Reference Allman-Farinelli, Byron and Collins116) . Although it is challenging to obtain an unbiased estimate from longitudinal studies, appropriate adjustment of time-varying covariates in statistical analysis is an option(Reference Clare, Dobbins and Mattick117). In exploring the longitudinal relationship between exposure and outcome, GEE analysis with time-invariant and lagged covariates were used in other epidemiological settings such as in sport medicine(Reference Twisk118), occupational health(Reference Hoogendoorn, Bongers and De Vet119) and elderly health(Reference Lin, Chen and JWR120). These previous studies observed that the estimates obtained from lagged GEE analysis that accounted for effects of exposure, covariates and outcome over time were more precise than time-invariant models(Reference Hoogendoorn, Bongers and De Vet119,Reference Lin, Chen and JWR120) . Although we did not find longitudinal association between DQ and some NCDs such as CHD, cancer, DM, and depression and/or anxiety, the findings from longitudinal time-lagged modelling showed that there were effects of time on these outcomes.
A major strength in the application of the GEE estimate is that it has intuitive population-averaged interpretation compared with those of linear regression and allows for the adjustment of time-invariant, time-varying and lagged models in predicting NCD outcomes. In previous ALSWH studies assessing diet–NCD relationships, modellings with GEE approach were used(Reference Vissers, Waller and van der Schouw19,Reference Shivappa, Schoenaker and Hebert20,Reference Jackson, MacDonald-Wicks and McEvoy24) . One study used GEE time-varying analysis for CVD and HT(Reference Jackson, MacDonald-Wicks and McEvoy24), and two studies used GEE lagged analyses for HT and depression(Reference Vissers, Waller and van der Schouw19,Reference Shivappa, Schoenaker and Hebert20) . To date, there was no study using different GEE analyses in investigating the relationship between diet and NCD extensively. The findings of the longitudinal relationship between the AHEI-2010 and some NCDs in the 1973–1978 cohort aged 25–45 years, using different GEE analysis, add to the body of evidence related with DQ. Further, it was beneficial that selecting a sample from the data obtained through a nationally representative population of childbearing age women(Reference Powers and Loxton121), who were free of NCDs before the start of the study. Longitudinal analysis allowing for adjustment of the minimal set of time-varying covariates provides another strength for the current study and the recommended use of GEE for analysing this complex survey data.
There are some study limitations worth noting. Compared with the original sampled population at S1 (n 14 247), those excluded from the study due to their NCD status and missing FFQ data (n 1059) had low socio-economic and health profile. For example, excluded women had no formal education, no paid job, financial hardship and less physically active (online Supplementary Table 5). Therefore, there may be skewed results towards more healthy participants. Additionally, they were less likely to be represented in higher DQ quintiles such as quintiles 4 and 5 (data not shown). This distribution could affect the investigation of DQ variations between different groups, making it challenging to identify slight variations which might be biased towards the null. Like other measures of dietary assessment, the self-reported FFQ are subject to measurement error(122). Since the DQES-v2 included food available in the late 1980s(123), it is likely to lack representative food consumption in the 2000s, particularly in terms of foods rich in trans-fat, packaged food, SSB, etc. Hence, there is the possibility of under-reporting in this study. However, Blumfield et al. (2011) have previously shown very similar daily mean energy intakes from the DQES-v2 compared with intakes reported by women aged 25–44 years in the Australian 1995 National Nutrition Survey(Reference Blumfield, Hure and MacDonald-Wicks124). Regarding data presentation and analysis in our study, we classified the AHEI-2010 into quintiles which could lead to loss of information and inaccurate effect size(Reference Bennette and Vickers125). Nevertheless, most nutritional epidemiological studies have been applied categorical data(Reference Willett65). Diet data were not available for every survey; therefore, measurement of DQ at S3 was used for S4, and measurement of DQ at S5 was used for S6, S7 and S8. However, variables adjusted for in the multivariable analyses were time-varying in model (ii) and model (iii). The outcome assessments were completely relied on self-reported diagnosis of NCD; however, it was shown that self-reported NCD data in the ALSWH participants were acceptable to use(Reference Cristina, Williams and Parkinson49,Reference Stavrou, Vajdic and Loxton50) . The modest number of cases in CHD and DM might lead to wide CIs of our effect sizes. Number of participants with incident cancer might not be accurate, since there was no available separate self-reported data for skin cancer and other cancers in S1–S4. However, when percentages of skin cancer cases in other cancer cases during later surveys were examined, there were not more than 5 % (data not shown). Even though a minimal set of covariates were used in adjustments, possibility of residual confounding cannot be ruled out.
Conclusion
In the longitudinal analysis of diet as a preventive factor of NCD, high DQ measured by the AHEI-2010 was associated with incidence of HT, asthma and MM. A temporal association between diet and some NCDs was evident in lagged GEE analyses. However, the longitudinal analysis of diet and NCDs using GEE analyses is limited. Additionally, direct evidence of the relationship between diet and NCD in the age group of 25 to 45 years is evolving. Further epidemiological analyses performed in young cohorts with updated dietary data focusing on longitudinal analysis with time-varying and lagged covariates are needed to better understand diet–NCD relationships.
Acknowledgements
H. H-H. would like to thank for supporting a University of Newcastle PhD scholarship. The research on which this paper is based was conducted as part of the Australian Longitudinal Study on Women’s Health by the University of Queensland and the University of Newcastle. The authors are grateful to the Australian Government Department of Health for funding and to the women who provided the survey data. The authors thank Professor Graham Giles of the Cancer Epidemiology Centre of Cancer Council Victoria, for permission to use the Dietary Questionnaire for Epidemiological Studies (version 2), Melbourne: Cancer Council Victoria, 1996. Grateful acknowledgements are extended to Professor Gita Mishra (ALSWH Liaison) and Professor Allison Hodge (DQES Representative).
This research received no external funding.
Conceptualisation: H. H-H., A. J. H., X. D-G. and M. T.; methodology: H. H-H., A. J. H., X. D-G. and M. T.; formal analysis: H. H-H., X. D-G. and A. J. H.; writing – original draft preparation: H. H-H.; and writing – review and editing: H. H-H., A. J. H., X. D-G. and M. T. All authors contributed to and reviewed the final version of the manuscript.
The authors declare that there is no conflict of interest.
Supplementary material
For supplementary material/s referred to in this article, please visit https://doi.org/10.1017/S0007114523001605


 Open access