The nutrient intake of free-living persons varies in both amount and type from day to day, from season to season and from year to year(Reference Rutishauser1). A chronic effect of nutrients is often desirable to explore the aetiology of diseases in nutritional epidemiology, especially chronic diseases(Reference Freedman, Schatzkin and Midthune2, Reference Zelber-Sagi, Nitzan-Kaluski and Goldsmith3). Therefore, assessment of an individual's long-term intake is important to examine the relationship between habitual diet and disease or to explore extended nutritional status for an individual or group(Reference Freedman, Midthune and Carroll4).
The 24 h recall (24HR), dietary record (DR) and FFQ are useful tools to assess an individual's or group's diet. Because nutrient intake assessed by the 24HR and DR fluctuates from day to day among individuals, the 24HR and DR are often limited to estimate the usual dietary intake of individuals or groups(Reference Beaton, Milner and Corey5). This within-individual variation leads to statistical imprecision and inaccuracy of estimates(Reference Basiotis, Welsh and Cronin6–Reference Willett8). However, 24HR and DR methods are designed to have relatively high precision and validity partly because of open-ended responses, including detailed information on types of foods, ingredients, cooking methods and brand names(Reference Resnicow, Odom and Wang9). Because the Korean diet is uniquely characterised by mixed or shared dishes, a combination of various small dishes and frequent dining out, an in-depth assessment of Korean dishes is often required. Therefore, the 24HR and DR are frequently utilised as practical dietary instruments.
To determine long-term intakes with high precision using the 24HR or DR, averaging multiple daily collections from 24HR or DR has been attempted to reduce within-individual variations and to cost-effectively estimate the minimum number of days. The number of days needed to assess nutrient intake is usually estimated from the ratio of within-individual variation to between-individual variation(Reference Black, Cole and Wiles10). The smaller the ratio, the fewer days are needed to achieve acceptable precision, represented by the correlation coefficients between unobservable true intake and observed intake(Reference Lanigan, Wells and Lawson11).
Sources of within-individual variation include the day of the week, seasonality, the sequence of observation and the method of data collection(Reference Tarasuk and Beaton12). A number of studies have investigated the requisite number of days to achieve desired accuracy when estimating usual intake(Reference Basiotis, Welsh and Cronin6, Reference Lanigan, Wells and Lawson11, Reference Bellu, Ortisi and Riva13–Reference Nelson, Black and Morris17) and sources of within-person variation(Reference Beaton, Milner and Corey5, Reference Erkkola, Kyttala and Takkinen14, Reference Cai, Yang and Xiang18–Reference Tokudome, Imaeda and Nagaya20). However, only limited Korean data exist on the sources of within-person variation(Reference Kwon, Ahn and Shim21, Reference Oh and Hong22) and the required number of days of open-ended dietary instruments, although the 24HR and DR are commonly used in Korea.
In the present study, we aimed to examine the major sources of variations in energy and fifteen nutrients among 414 Korean men and women and estimated the minimum replicates of DR using the within- and between-individual variations obtained from four sets of seasonal 3 d DR. Because previous studies, including studies of Chinese(Reference Cai, Yang and Xiang18, Reference Cai, Shu and Hebert23) and Western populations(Reference Nelson, Black and Morris17, Reference Jackson, Byrne and Magarey24), have shown differences in the magnitudes of the within-individual variations by sex and age, we examined these variations and the required number of days for men and women or for 20–45-year-old group and 46–65-year-old group.
Methods
Study participants
Healthy Korean adults over 20 years of age from Seoul (the capital of the Republic of Korea) and Gyeonggi province (adjacent province to Seoul) were recruited through advertising flyers and website advertisements in 2009 and 2010, respectively, as part of two validation studies of FFQ developed by the Korean National Cancer Center(Reference Park, Noh and Song25) or the Korea Centers for Disease Control and Prevention. The same protocols developed by our group were implemented to administer 12 d DR for these two validation studies. A total of 341 and 140 eligible participants were initially recruited and 288 and 126 participants completed 12 d DR in 2009 and 2010, respectively. Energy and fifteen nutrients (protein, fat, carbohydrate, Ca, P, Fe, Na, K, vitamin A, thiamin, riboflavin, niacin, vitamin C, retinol and carotene) from the 12 d DR of 414 Korean adults were analysed. The present study was conducted according to the guidelines laid down in the Declaration of Helsinki, and all procedures involving human subjects/patients were approved by the institutional review board of the Seoul National University. Written informed consent was obtained from all subjects.
Dietary records
The DR were collected for four 3 d periods throughout the year following the administration of the first DR to account for seasonal variation in consumption. The participants were asked to record every food item they had consumed on three non-consecutive days, including two weekdays and one weekend day. Detailed guidelines, including visual two-dimensional household measures, were distributed to the participants to complete the DR. To improve the quality of the DR, the records were reviewed by a nutritionist, and missing values or vague answers were followed up by telephone interview. The nutrient database from the Korean Rural Development Administration consisting of 3019 food items(26) and a standard recipe database consisting of 3048 dishes(27) were used to calculate each individual's nutrient intake. The intakes of energy and the fifteen nutrients for the participants were analysed using the nutrient analysis software WebDS24 (Human Nutrition Lab, Seoul National University, Seoul, Republic of Korea, 2005), developed at Seoul National University.
Statistical analysis
We calculated means, standard deviations, seven percentiles (5th, 10th, 25th, 50th, 75th, 90th and 95th), skewness and kurtosis of each nutrient intake. Variation sources were estimated using the Proc Mixed procedure in the SAS statistical software package version 9.2 (SAS Institute, 2008). The sources of variation examined in the present study were between-individual (variation between the intake of individuals), weekday or weekend (day of the week), recording sequence, season of the year (seasonality) and within-individual (variation in the day-to-day intake of one individual). The log (natural)-transformed data to increase normality were analysed using a random-effects model(Reference Robinson28). The formula log(x+0·01) was used for zero intakes in the data. To evaluate the effects of seasonality, we divided the data into four seasons. The season of the year was defined as spring (from March to May), summer (from June to August), autumn (from September to November) or winter (from December to February). This analysis was conducted separately for men and women and for two age groups (20–45 years and 46–65 years).
The following formula by Black et al. (Reference Black, Cole and Wiles10) was used to calculate the number of days needed to estimate each participant's usual intake:
where D is the number of DR required, r is the hypothetical correlation between the observed and true average nutrient intakes of a participant and ![]() $$S _{w}^{2} $$ and
$$S _{w}^{2} $$ and ![]() $$S _{b}^{2} $$ are the within- and between-individual variations, respectively. To determine the level of accuracy obtained in the present study with 3 d of seasonal DR, the following formula, derived from formula (1), was used:
$$S _{b}^{2} $$ are the within- and between-individual variations, respectively. To determine the level of accuracy obtained in the present study with 3 d of seasonal DR, the following formula, derived from formula (1), was used:
where D is the number of DR recorded, the correlation coefficient is r and ![]() $$S _{w}^{2} $$ and
$$S _{w}^{2} $$ and ![]() $$S _{b}^{2} $$ are as defined previously. The correlation coefficient r is a measure of confidence when classifying the participants into tertiles, quartiles, quintiles, etc(Reference Nelson, Black and Morris17). At an r value of 0·8, 72 % of the individuals are correctly classified into their tertile, and 3·3 % are grossly misclassified. If the r value is equal to 0·9, then 1 % of the participants are misclassified into the extreme tertile, and 80 % of the participants are classified into the correct tertile(Reference Black, Cole and Wiles10, Reference Nelson, Black and Morris17). To examine the degree of precision across the number of days of DR, we calculated the r value using formula (2) by plugging values from 2 to 12 into D.
$$S _{b}^{2} $$ are as defined previously. The correlation coefficient r is a measure of confidence when classifying the participants into tertiles, quartiles, quintiles, etc(Reference Nelson, Black and Morris17). At an r value of 0·8, 72 % of the individuals are correctly classified into their tertile, and 3·3 % are grossly misclassified. If the r value is equal to 0·9, then 1 % of the participants are misclassified into the extreme tertile, and 80 % of the participants are classified into the correct tertile(Reference Black, Cole and Wiles10, Reference Nelson, Black and Morris17). To examine the degree of precision across the number of days of DR, we calculated the r value using formula (2) by plugging values from 2 to 12 into D.
Also, we estimated the usual intake of energy and the fifteen nutrients using the multiple source method with randomly selected 2 d DR. A Web-based program (version 1.0.1, 2012; available from http://msm.dife.de/, German Institute of Human Nutrition) was used to estimate the usual intake distribution.
Results
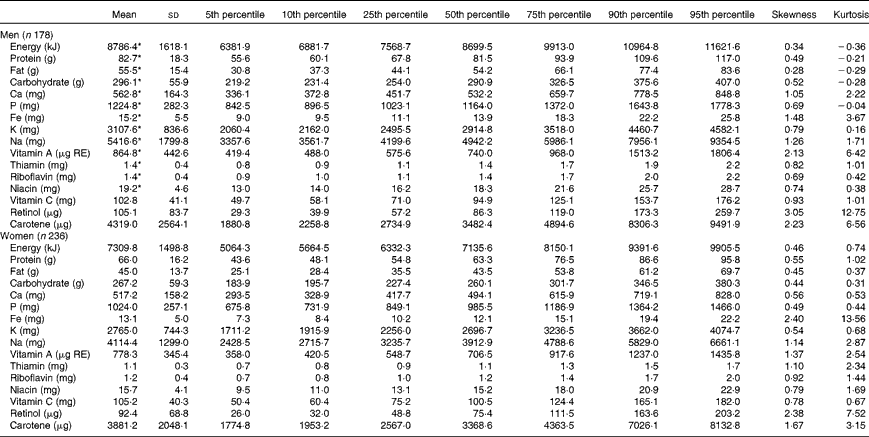
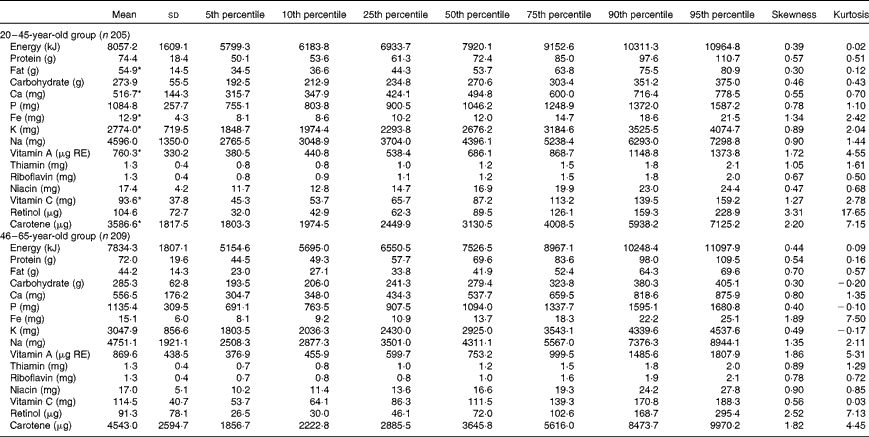
The mean age of the participants was 43·2 (sd 11·7) and 44·8 (sd 9·7) years for men and women, respectively. The difference was not statistically significant (P= 0·13). The Mean values of age were 35·0 (sd 5·9) years for the 20–45-year-old group and 53·1 (sd 5·3) years for the 46–65-year-old group. Tables 1 and 2 show the distribution of energy and fifteen nutrient intakes obtained from the 12 d DR according to sex and age group, respectively. The mean intakes of vitamin C, retinol and carotene did not differ significantly between men and women, but the intakes of all the other nutrients, including energy, were significantly higher among men than among women (Table 1). The mean intakes of Ca, Fe, K, vitamin A, vitamin C and carotene were lower among the 20–45-year-old group than among the 46–65-year-old group; only fat intake was significantly higher among the 20–45-year-old group than among the 46–65-year-old group (Table 2). The 46–65-year-old group had a wider variation than the 20–45-year-old group for almost all the nutrients, with the exception of fat intake.
Table 1 Distribution of nutrient intakes by sex assessed by seasonal 3 d dietary records among adults aged 20–65 years in the Seoul metropolitan area of Korea (Mean values, standard deviations and percentiles)

RE, retinol equivalents.
* Mean values were significantly different from women (P< 0·05).
Table 2 Distribution of nutrient intakes by age group assessed by seasonal 3 d dietary records among adults aged 20–65 years in the Seoul metropolitan area of Korea (Mean values, standard deviations and percentiles)

RE, retinol equivalents.
* Mean values were significantly different from the 46–65-year-old group (P< 0·05).
Variance components for energy and nutrients by sex and age group
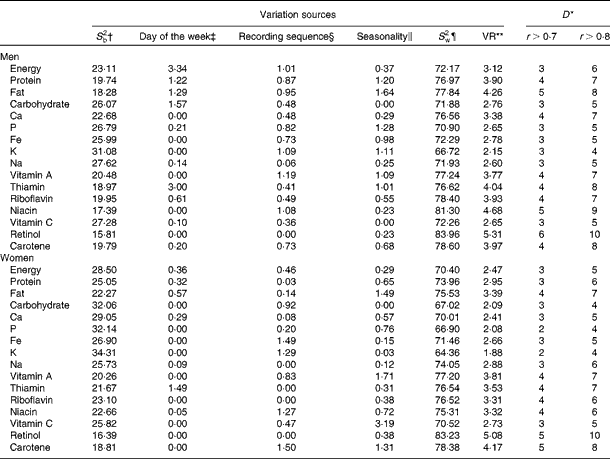
Variations in the day of the week, recording sequence and seasonality accounted for less than 3·4 % of the total variation for both men and women (Table 3), demonstrating that these variations are not the major source of variations in dietary intake among Korean men and women. Although the variation was relatively small, the contribution of variation by the day of the week was higher in energy, three macronutrients and thiamin for men than for women. On average, the contribution by the day of the week was 0·73 % for men and 0·20 % for women. Variations in seasonality and recording sequence contributed < 2 % of the total variation for most of the nutrients for men and women, with the exception of the seasonal variation of vitamin C intake among women (3·19 %).
Table 3 Variation sources (%) and the number of days required to estimate usual intake for the selected nutrients by sex among adults aged 20–65 years in the Seoul metropolitan area of Korea

VR, variance ratio.
* Estimation of nutrient intake is determined from the correlation between the observed and true average intakes of individuals in which the unobservable correlation coefficient is given by ![]() $$r = \left ( D /( D + S _{w}^{2}/ S _{b}^{2})\right )^{1/2} $$, where D is the number of dietary records.
$$r = \left ( D /( D + S _{w}^{2}/ S _{b}^{2})\right )^{1/2} $$, where D is the number of dietary records.
† Percentage of variance attributable to subjects (i.e. between-individual).
‡ Percentage of variance attributable to the specific day of the week.
§ Percentage of variance attributable to the order of recording.
∥ Percentage of variance attributable to the specific season of the year.
¶ Percentage of variance attributable to within-individual sources.
** Ratio of within-individual:between-individual variance (![]() $$S _{w}^{2}/ S _{b}^{2} $$).
$$S _{w}^{2}/ S _{b}^{2} $$).
The within- and between-individual variation ratios (VR) ranged from 2·15 (K) to 5·31 (retinol) for men and from 1·88 (K) to 5·08 (retinol) for women. For macronutrients, the highest VR was observed for fat intake and the lowest VR was observed for carbohydrate intake for men and women.
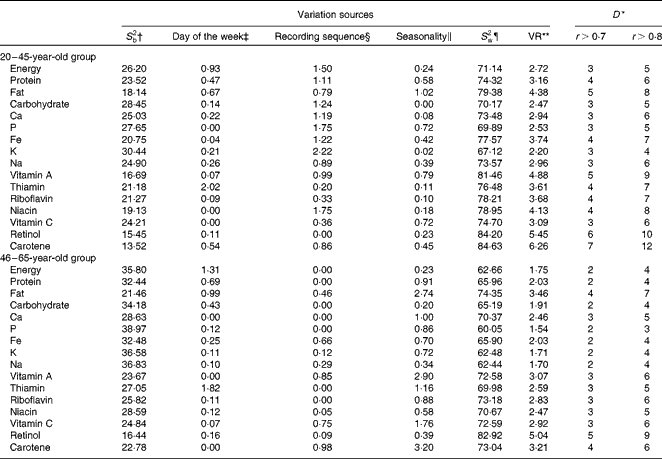
Table 4 shows the variation sources and VR for energy and the fifteen nutrients by age group. We found < 2 % contribution of variation by seasonality, recording sequence and the day of the week for most of the nutrients across both age groups. The contributions of sequence variation in the 46–65-year-old group were zero for energy, protein, carbohydrate, Ca, P, thiamin and riboflavin. A higher contribution of sequence variation was observed among the 20–45-year-old group than among the 46–65-year-old group for all but three nutrients (vitamin C, retinol and carotene). In the 20–45-year-old group, the VR ranged from 2·20 (K) to 5·45 (retinol). The VR for the 46–65-year-old group ranged from 1·54 (P) to 5·04 (retinol). All nutrients and energy showed higher VR in the 20–45-year-old group than in the 46–65-year-old group. Because the 46–65-year-old group comprised a larger proportion of women than the 20–45-year-old group, we also examined the sources of variation, the VR and the number of days by age group for men and women (see Tables S1 and S2, available online). We found that the VR of the 20–45-year-old men and women were greater than those of the 46–65-year-old men and women. This finding was similar to the results of the analysis that combined men and women.
Table 4 Variation sources (%) and the number of days required to estimate usual intake for the selected nutrients by age group among adults aged 20–65 years in the Seoul metropolitan area of Korea

VR, variance ratio.
* Estimation of nutrient intake is determined from the correlation between the observed and true average intakes of individuals in which the unobservable correlation coefficient is given by ![]() $$r = \left ( D /( D + S _{w}^{2}/ S _{b}^{2})\right )^{1/2} $$, where D is the number of dietary records.
$$r = \left ( D /( D + S _{w}^{2}/ S _{b}^{2})\right )^{1/2} $$, where D is the number of dietary records.
† Percentage of variance attributable to subjects (i.e. between-individual).
‡ Percentage of variance attributable to the specific day of the week.
§ Percentage of variance attributable to the order of recording.
∥ Percentage of variance attributable to the specific season of the year.
¶ Percentage of variance attributable to within-individual sources.
** Ratio of within-individual:between-individual variance (![]() $$S _{w}^{2} $$/
$$S _{w}^{2} $$/![]() $$S _{b}^{2} $$).
$$S _{b}^{2} $$).
Number of days of dietary records required to estimate usual intake by sex and age group
Overall, 2–6 d of DR were required to achieve r>0·7 for both men and women, and 6–7 d of DR were adequate to achieve r>0·8 for most of the nutrients, with a few exceptions, such as fat, thiamin and niacin for men and retinol and carotene for both men and women (Table 3). To achieve high precision (r>0·8), the same number of days was required for intakes of Fe, K, vitamin A, vitamin C, retinol and carotene for men and women, whereas fewer days were required for men than for women for Na intake. For energy and the rest of the nutrients (eight nutrients), an additional 1–3 d were needed to assess the usual intake for men compared with that for women. To obtain modest precision (r>0·7), four or less days of DR were required to estimate the usual intakes of energy and thirteen nutrients (except retinol and carotene) for women and the usual intakes of energy and twelve nutrients (except fat, niacin and retinol) for men. However, five or more days of DR were necessary to achieve modest precision (r>0·7) for fat, niacin and retinol for men and retinol and carotene for women.
Of the two age groups, the required number of days ranged from 3 to 12 d to achieve high precision (r>0·8). Meanwhile, 6–7 d of DR were sufficient for most of the nutrients to reach high precision (r>0·8) for both age groups, but more than 7 d were required for fat, vitamin A, niacin and carotene for the 20–45-year-old group and for retinol for both age groups (Table 4). In general, an additional 1–3 d were required to obtain higher precision (r>0·8) for the 20–45-year-old group than for the 46–65-year-old group. To achieve moderate precision (r>0·7), 2–7 d of DR were required to estimate the usual nutrient intake for both age groups: three or fewer days of DR for energy and twelve nutrients (except fat, retinol and carotene) in the 46–65-year-old group and four or fewer days of DR for energy and eleven nutrients (except fat, vitamin A, retinol and carotene) in the 20–45-year-old group.
We estimated the usual intake of energy and the fifteen nutrients using the multiple source method with randomly selected 2 d DR, which was the minimum number of days to control within-individual variation. The multiple source method-adjusted 2 d DR showed a more similar distribution to the 12 d DR than to the unadjusted 2 d DR. However, the group mean values and correlations with the 12 d DR were not apparently changed after the multiple source method was applied (data not shown).
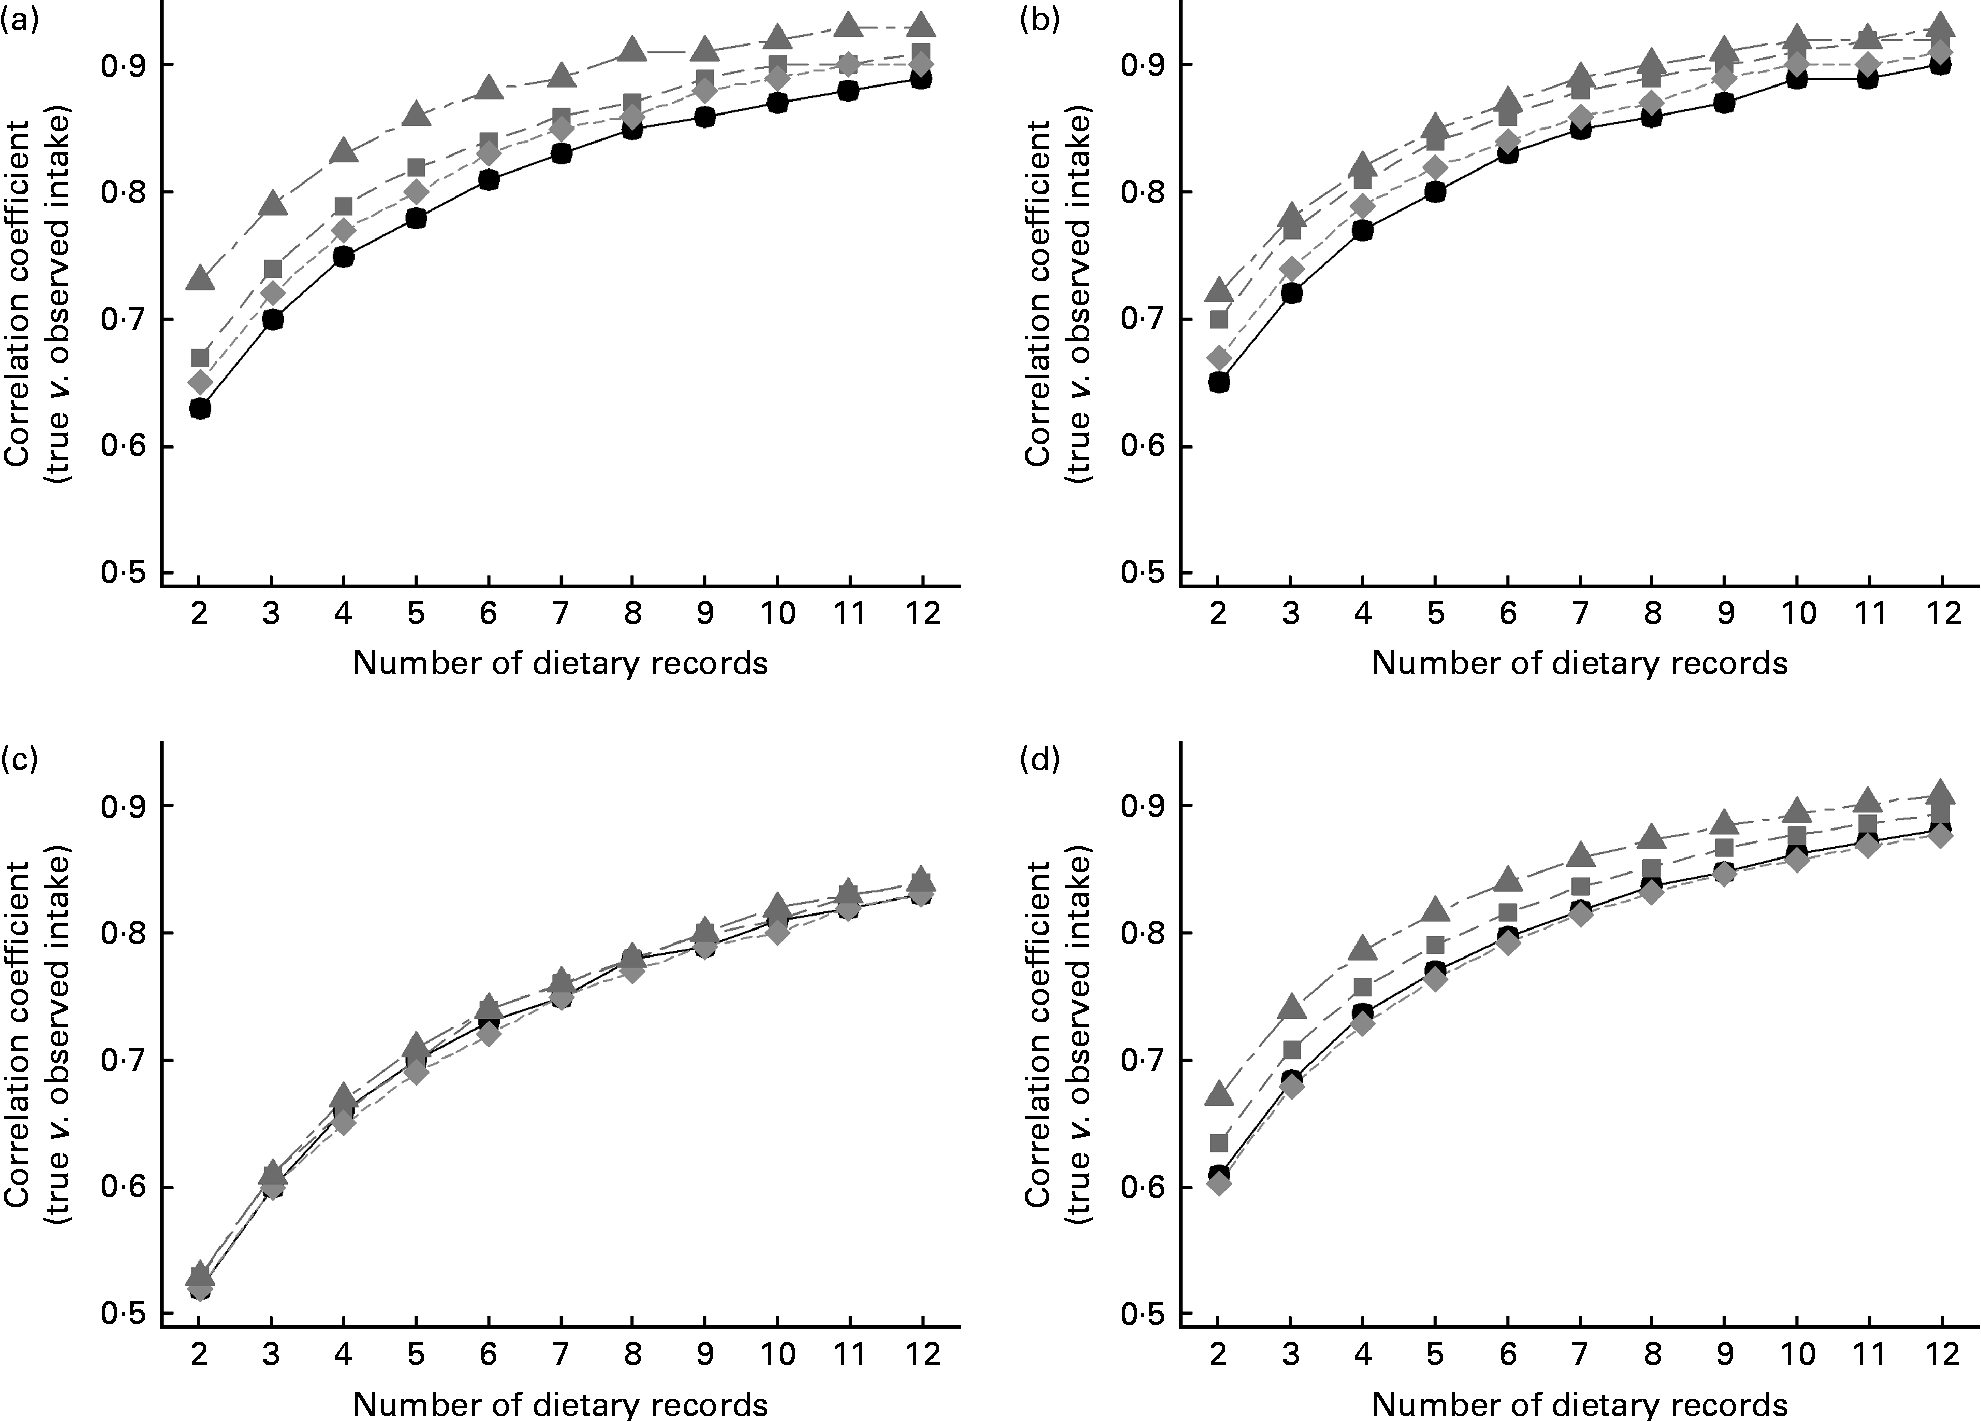
We examined the degree of increase in correlation coefficients (r) with increasing DR. Fig. 1(a)–(d) shows an accretion of r for energy, carbohydrate, retinol and mean of energy and the fifteen nutrients, respectively, from 2 to 12 d of DR by sex and age group. Carbohydrate and retinol were selected because their VR were the lowest and the highest, respectively (see Tables S3 and S4, available online). Although the precision (r) increased with an increasing number of days of DR, the degree of increase was attenuated with additional days: r increased by 13·0–26·9 % from 2 to 4 d, 6·5–16·4 % from 4 to 7 d and 4·0–11·6 % from 7 to 12 d for energy and the fifteen nutrients. The precision of K, P and carbohydrate increased relatively less gradually, ranging from 25·2 % (P for the old age group) to 39·1 % (carbohydrate for the male group) for 2–12 d of DR compared with the other nutrients. In contrast, the precision of retinol, carotene and fat increased by 43·4 % (carotene for the 46–65-year-old group) to 60·1 % (retinol for the 20–45-year-old group) for 2–12 d of DR.

Fig. 1 Relationship between the number of days of dietary records and correlation coefficients for (a) energy, (b) carbohydrate, (c) retinol and (d) mean of energy and the fifteen nutrients by age group and sex in the Seoul metropolitan area of Korea (n 414: 178 men (![]() ), 236 women (
), 236 women (![]() ); 205 adults aged 20–45 years (
); 205 adults aged 20–45 years (![]() ) and 209 adults aged 46–65 years (
) and 209 adults aged 46–65 years (![]() )).
)).
Discussion
In the present study of nutrient variations in Korea, we found that the day of the week, recording sequence and seasonality explained the variation in nutrient intakes to a small degree for all sex and age groups of 414 Korean adults who completed four 3 d DR over 1 year. When we compared the contributions between men and women and between 20–45-year-old and 46–65-year-old groups, the contributions of sequence variation for most of the nutrients to the total variation were higher among the 20–45-year-old group than among the 46–65-year-old group, and the contributions of the day of the week for energy, three macronutrients and thiamin were slightly higher among men than among women. Men and the 20–45-year-old group had a lower between-individual variation and a higher within-individual variation in energy and nutrient intakes than did women and the 46–65-year-old group, respectively. In general, 3–4 d of DR for modest precision (r>0·7) and 6–7 d of DR for high precision (r>0·8) were required to reflect the individuals' usual nutrient intakes.
A previous Korean study has examined sources of variation in nutrient intake approximately 10 years apart(Reference Kwon, Ahn and Shim21). Similar to the present study design, that study collected four sets of seasonal 3 d DR for Korean adults, but the sample size was relatively small (n 129) and the study participants were older (40–65 years) than the present study participants. In that study, the contributions of the day of the week and seasonality were minimal ( < 6 %), in agreement with the present study, but the effect of the day of the week on nutrient variation was smaller among men (0·00–0·54) than among women (0·00–1·35). The slightly lower contribution of seasonality to variation in the present study compared with the previous Korean study(Reference Kwon, Ahn and Shim21) may be explained by the decreased effects of seasonality on food supply and increased fruit consumption relative to the past. Sources of variation in nutrient intakes have been assessed in other ethnic groups. Day, seasonality and sequence had little contributions to the variation in nutrient intakes in a Chinese study in which 24 d of 24HR were collected from 200 healthy women between 40 and 70 years old who participated in the Shanghai Women Health Study(Reference Cai, Shu and Hebert23). Other studies of US adults, Chinese men, US and Russian children and Indian adults have found that the within- and between-individual variations were the major components of variation, while other components (day of the week, seasonality, interviewer and region) had little effect on the total variation(Reference Cai, Yang and Xiang18, Reference Jahns, Carriquiry and Arab19, Reference Beaton, Milner and McGuire29, Reference Hebert, Gupta and Mehta30).
We found that the variation in recording sequence contributed only slightly, with a minimum contribution among the 46–65-year-old group (maximum 0·98 % for carotene), suggesting no or low training effects of consecutive 12 d DR. This finding was similar to the findings of a study conducted with seventy-three adults in a US metropolitan area in 2011 using multiple 24HR. That study reported that sequence and interviewer variations represented less than 2 % of the total variation in men and women(Reference Stote, Radecki and Moshfegh31).
Another two Korean studies have examined within- and between-individual variations and their ratios among adults aged 40–65 years(Reference Kwon, Ahn and Shim21) in 2004 and over 60 years(Reference Oh and Hong22) in 1999. Overall, the VR for the 46–65-year-old group in the present study were lower than the VR of adults aged over 60 years(Reference Oh and Hong22), but were similar to the VR of adults aged 40–65 years(Reference Kwon, Ahn and Shim21). In a study of Korean older adults(Reference Oh and Hong22) that collected 5–6 d of 24HR from forty-seven men and thirty-six women over 60 years old, the VR ranged from 2·26 (vitamin A) to 12·52 (vitamin C) for men and from 1·73 (P) to 5·86 (vitamin A) for women. These VR were higher overall than those in the present study. This may be partly due to differences in the population age and dietary assessment tools. Another Korean study(Reference Kwon, Ahn and Shim21) of middle- to old-aged adults who completed 12 d DR has shown that the VR ranged from 2·2 (P) to 3·9 (niacin) for men and from 1·7 (riboflavin) to 2·9 (total fat) for women. The VR in that study were comparable with our findings. Consistent with previous studies, we found that the within-individual variation was generally higher and the between-individual variation was lower for men than for women for most of the nutrients. However, the VR for some nutrients, including Na, vitamin C, vitamin A and carotene, were higher among women than among men in the present study, suggesting the possibility that women consumed a wider variety of vitamin-containing foods, especially fruits and vegetables, than men.
Studies that have examined VR in other ethnicities have found that the VR were generally larger than 1 and that the VR of micronutrients were larger than those of macronutrients. For macronutrients, carbohydrates had the smallest VR and fat had the largest VR among Chinese and Japanese men(Reference Cai, Yang and Xiang18, Reference Ogawa, Tsubono and Nishino32). For micronutrients, minerals had relatively smaller VR than vitamins among Chinese men, which is consistent with the present results. Similar to the present study, Cai et al.'s(Reference Cai, Shu and Hebert23) Shanghai Women Health Study has reported that the VR of older age groups were generally smaller than the VR of younger age groups, with the exception of three nutrients (fat, Cu and Na). They concluded that the older age group's lower number of food entries in 24HR produced the smaller VR than in younger age groups. In the present study, the number of food entries did not differ between the age groups (average of 12 d = thirty-four food entries). We speculate that the larger VR in the 20–45-year-old group than in the 46–65-year-old group may be partly explained by frequent dining out and heterogeneity in types of foods, which may contribute to within-individual variations.
Although the correlation coefficients between the observed intake of each number of DR and the true intake increased with an increased number of days of DR, improvements in precision gradually decreased with additional DR. In general, to achieve high precision (r>0·8), 6–7 d of DR are required. However, practically, 3–4 d of DR can be considered when investigators aim to achieve a modest degree of precision (r>0·7) for the Korean diet. A recent biomarker study(Reference Ma, Olendzki and Pagoto33) using a double-labelled water method has shown that averaging the first three 24HR produced the best estimates of energy intake. The authors did not find additional improvements with more than three 24HR. Another recent study has assessed the precision, power and sample size of multiple 24HR, calibrated FFQ and a combination of the 24HR and FFQ(Reference Carroll, Midthune and Subar34). Assuming that the 24HR provided an unbiased estimate of usual intake, the authors have found that four to six administrations of the 24HR were optimal for most of the nutrients and food groups, which is similar to the findings of the present study. The authors have also found that a combination of the 24HR and FFQ was better than the 24HR or FFQ only, and that the relative sample size was decreased as the number of 24HR was increased. While we have analysed nutrient intakes from multiple DR only, further studies are needed to assess the required number of DR for food or food group intakes and to compare the precision between one dietary assessment and combination.
The present study has several limitations. Several factors that may explain between-individual or within-individual variations were not examined, such as education level, family size, smoking habits, body size and physical activity for between-individual variations and interviewer effects for within-individual variations. Furthermore, because the participants in the present study were residents of a metropolitan area, these results may not be fully generalisable to the entire Korean adult population. The strengths of the present study include a large number of participants who completed all 12 d DR seasonally for 1 year and a relatively comprehensive examination of the components of within-individual variations compared with previous Korean studies. Furthermore, the present study was the first to examine sources of variation and within- and between-individual variations in Korean young adults (aged 20–45 years). Because DR are important tools to assess the Korean diet and accommodate in-depth information on meals, the present study provides important evidence on the number of required DR to measure the typical Korean diet as well as age- and sex-specific sources of variation in nutrient intakes.
In summary, within-individual variation was the major source of variation, and day of the week, recording sequence and seasonality contributed slightly to variations in daily nutrient intakes for Korean adults in the Seoul metropolitan area. The degree of precision did not substantially increase over 7 d DR, suggesting that greater improvements in precision can be achieved with 2–6 d than with 7–12 d. In general, 3–4 d of DR provide a modest degree of precision (r>0·7), and 6–7 d of DR may be sufficient to ensure a high precision (r>0·8) of the correlation coefficients with true intake.
Supplementary material
To view supplementary material for this article, please visit http://dx.doi.org/10.1017/S0007114513001554
Acknowledgements
The present study was supported by the National Cancer Center (grant no. 0720660) and the Korea Centers for Disease Control and Prevention (grant no. 2009E3301600). The authors' contributions are as follows: D. W. K. contributed to the data collection and data analysis and the interpretation of the study, and wrote a draft; M. K. P. contributed to the data collection and data analysis; J. K., K. O., H. J. and H. Y. P. contributed to the conception and design of the study and the review of the manuscript; J. E. L. contributed to the draft outline, data interpretation and manuscript review; H. Y. P. contributed to the data collection and the review of the manuscript. All the authors read and approved the final manuscript. The authors declare that they have no conflict of interest.


