


Studies of the causes of social unrest often focus on the role of either structural factors (Campante and Chor Reference Campante and Chor2012; Finkel, Gehlbach and Olsen Reference Finkel, Gehlbach and Olsen2015; Scacco Reference Scacco2016) or diffusion (Granovetter Reference Granovetter1978; Kuran Reference Kuran1989; Lohmann Reference Lohmann1994; Andrews and Biggs Reference Andrews and Biggs2006). We argue that structural factors and diffusion interact in important ways. For example, an increase in a local factor will affect unrest locally, but this unrest will diffuse and lead to unrest in other areas too. Furthermore, the structural factors in a given location may help determine how susceptible it is to unrest diffusing in from other areas.Footnote 1
In this article we study how structural factors affect social unrest and address three related issues. First, we examine the importance of three categories of factors in generating unrest: those that relate to motivation, organization and repression. We then consider the effect that a change in a local factor has on the total amount of unrest in an area: its direct effect in the location where the change occurs, and the indirect effect this unrest has in other areas through diffusion. For instance, a worsening of economic conditions in a location may result in unrest there, which then diffuses to other places. The change in the structural factor has therefore generated unrest where the change in the factor occurred and led to unrest in other areas through diffusion. Finally, whether unrest diffuses to a particular location will also depend on that location's structural factors. For example, locations with better economic conditions may be less susceptible to unrest diffusing in from elsewhere.
Addressing these issues with contemporary data poses two challenges. First, unrest often involves fast movements of people who come from a variety of places but concentrate in a small number of locations.Footnote 2 This means that the number of incidents tends to be relatively small, and so there is limited cross-sectional variation. Secondly, it is often difficult to determine what structural values should be used, since the structural factors that affect the individuals who participate are not necessarily those of the locations where the unrest takes place.
We overcome these challenges by focusing on a historical instance of social unrest: the Swing riots of 1830–1831. This wave of unrest involved nearly 3,000 discrete incidents that happened in a short space of time, providing us with considerable cross-sectional variation.Footnote 3 The Swing riots took place at a time when it was difficult to travel, and so most people rioted where they lived. This means that the structural factors that affected the participants were those of the locations where the riots occurred. This allows us to observe the structural factors relevant to each incident in a way that is often impossible with more recent data.Footnote 4 Our analysis uses a large dataset we collected that records all Swing-related incidents and information on a large variety of factors for more than 9,000 parishes in England.
We find that economic conditions were positively associated with local unrest and increased the likelihood that riots would diffuse in from nearby areas. This is consistent with the literature that emphasizes the role of deprivation in unrest (for example, DiPasquale and Glaeser Reference DiPasquale and Glaeser1998; Kawalerowicz and Biggs Reference Kawalerowicz and Biggs2015). In contrast to most previous work, we look at both the direct effect of these factors and the indirect effect they have through diffusion.Footnote 5 We also find that organizational factors – particularly leadership – contributed to the unrest, but only because they facilitated its diffusion. Consequently, leadership in the absence of motivation may not trigger a wave of unrest; this is consistent with the view that social unrest starts spontaneously and with little organization (Epstein Reference Epstein2002; Hassanpour Reference Hassanpour2017; Hobsbawm and Rudé Reference Hobsbawm and Rudé1973). Once the unrest has started, however, leaders can play an important role in its diffusion (for example, Strang and Soule Reference Strang and Soule1998; Vasi Reference Vasi2011). Repression does not appear to have affected the unrest, and whether it facilitated or hindered diffusion depends on how repression is measured. This is consistent with the mixed findings in the literature: some show that repression hinders social unrest (for example, DiPasquale and Glaeser Reference DiPasquale and Glaeser1998; Epstein Reference Epstein2002), while others find that it can increase it (for example, Rasler Reference Rasler1996; Suh, Vasi, and Chang Reference Suh, Vasi and Chang2017).
Our main contribution is to examine in detail how structural factors interact with the diffusion process: we show how changes in local factors can generate unrest in other areas through diffusion, and the extent to which different factors affect a location's susceptibility to unrest diffusing in from elsewhere. We do so in a specific context, but these interactions are important to all forms of social unrest and collective action more generally. Our findings are particularly informative about peaceful protests and those that only involve small-scale violence (for example, Chenoweth and Stephan Reference Chenoweth and Stephan2011). Furthermore, the types of structural factors we consider appear to be as important today as they were in the nineteenth century: motivation, organization and repression are still cited as key factors behind social unrest. The Swing riots were of great historical consequence too: they are the closest that England has ever come to a popular revolution, and they played a key role in the passage of the Great Reform Act of 1832 (Aidt and Franck Reference Aidt and Franck2015).
Framework and Hypotheses
The literature on the causes of social unrest emphasizes both the role of the structural factors that make individuals more likely to participate and the process of diffusion through which this unrest spreads between areas. In this article we examine how the two are linked by focusing on the interaction between three types of structural factors and the diffusion process. The first group of factors relates to motivation: people need a reason to participate. Secondly, social unrest only takes place when a sufficient number of individuals participate, and this may require the presence of leaders or some form of organization. Finally, the potential consequences in the form of repression will help each individual decide whether to participate in the unrest.
Once the unrest begins, individuals may decide to join as a result of what they see happening in other areas, and this process of diffusion can interact with the structural factors. For example, a change in a factor in location i will affect unrest locally, which in turn can lead to unrest in other locations through diffusion. Furthermore, the structural factors mediate this diffusion, in the sense that conditions in location j may affect the probability that it experiences unrest as a result of the unrest in location i. In the rest of this section we develop our specific hypotheses.
Motivation
Many factors could motivate individuals to participate in social unrest. Early research on the United States identified two factors that made cities more likely to experience race riots: the fraction of African Americans in the population and its location in the South (Spilerman Reference Spilerman1970). Since then the literature has looked at other cases and other factors, including poverty and income shocks (for example, Aidt and Leon Reference Aidt and Leon2016; Kawalerowicz and Biggs Reference Kawalerowicz and Biggs2015), demographics (for example, Campante and Chor Reference Campante and Chor2012; Nordås and Davenport Reference Nordås and Davenport2013; Urdal Reference Urdal2006), and ethnic and religious diversity (for example, Scacco Reference Scacco2016; Wilkinson Reference Wilkinson2004; Wilkinson, Reference Wilkinson2009). Myers (Reference Myers1997) finds that economic and migration pressures in the United States help explain the frequency of race riots in the 1960s. Olzak, Shanahan and McEneaney (Reference Olzak, Shanahan and McEneaney1996) and Olzak and Shanahan (Reference Olzak and Shanahan2003) show that ethnic competition was a primary driver of riots in the United States, and Dancygier (Reference Dancygier2010) highlights the interaction between economic scarcity and political power in determining the incidence of immigrant riots in the United Kingdom.Footnote 6 In the context of the Swing riots, Caprettini and Voth (Reference Caprettini and Voth2020) have shown that the adoption of the threshing machine, a form of labor-saving technology, was an important factor in determining whether a parish experienced riots.
These factors could also affect how individuals respond to unrest taking place near them. Granovetter (Reference Granovetter1978) stresses that individuals have different thresholds for participation, and socio-economic factors could help determine these thresholds. For example, deprivation could make individuals more likely to imitate the actions of their neighbors. We discuss diffusion in more detail below. Similarly, Myers (Reference Myers2000) argues that some factors might make a city more susceptible to diffusion, including the size of its black population. Scacco (Reference Scacco2016) finds that in Nigeria, poverty is the “pull’ factor, but that network connections are necessary to turn this into unrest, while Soule (Reference Soule1997) shows that tactics spread across universities and colleges that were similar in terms of type, endowment and reputation. That is, local conditions can help determine whether unrest will happen as a result of diffusion from nearby areas.
Hypothesis 1a: Factors that motivate potential rioters increase the likelihood of unrest.
Hypothesis 1b: Factors that motivate potential rioters increase the likelihood that unrest diffuses in from nearby areas.
Organizational Capacity
The literature takes two different views on the role of organizational capacity, consistent with the distinction drawn by Andrews and Biggs (Reference Andrews and Biggs2006) between spontaneity and organization. The first interprets unrest as a spontaneous response to structural factors with minimal local organization or coordination between individuals (for example, Epstein Reference Epstein2002; Hobsbawm and Rudé Reference Hobsbawm and Rudé1973). This is consistent with the decentralized nature of many riots (for example, Morrell et al. Reference Morrell2011) and with the idea that unrest can be spontaneous (Hassanpour Reference Hassanpour2017). The second view dates back to at least resource mobilization theory (McAdam Reference McAdam1982; McCarthy and Zald Reference McCarthy and Zald1977), which emphasizes the importance of associations and the rationality of actors in organizing collective action. For example, Morris (Reference Morris1981) highlights the importance of a movement's internal organization, Minkoff and McCarthy (Reference Minkoff and McCarthy2005) focus on the role of organizational decision making, and Dahlum, Knutsen and Wig (Reference Dahlum, Knutsen and Wig2019) examine the interaction between motivation and capacity, arguing that the industrial and middle classes are best placed to spearhead a successful movement because they are the most likely to see the benefits (motivation) but also have the ability to coordinate (capacity). In the case of incidents like those in the Swing riots, leadership is likely to matter more than organizations. For example, leaders could help organize collective action. A number of studies have examined the role of leaders in social unrest, including Strang and Soule (Reference Strang and Soule1998), who consider the part played by ‘professional change agents’.
Leaders could also play an important role in the process of diffusion. For example, they could be more informed about what is happening elsewhere and better placed to organize local action in response. Morris (Reference Morris1981), McAdam (Reference McAdam1982) and Andrews and Biggs (Reference Andrews and Biggs2006) argue that organization is necessary for protest to spread, while Vasi (Reference Vasi2011) examines the role of brokers who create links between various groups. Leaders assume the role that in the more general diffusion literature is played by the innovators and early adopters (Givan, Roberts and Soule Reference Givan, Roberts, Soule, Givan, Roberts and Soule2010, 8). Areas with more leaders should therefore be more likely to experience unrest as a result of diffusion. We summarize this discussion in the following hypothesis:
Hypothesis 2a: Factors that facilitate local organization increase the likelihood of unrest.
Hypothesis 2b: Factors that facilitate local organization increase the likelihood that unrest diffuses in from nearby areas.
The alternative to Hypothesis 2a is that the unrest is spontaneous and happens without organization. The alternative to Hypothesis 2b is that diffusion is mediated by factors other than organization.
Repression
Since repression can increase the costs of participation, we would expect to see less unrest in areas with more repression. For example, DiPasquale and Glaeser (Reference DiPasquale and Glaeser1998) show that police expenditures reduced riot intensity across US cities in the 1960s. Wilkinson (Reference Wilkinson2004, Reference Wilkinson2009) argues that riots take place only if the state apparatus decides not to repress them, which in turn depends on electoral incentives.Footnote 7 In general, the literature finds conflicting results, which is consistent with the idea in the threats and opportunities literature that repression may trigger more unrest (threat), but the lack of repression may permit it (opportunities). Repression could lead to more unrest if, for example, it causes outrage in the population. DiPasquale and Glaeser (Reference DiPasquale and Glaeser1998) find that repression reduces unrest, while in Opp and Roehl (Reference Opp and Roehl1990) and Rasler (Reference Rasler1996) conclude that it can increase it.
Repression is at the core of many well-known models of diffusion, which maintain that the threat of punishment can prevent individuals from participating (for example, Granovetter Reference Granovetter1978; Kuran Reference Kuran1989). But repression could simply displace the unrest or even increase it. For example, during the 2011 London riots participants reacted to increases in policing by relocating their activities to other parts of the city (Davies et al. Reference Davies2013), while Suh, Vasi and Chang (Reference Suh, Vasi and Chang2017) show that repression facilitated the spread of the Occupy protests in 2011 by encouraging the creation of new Facebook and Twitter accounts in other cities. We summarize this discussion as follows:
Hypothesis 3a: Repression decreases the likelihood of unrest.
Hypothesis 3b: Repression decreases the likelihood that unrest diffuses in from nearby areas.
The alternative to Hypothesis 3a is that repression increases the likelihood of unrest, while the alternative to Hypothesis 3b is that repression facilitates diffusion.
Diffusion
The literature on the diffusion of social unrest is extensive, but our focus here is on how this process interacts with the structural factors. The diffusion of social unrest shares many features with technology diffusion (Rogers Reference Rogers1995): it begins with instigators in one location, and spreads when individuals in other places decide to join. Granovetter (Reference Granovetter1978) shows how an individual's decision can set this process in motion, Kuran (Reference Kuran1989) uses this logic to explain revolutions, and Lohmann (Reference Lohmann1994) extends it into a theory of information cascades. What spreads in this case could be ideas about new elements in the repertoire of contention (Biggs Reference Biggs2003; McAdam, Tarrow and Tilly Reference McAdam, Tarrow and Tilly2001; Tarrow Reference Tarrow2011) or issue frames (Givan, Roberts and Soule Reference Givan, Roberts, Soule, Givan, Roberts and Soule2010). Diffusion could also be the result of both increases in rates of protest and in the density of social movement organizations (Minkoff Reference Minkoff1997). McAdam and Paulsen (Reference McAdam and Paulsen1993) argue that diffusion happens through interactions between individuals who are part of the same social networks.Footnote 8
In the context of the Swing riots, previous work has emphasized the importance of diffusion between nearby parishes (Aidt, Leon-Ablan and Satchell Reference Aidt, Leon-Ablan and Satchell2020; Hobsbawm and Rudé Reference Hobsbawm and Rudé1973). This is natural because the Swing riots pre-date modern communication technologies, and so at that time information had to travel spatially.Footnote 9
Hypothesis 4: Social unrest diffuses between geographically proximate areas.
The Historical Case and Operationalization
Background
The Swing riots were the largest rural uprising in nineteenth-century England. They started in Kent in August 1830, quickly spread to the surrounding counties, and peaked in late November; by March 1831 they had largely ended. During this period there were nearly 3,000 incidents that included the burning of barns and ricks, the destruction of threshing machines, robbery and forced levies of money, assaults on poor law officials, wage and tithe riots, and anonymous threatening letters.Footnote 10 Figure 1 shows the locations of these incidents.

Figure 1. The location of the Swing riots
Note: the map shows the location of all Swing-related incidents. The radius of each circle reflects the number of incidents in each parish.
The rioters were mostly farm laborers who were employed by tenant farmers on precarious contracts.Footnote 11 Rural unemployment was high throughout this period, especially outside the peak harvest season, and many farm laborers lived in extreme poverty. The demands of the Swing rioters were mostly economic: higher wages, separation of poor law subsidies from wage payments and more work. The initial response was local and slow, and this allowed the riots to spread for months. This changed when a new national government came to power in November 1830 and introduced new measures aimed at ending the riots. By December 1830 over 2,000 rioters had been arrested, and many of them were eventually sentenced to death or transported to Australia.
Data and Measurement
We digitized and geo-coded the Swing riots data in Hobsbawm and Rudé (Reference Hobsbawm and Rudé1973, Appendix II), the Family and Community Historical Research Society (Holland Reference Holland2005) and Griffin (Reference Griffin2012). These sources relied on information from Home Office documents, newspapers, and national and local archives. The data record the location (parish/township/hamlet) and county of each Swing-related incident, its date and in some cases a short description of what happened. The data are almost certainly a complete record of what was reported, and although some incidents were likely missed in these reports, we have no reason to believe that our sample is unrepresentative.Footnote 12 The data on structural factors come from a variety of primary and secondary sources, including the 1831 Population Census of Great Britain.Footnote 13 These data are recorded at the parish level and are fully available for 9,484 English parishes.Footnote 14 They do not exhibit any time variation, and so our analysis focuses on cross-sectional specifications: we use the total number of incidents experienced by each parish during the duration of the Swing riots (28 June 1830 to 3 April 1831).
The Appendix discusses in more detail our sources and how our variables are constructed: Table A2 shows the correlations between the variables and Table A3 reports descriptive statistics.
Motivation
To operationalize the factors outlined in the hypotheses we turn to the historiographical literature. There is general agreement among social historians that the Swing rioters were primarily motivated by economic factors. Hammond and Hammond (Reference Hammond and Hammond1912, Ch. 11) and Hobsbawm and Rudé (Reference Hobsbawm and Rudé1973, Ch. 4) emphasized the importance of the local agricultural economy (cereal versus dairy production) and the number of people working in agriculture. Hammond and Hammond (Reference Hammond and Hammond1912, 85) also argued that the Enclosure Acts of rural England were an important factor, since they reduced the access of the local poor to common land in some rural areas, potentially increasing their economic hardship. The wealth of a parish could have played a role too, for example by increasing inequality or the generosity of the poor laws (the welfare system), which was funded locally.Footnote 15
To capture these factors, we use Caird's (Reference Caird1852) division of England into the eastern counties dominated by cereal production (mostly grain and wheat) and those in the west that focused on dairy farming (see Appendix M1). We use this to construct an indicator variable Cereal that equals 1 if the region specialized in cereals; this variable captures variation in the type of agriculture. We measure the importance of agriculture to the parish economy by recording the number of families engaged in this activity (log Families in Agriculture). We include a dummy variable Enclosure that equals 1 if the parish had enclosed prior to 1830. We also include a variable Wealth that measures the aggregate value of property in 1815.
Finally, we also include two demographic variables: the number of adult men (log Males) and the population of a parish (log Population). Most rioters were men, and so log Males proxies for the number of potential rioters. The population of the parish helps control for urbanization.Footnote 16
Organizational Capacity
Charlesworth (Reference Charlesworth1979), Tilly (Reference Tilly1995, Ch. 7) and Thompson (Reference Thompson1963, 225–227) stressed the central role of local leaders in initiating riots in a parish, and suggested that these leaders were often the economically independent and literate artisans, craftsmen, traders and shopkeepers.Footnote 17 Consequently, we measure organizational capacity by including the number of people employed in trade and handicrafts (log Traders and Craftsmen) and in the professions including law, medicine and teaching (log Professionals). Furthermore, civic groups and individuals could petition parliament in relation to local or national issues, and this likely required initiative and leadership. We therefore use the total number of petitions sent from a parish as a proxy for organizational capacity. The variable log Petitions records the number of petitions sent to parliament between 1828 and 1831 on the three main social issues of the period – slavery, Catholic rights and parliamentary reform. Finally, newspapers could have allowed local leaders to stay informed about riots in other parts of the country; the variable Newspapers is a dummy that equals 1 if the parish was within 10 km of where a newspaper was published.
Repression
In the 1830s law and order was the responsibility of local magistrates, but their ability to act was limited: they relied on volunteers, many of whom were initially reluctant to help. This generated large spatial differences in the response to the riots, and Hobsbawm and Rudé (Reference Hobsbawm and Rudé1973, 189) argue that the riots happened largely in areas with little or no repression. We capture repression through two variables: log Distance to Garrison and Police; the first measures the distance to the nearest garrison, while the second is a dummy that equals 1 if the parish is located within a 10 km radius of where a police force was based. We use these variables because the effectiveness with which the local magistrates could respond to the riots likely depended on whether there was a garrison or police force nearby.Footnote 18 Appendix Figure M4 shows the location of the garrisons and police forces.Footnote 19 The garrisons were located primarily at the navy ports, while the police forces were mostly located in urban areas.
Diffusion
Hypothesis 4 suggests that diffusion took place between areas that were near each other geographically; this is consistent with the historical context and with previous studies of the Swing riots (Aidt, Leon-Ablan and Satchell Reference Aidt, Leon-Ablan and Satchell2020; Hobsbawm and Rudé Reference Hobsbawm and Rudé1973). Since our data for the structural factors do not exhibit time variation, we need to use cross-sectional specifications. We measure diffusion with a spatial lag that equals the average number of riots that took place in the neighborhood of each parish.Footnote 20 In the next section we discuss how this is done econometrically.
Empirical Specification
The structural factors exhibited no time variation during the 40 weeks of unrest, and so we have to use cross-sectional variation in the total number of incidents experienced by different parishes.Footnote 21 We regress the total number of riots in a parish on the structural factors and on a spatial lag. This spatial lag measures the average number of riots in a 10 km neighborhood of each parish; we use 10 km because this corresponds to a walking distance of 2–3 hours, which is as far as the agricultural laborers typically traveled (Hobsbawm and Rudé Reference Hobsbawm and Rudé1973, 212). The spatial lag measures the intensity of rioting in the neighborhood of a parish, which we interpret as a measure of diffusion. This means that we explain cross-sectional variation in riots using variation in the structural factors and in the spatial lag. There are two main sources of endogeneity: omitted variables that are correlated with some of the factors we consider, and simultaneity bias induced by the spatial lag. We therefore employ an instrumental variable strategy, which we describe in more detail in the next section.
We then consider how changes in a structural factor in one parish may affect the total number of riots in the country. The intuition is that a change in a factor in a parish will lead to, say, more riots in that parish, and those riots will then diffuse. Thus the total effect needs to take this diffusion into account. The size of this total effect will depend on the parish we consider: changes in structural factors in well-connected parishes will generate more diffusion than changes in relatively isolated ones.
Finally, we run a regression that includes interactions between the structural factors and the spatial lag. This splits the effect of each factor into two: that which it has when there are no riots near the parish, and the additional effect of this factor when there are riots nearby. The first effect can be thought of as the role of that factor in triggering riots in the absence of diffusion (including the first riot in a wave of unrest), while the second we interpret as the effect of that factor in facilitating or hindering diffusion.
Specification
The baseline specification is:
 $${\bf riots} = \alpha \iota + {\bf factors} \times \gamma + \beta \times {\boldsymbol W} \times {\bf riots} + {\bf county} \times \delta + {\bf u}, \;$$
which is a standard spatial autoregressive model in which riots is a n × 1 vector where n is the number of parishes and element i is the total number of riots that took place in parish i between Monday, 28 June 1830 and Sunday, 3 April 1831. On the right-hand side, the first term includes a scalar α and a unit vector  $\iota $ of length n. The matrix factors has dimension n × k where k is the number of structural factors, with row i corresponding to the value of the factor for parish i, while γ is a vector of length k with its elements corresponding to the coefficients on the factors. We consider the twelve parish-specific factors related to motivation, organizational capacity and repression introduced above. The third term includes the scalar β and the spatial lag W × riots. W is a n × n row-normalized weight matrix where element (i, j) is non-zero if parishes i and j are within 10 km of each other and all other elements are set to 0.Footnote 22 This spatial lag captures diffusion: for a parish i it records the average number of riots that took place in parishes within 10 km.Footnote 23 The matrix county has dimension n × c where c is the number of counties, with element (i, j) being equal to 1 if parish i is in county j and 0 otherwise, while δ is a c × 1 vector of county fixed effects. The inclusion of county effects helps control for shared characteristics between clusters of parishes and exposure to the same shocks, so that the specification exploits variation in parish factors and in the spatial lag relative to the within-county average. The error is given by the n × 1 vector u.
The presence of a spatial lag in Equation 1 implies that ordinary least squares estimates will be biased and inconsistent, since the spatial lag is mechanically correlated with the error. There will also be omitted variables that could potentially bias our results. To address these issues, we employ an IV strategy and estimate the equation with a spatial two-stage least-squares (2SLS) estimator developed by Kelejian and Prucha (Reference Kelejian and Prucha1998). This estimator instruments for the spatial lag with factors, W × factors and W 2 × factors, where W is the weight matrix, W 2 is the second spatial lag, and factors is the matrix of structural factors. The intransitive nature of our network, where i and j can be neighbors, j and k can be neighbors, but i and k will often not be, is a sufficient condition for this instrument set to be valid and informative. We use the spatial heteroskedasticity autocorrelation consistent (SHAC) version of this estimator, which adjusts the spatial 2SLS errors for heteroskedasticity of unknown form and for spatial autocorrelation (Kelejian and Prucha Reference Kelejian and Prucha2007). For robustness, we also employ a maximum-likelihood Poisson estimator that takes into account the count nature of our dependent variable.
Results
Structural Factors
Table 1 reports SHAC and Poisson estimates of γ and β. Column 1 shows a specification with the twelve factors and Column 2 reports maximum-likelihood Poisson estimates. Column 3 reports results that control for the effect that the structural factors of neighboring parishes have on the riots in parish i. To account for these factors, we add the term W × factors × ρ to Equation 1. Here the row-normalized weight matrix W has dimension n × n, with all elements set to zero except those corresponding to parishes within 10 km of each other. Importantly, the fact that the weight matrix is row-normalized implies that it averages the value of each of the twelve structural factors across the neighboring parishes.Footnote 24
Table 1. The effect of parish-specific structural factors

Note: standard errors in parentheses. Constants not reported. The unit of observation is the parish, and element i in the vector riots equals the total number of riots in parish i during the Swing riots. For a parish i, W x riots refers to the average number of riots across parishes within 10 km of its centroid (excluding riots that happened in i itself). The SHAC estimator used to obtain the coefficients in Columns 1 and 3 is implemented with the sphet package in R. The standard errors reported in these columns are robust to heteroskedasticity and spatial correlation. The coefficients in Column 2 are from a Poisson regression estimated using the ppml command in Stata. Column 3 shows a specification that includes the structural factors of neighboring parishes. This allows the average of each of the twelve factors in parishes within 10 km of parish to influence the riots in i. *** p < 0.001, ** p < 0.01, * p < 0.05, < 0.1
We find that parishes located in the cereal-producing regions of England and those with more families employed in agriculture experienced more riots. The enclosure of common land before 1830 is uncorrelated with the riots, contrary to the conjecture in Hammond and Hammond (Reference Hammond and Hammond1912). Property values (Wealth) are positively associated with riots, which is consistent with the hypothesis that inequality aggravated the discontent that led to rioting, but also with the idea that laborers in wealthy parishes rioted because they anticipated the concessions that those parishes could make. These effects are large; for example, cereal-growing areas are associated with an additional 0.111 riots, which is equal to 50 per cent of the average number of riots across parishes. A one-standard-deviation increase in the value of log Families in Agriculture is associated with 0.08 more riots, which is equal to a third of the average number of riots.Footnote 25 The coefficients on log Males and log Population are not significantly different from zero.
Turning to organizational capacity, the number of people employed in trade, in the professions, and the number of petitions sent to parliament are all positively associated with the number of riots in a parish. In particular, a one-standard-deviation increase in the value of these variables is associated with an increase in riots that is equal in size to 41, 23 and 23 per cent of the average number of riots across parishes.Footnote 26 These results are consistent with resource mobilization theory (McAdam Reference McAdam1982; McCarthy and Zald Reference McCarthy and Zald1977), and in particular with the literature that emphasizes the role of leaders (Charlesworth Reference Charlesworth1979; Strang and Soule Reference Strang and Soule1998; Vasi Reference Vasi2011). Finally, in one specification, being close to a town where a newspaper was published had a negative and significant effect on riots. Only a small number of cities had newspapers, and they were typically county seats where local politics and social conditions made rioting less likely.
We observe that proximity to a police force is correlated with more riots, which is consistent with the idea in the threats and opportunities literature that repression can lead to more unrest. However, distance to a garrison is uncorrelated with the riots. These mixed results are consistent with the findings in the empirical and theoretical literature on repression and unrest.
Finally, the coefficient on the spatial lag is positive and highly significant in all three columns: the total number of riots in a parish is positively associated with riots nearby, showing that riots cluster in space.Footnote 27
The Effect of Changes in Structural Factors
In order to examine how diffusion can augment the effect of changes in structural factors, we conduct a thought experiment: we increase the value of a structural variable in one parish by 1 and calculate the total number of riots that would result from this change. The effect has two parts. First, the change in the factor affects the number of riots in the parish where the change happens. Second, these additional riots diffuse and lead to new riots in other parishes, which in turn also diffuse and so on. To estimate the total effect, we need to trace the consequences of the change in the factor through the whole network of parishes. To do this we solve for riots in Equation 1:
 $${\bf riots} = {\boldsymbol N}( {\alpha \iota } ) + {\boldsymbol N} ( {{\bf factors} \times \gamma } ) + {\boldsymbol N} ( {{\bf county} \times \delta } ) + {\boldsymbol Nu}, \;$$
Where
 $$ {\boldsymbol N} \equiv ( { {\boldsymbol I}-\beta_1 {\boldsymbol W}} ) ^{{-}1}, \;$$
where the term N(factors × γ) captures the effect of the factors. The spatial connections between parishes are summarized in the matrix N. In particular, Column i captures the effect of a one-unit change in riots in parish i, where N j,i is the effect this change has on parish j. Therefore, the sum of the elements in Column i corresponds to the total effect of a one-unit change in riots in parish i. The total impact of a one-unit increase in factor k in parish i is given by [N 1,i + … + N n,i] × γ k; that is, γ k tells us the number of additional riots that result from a one-unit increase in factor k in parish i, and [N 1,i + … + N n,i] is the total number of riots that result from the diffusion of each additional riot in i.
The size of this effect depends on which parish sees the change in the structural factor, since connectivity affects its diffusion; this is reflected in the fact that different columns have different totals. Figure 2 summarizes this information by presenting the frequency distribution of column totals (based on the coefficients in Column 1 of Table 1). The distribution has a mean of 4.15, a median of 4.19 and a standard deviation of 0.55, with a maximum impact of 6.39. That is, a shock to factor k in the parish with the average column total will generate a total riot effect equal to 4.15 × γ k, of which γ k is the direct effect and 3.15 × γ k is the result of diffusion. For example, suppose that the variable ln Petitions goes up by 1 in the parish with the average column total. This then leads to a direct increase of 0.105 riots in that parish, plus an additional 3.15 × 0.105 = 0.33 riots from diffusion. In conclusion, the average effect due to the diffusion process is 3.15 times the size of the direct effect of an exogenous change in a structural factor.Footnote 28
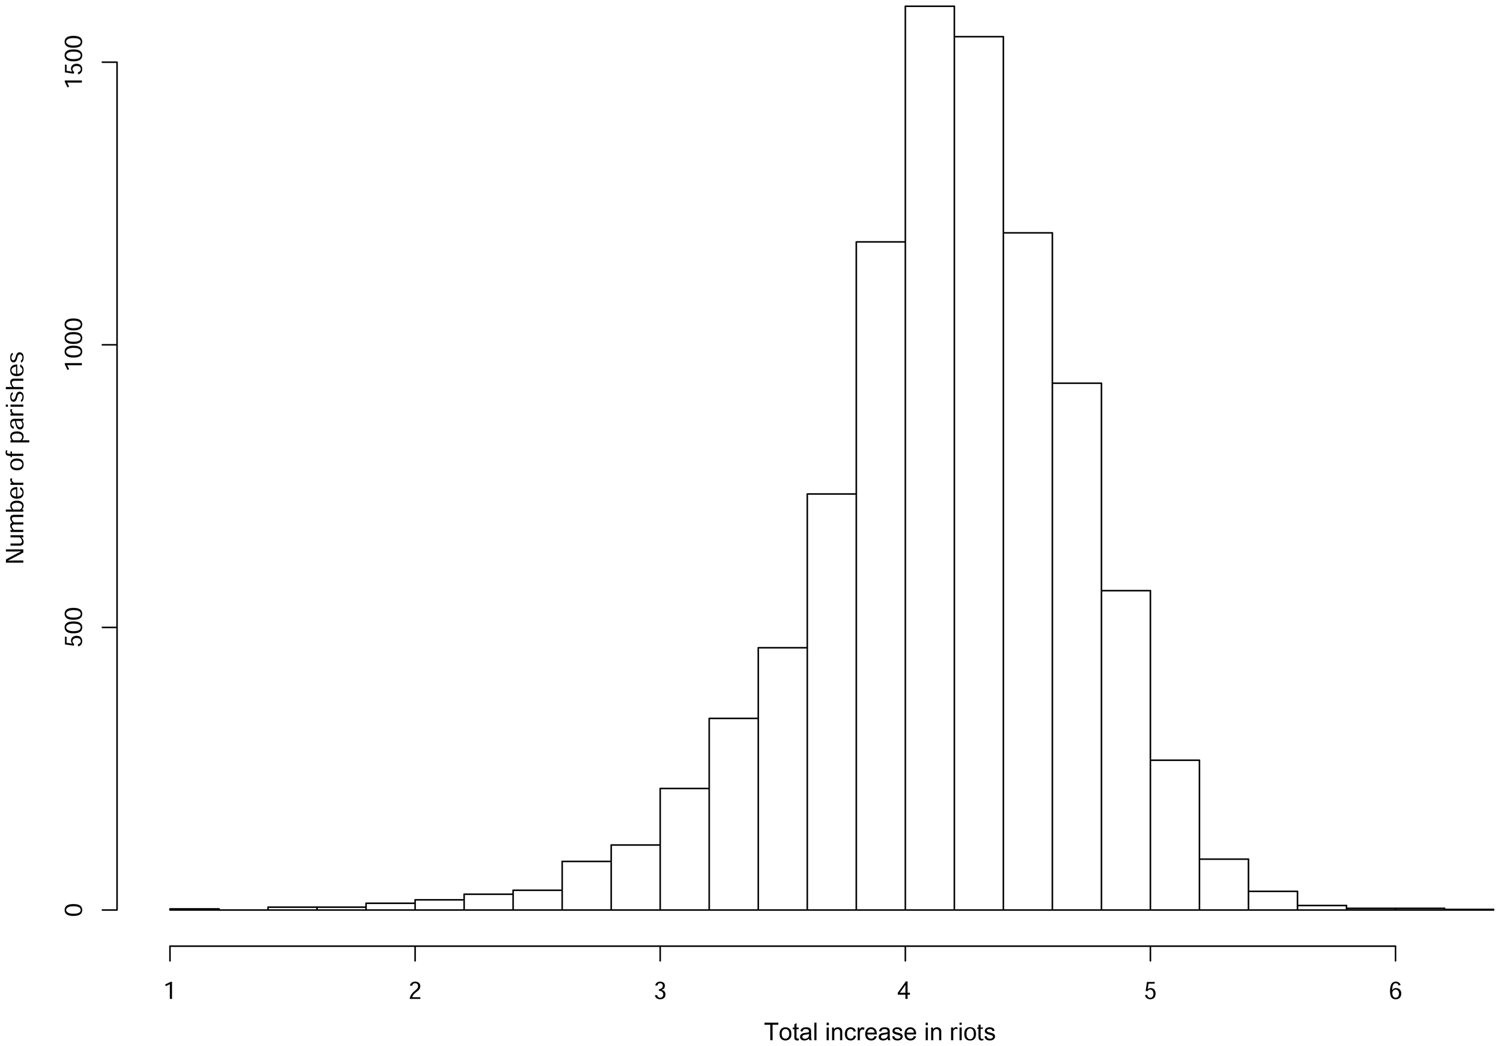
Figure 2. Frequency distribution of the total increase in riots that results from a one-unit increase in factor k (setting γ k = 1)
Note: the column totals are calculated using the estimates reported in Column 1 of Table 1. The mean of this distribution is 4.15 and the median is 4.19.
How Structural Factors Affect Diffusion
We now turn to the question of how structural factors affect the diffusion of riots into a parish. To do so, we augment Equation 1 with a set of interactions between the structural factors and the spatial lag:
 $$\left({\mathop \sum \limits^{12}_{k = 1} \phi_k {\boldsymbol D} ( {{\bf factors}_k} ) } \right)\times {\boldsymbol W} \times {\bf riots}, \;$$
where the ϕ k are parameters and D(factorsk) is an n × n matrix where element (i,i) is equal to the value of factor k for parish i, with all non-diagonal elements set equal to 0.
Including these interaction terms splits each of the effects in Table 1 into two: the effect of the factor when the spatial lag is zero, and the additional effect that factor has when the spatial lag is non-zero. Since the first coefficient is the effect of the factor in the absence of diffusion, we can interpret it as the role of that factor in triggering the initial riot. We interpret the second as the effect of the structural factor on the process of diffusion: a positive coefficient means that the factor facilitates diffusion into the parish, while a negative coefficient means that it hinders it.
Table 2 reports the results. We find that diffusion was higher into parishes that grew cereals and those with more families in agriculture.Footnote 29 We also find that diffusion was higher in parishes that had recently experienced enclosure and those with greater wealth.Footnote 30 That is, economic conditions facilitated the spread of riots. Of these variables, only the type of agriculture still shows a direct effect, so that it can trigger riots (including the initial one) in the absence of diffusion. Population size has a positive and marginally significant effect.
Table 2. The effect of parish-specific structural factors on diffusion

Note: standard errors in parentheses. Constants not reported. D(factork) refers to an n × n diagonal matrix where element (i,i) equals the value of structural factor k in parish i. The expression D(factork) × W × riots refers to the interaction between each parish's factor k and the spatial lag. The results are from the SHAC estimator which is implemented with the sphet package in R. The standard errors are robust to heteroskedasticity and spatial correlation. *** p < 0.001, ** p < 0.01, * p < 0.05, < 0.1
Furthermore, three of the variables that capture leadership – log Traders and Craftsmen, log Professionals and log Petitions – are associated with greater diffusion.Footnote 31 None of these variables shows a direct effect once their interaction with the spatial lag is included, suggesting that the correlations we found above are largely due to cases where leadership facilitated the diffusion of nearby riots. One interpretation of these results is that in the absence of motivation, leadership is not enough to set off the initial riot. This is consistent with the literature that views riots as spontaneous (Epstein Reference Epstein2002; Hassanpour Reference Hassanpour2017; Morrell et al. Reference Morrell2011). However, leaders still matter because they help the initial unrest to diffuse (Strang and Soule Reference Strang and Soule1998; Vasi Reference Vasi2011).Footnote 32
Finally, we find that repression is positively correlated with diffusion when measured using proximity to a police force (Police), but negatively correlated with diffusion when it is measured using the distance to the nearest garrison (Distance to Garrison). This is consistent with the threats and opportunities literature; the presence of a police force may have increased local discontent with the authorities and facilitated diffusion, while being far from a garrison may have limited the magistrates' ability to repress and hence allowed the riots to spread into a parish. These findings are consistent with the mixed results found in the literature on repression and unrest.
In summary, we find that motivation had both a direct effect on riots in a parish and facilitated their diffusion. The presence of leaders was correlated with diffusion; repression was associated with diffusion too, but the direction of the relationship depends on how repression is measured.
Conclusion
We examine the effect that three types of structural factors have on social unrest, how changes in these factors can generate unrest that then diffuses to other areas, and the extent to which structural factors facilitate or hinder diffusion. We do this in the context of a historical episode of social unrest, the Swing riots of 1830–1831. The Swing riots were the foundational case in the study of popular unrest in social history, and provide us with an ideal setting in which to address these issues: unlike more recent data on social unrest, we have a large number of discrete incidents, each with a well-defined set of structural factors. We find that factors related to economic activity likely triggered the unrest, and that both economic factors and local leadership are associated with greater diffusion. Whether repression facilitated or hindered diffusion depends on how repression is measured. Finally, if a factor in a given parish is changed so as to generate an additional incident, this change would on average generate 3.15 more incidents through diffusion.
Our results show that structural factors and the diffusion process are closely linked. Although our findings are obtained by focusing on a specific time and place, the complex interplay between structural factors and diffusion that we uncover is relevant to many contemporary episodes of social unrest.
Supplementary material
Online appendices are available at https://doi.org/10.1017/S0007123420000873.
Data availability
The data, replication instructions, and the data's codebook can be found at Aidt and Leon-Ablan (Reference Aidt and Leon-Ablan2020) (https://doi.org/10.7910/DVN/H0IB1M).
Acknowledgements
The authors are listed in alphabetical order. We wish to thank Ali Hemmingway, Jay Lee, Simon Pittaway, Naomi Roba, Andriy Levitskyy and Arjun Dwesar Kumar for excellent research assistance. We are also grateful to the Cambridge Group for the History of Population and Social Structure for providing us with shape files for the maps of the ancient counties and parishes (ESRC Grant RES-000-23-1579), access to the digitized 1831 Population Census (ESRC Grant RES-000-23-1579), and access to part of the digitized 1815 Poor Law returns and the directory of stagecoach services 1836 (Leverhulme Trust, RPG-2013-093). We thank Mauricio Rodriguez Acosta for sharing with us data on the location of police forces in England and Wales. We wish to thank the seminar audiences at King's College London, Essex, Oslo, Nottingham, Munich, Sheffield, Leicester, Rennes, Barcelona, Birmingham, UCL, Alghero, LSE, Oxford, Universitat Pompeu Fabra, Glasgow, York, NEPS, EPCS, Silvaplana, EPSA and MPSA for their comments. We thank Barry Eichengreen, Marco Manacorda, Andrea Tesei, Kristian S. Gleditsch, Vincenzo Bove, Ruben Enikolopov, Antonio Ciccone, Stephane Wolton, Jordi Blanes i Vidal, Lena Gerling, Carlos Velasco, Pramila Krishnan, Elena Seghezza, Jean-Paul Azam, Nadia McCloud-Rose, Benjamin Wesley Campbell and James Fenske for their helpful suggestions, and Leigh Shaw-Taylor for many insightful discussions.
Financial support
This research was supported by the British Academy (BA grant JHAG097).


 Open access