


Introduction
In vitro rearing of honey bee larvae is an ideal way to study the development (Bertholf, Reference Bertholf1925; Myser, Reference Myser1954; Rembold et al., Reference Rembold, Kremer and Ulrich1980) and caste determination of honey bees (Chen et al., Reference Chen, Wang, Zhang, Liu, Xu and Wang2021). Moreover, by changing the ratio of the diet, it is also possible to study a variety of nutrients (Kupke et al., Reference Kupke, Spaethe, Mueller, Rossler and Albert2012; Veloso and Lourenço, Reference Veloso and Lourenço2013; Zhang and Xu, Reference Zhang and Xu2015; Ma et al., Reference Ma, Wang, Zhang, Wang, Liu and Xu2016), pesticides (Fine et al., Reference Fine, Cox-Foster and Mullin2017), antibiotics, and the influence of micro plastics on bees; it is also possible to establish various disease models to study the performance of honey bees in response to disease and mites (Chan et al., Reference Chan, Melathopoulos, Pernal and Foster2009; Sreelakshmi and Paul, Reference Sreelakshmi and Paul2014; BenVau and Nieh, Reference BenVau and Nieh2017; Al-Ghamdi et al., Reference Al-Ghamdi, Ali Khan, Javed Ansari, Almasaudi and Al-Kahtani2018). However, the technology of rearing larvae in vitro is hobbled by many realities. On the one hand, honey bees live in social groups with different division of labor (Reim and Scheiner, Reference Reim and Scheiner2014). The queen is responsible for laying eggs, and the larvae live in the nest chamber and are mainly fed by workers until the pupal stage (Kaftanoglu et al., Reference Kaftanoglu, Linksvayer and Page2015). The artificial diet is significantly different from that of the natural colony (larvae in natural colonies feed on worker jelly for the first 3 days and then a mixture of honey and pollen) (Wang et al., Reference Wang, Ma and Xu2015; Tsuruda et al., Reference Tsuruda, Chakrabarti and Sagili2021), and the larvae rearing does not undergo the sealing stage as in the natural colony. Therefore, it is difficult for researchers to accurately define the larval and prepupal stages due to the heterogeneous internal development of larvae under rearing conditions in vitro. On the other hand, honey bees have evolved individual and group strategies to fight disease, based on the pressures they experience from parasites and pathogens (vanEngelsdorp et al., Reference vanEngelsdorp, Traynor, Andree, Lichtenberg, Chen, Saegerman and Cox-Foster2017). For example, hygienic behavior (Rothenbuhler and Thompso, Reference Rothenbuhler and Thompso1964; McAfee et al., Reference McAfee, Chapman, Iovinella, Gallagher-Kurtzke, Collins, Higo, Madilao, Pelosi and Foster2018), the construction of nests with antimicrobial materials (Christe et al., Reference Christe, Oppliger, Bancalà, Castella and Chapuisat2003), and nursing their offspring in sterile nests (Al-Waili et al., Reference Al-Waili, Salom, Al-Ghamdi and Ansari2012). However, the larvae reared in vitro will lose the protection of herd immunity, which make them easier to be infected by pathogens (viruses, bacteria, and fungi). In view of this, strengthening individual antibacterial ability is an important strategy against pollution for rearing larvae in vitro.
Honey bee metamorphosis is accompanied by the corresponding changes in internal organs. The gut is an important organ for digestion, absorption, and maintenance of hemolymph homeostasis in honey bees, and studies have found that the intestinal tract of larvae is quite different from that of adults (Dobrovsky, Reference Dobrovsky1951; Goncalves et al., Reference Goncalves, Fernandes, Santana, Martins, Zanuncio and Serrao2017). In honey bee, the gut undergoes metamorphic reconstruction (da Cruz-Landim and Cavalcante, Reference da Cruz-Landim and Cavalcante2003; Rolff et al., Reference Rolff, Johnston and Reynolds2019), a process that starts from the prepupal (PP) stage. At first, the degeneration of larva epithelium is happening in the gut, then forming a new epithelium in the white-eyed pupal stage (Pw), undergoing further development in the pupal stage and eventually developing into the adults gut (Wu et al., Reference Wu, Zhou, Wang, Dai, Xu, Jia and Wang2015; Rolff et al., Reference Rolff, Johnston and Reynolds2019). These studies suggested that the development of the gut seemed to be closely related to the transition from larva to prepupa.
During the long-term process of fighting against foreign pathogens, honey bees have evolved corresponding molecular strategies, and have developed the sensitive and highly expressed Apidaecin gene family and other antimicrobial peptide families that are predicted to become substitutes for antibiotics owing to their natural antibacterial activity (Casteels et al., Reference Casteels, Ampe, Jacobs, Vaeck and Tempst1989). Coincidentally, previous work in our laboratory has confirmed that the recombinant AccApidaecin had significant antibacterial effects in vitro and on mice (Chen et al., Reference Chen, Wang, Liu, Zhang and Xu2019). In this study, we improved the larval basic diet to (i) identify a method of quantitative analysis of transcription in larvae and prepupae (adding bromophenol blue dye), and (ii) to improve the antibacterial ability of honey bees under indoor rearing conditions (adding recombinant AccApidaecin).
Materials and methods
Rearing honey bee larvae in vitro
First instar larvae (<24 h) in the hive maintained at the experimental apiary of Shandong Agricultural University (Tai'an, Shandong province, China) were placed into sterile 24-well tissue culture plates with 200 μl of larvae food per well. Plates were placed horizontally in a ‘humidor’ (a sealed storage box with 85% moisture, as shown in fig. 1a). Then larvae were reared in vitro in climate control chambers (34°C, approximately 85% RH during larval stages and 70% RH during the pupal stages) following the protocol conducted by Kaftanoglu et al. (Reference Kaftanoglu, Linksvayer and Page2015), and they were fed daily with fresh food. Upon defecation, larvae were transferred to 24-well plates covered with a pad where they prepared to enter the pupation stage. Figure 1a and Movie 1 show the process of in vitro larvae rearing.

Figure 1. Schematic diagram of test operation procedure. (a) Protocol for the in vitro rearing of honey bee larvae. (b) The production process of recombinant AccApidaecin.
Experimental diets
We modified the larval basic diet (CK) to (i) identify a method of quantitative analysis of transcription in larvae and prepupae [Blue basic diet (adding bromophenol blue dye)], and (ii) to improve the antibacterial ability of honey bees under indoor rearing conditions [S (adding the supernatant of recombinant AccApidaecin); BS (adding the bacteria solution of recombinant AccApidaecin)].
The diet for rearing larvae and the composition of the diet used in this experiment are shown in table 1. Bacillus subtilis (WB800N), used to express the recombinant AccApidaecin, was preserved in our laboratory (fig. 1b). Before feeding the larvae, the activated bacteria solution reached OD600 = 0.5, and then the isolated supernatant (S) and bacteria solution (BS) were fed according to the larval diet shown in table 1, where the concentration of AccApidaecin was ~20 mg l−1 (Chen et al., Reference Chen, Wang, Liu, Zhang and Xu2019). The 0.1% bromophenol blue dye was purchased from Solarbio (Beijing, China).
Table 1. Ingredients of artificial diets for rearing

Larvae fed with a basal diet (CK); blue basic diet: bromophenol blue staining solution was used to replace water in CK diet; S, the supernatant of recombinant AccApidaecin was used to replace water in CK diet; BS, the bacteria solution of recombinant AccApidaecin was used to replace water in CK diet.
Samples and specimens
Five larvae from each developmental stage (LS, fifth instar larva, cocoon-spinning phase; PP, fifth instar larva, prepupa; Pw, white-eyed pupa, unpigmented cuticle) were dissected in insect saline solution (0.1 M NaCl, 20 mM KH2PO4, 20 mM Na2HPO4) (Goncalves et al., Reference Goncalves, Fernandes, Santana, Martins, Zanuncio and Serrao2017) using ophthalmic tweezers and scissors, and their guts were removed and photographed under a stereomicroscope. The midgut of three of each stage of individuals were excised and prepared for transmission electron microscopy (TEM). The specimens for TEM were transferred to 2.5% glutaraldehyde in 0.1 M sodium cacodylate buffer for 4 h, and post-fixed in 1% osmium tetroxide in the same buffer for 2 h, following a bloc staining with 2% uranyl acetate overnight. Moreover, more stages (Pp, pink-eyed/pharate-adult transition; Pdp, dark pink-eyed pharate-adult, unpigmented cuticle; Pb, black-eyed pharate-adult, unpigmented cuticle; NE, newly emerged adult) of honey bee metamorphosis were used to record morphology or determine various indicators. Three midguts of NE were used for light microscopy, midguts were dissected as described above, and transferred to 4% neutral formaldehyde for 4 h, then dehydrated, embedded in paraffin, cut as 1–2 μm sections and stained with routine hematoxylin and eosin staining.
Determination of the fasting weight, birth weight, gut emptying time, and pupal development time
The excretion of uric acid crystals, which occurred when larvae were 6-day-olds, indicated pupation. Then larvae were weighted (fasting weight) with an electronic analytical balance and recorded the time point (fasting time). Gut emptying (GE) time is measured from the fasting time until the blue gut is not visible through the body wall of the abdomen. Strikingly, pupal development time in this study was the time from the larvae GE to become Pw, Pp, Pb, or NE. Birth weight was the weight of NE by using an electronic analytical balance.
Determination of the eclosion and pupation rates
The pupation rate was the ratio of the Pw number to 3-day-old larvae number, and the eclosion rate was the ratio of the NE number to Pw number.
Fluorescent real-time quantitative polymerase chain reaction (qRT-PCR)
Total RNA was extracted using the RNAiso Plus (TaKaRa, Dalian, China) according to the manufacturer's instructions, followed by RNasefree DNase I treatment. Single-stranded cDNA was synthesized using Evo M-MLV RT Premix for qPCR (Accurate Biology, China) at 37°C for 15 min, and followed by 85°C for 5 s. Then, PCR products were stored in −20°C.
qRT-PCR was carried out using the SYBR® Green Premix Pro Taq HS qPCR Kit (Rox Plus) (Accurate Biology, China). A 20 μl amplification reaction volume of the qRT-PCR contained 10 μl 2× SYBR® Green Premix Pro Taq HS Premix (Rox Plus), 5 μl double-distilled water, 2 μl cDNA, and 1 μl of each primer. The PCR procedure was as follows: (1) 30 s at 95°C for pre-denaturation, (2) 40 cycles of amplification (5 s at 95°C for denaturation and 30 s at 60°C for extension), and (3) a single melt cycle from 65 to 95°C. Relative expression of genes was analyzed with CFX Manager software (version 1.1), using the 2(−delta delta CT) method (Schmittgen and Livak, Reference Schmittgen and Livak2008) and amplification of the Actin transcript (gene ID: LOC108003299) was used as a sample control (Guidugli et al., Reference Guidugli, Nascimento, Amdam, Barchuk, Omholt, Simoes and Hartfelder2005). Six biological replicas were set for each treatment group, and the PCRs were performed in triplicate. The special primers of Apidaecin, Abaecin, Defensin1, Hymenoptaecin, SOD, CAT, and β-action gene are listed in table 2.
Table 2. PCR primers used in this study

Measurements of phenoloxidase (PO), lysozyme (LZM), and serine protease (PRSS) enzymatic activity levels
The total protein concentration was measured by using the Micro BCA Protein Assay Kit (CW2011S, CoWin Biosciences, China). The enzymatic activity levels of PO, LZM, and PRSS were detected by using the Enzyme Linked Immunosorbent Assay Kit (MEIMIAN, China). Subsequently, all the measurements were corrected by calibrating the total protein concentration.
Statistical analysis
All statistical analyses were performed with SAS (Version 9.1; SAS Institute Inc., Cary, NC, USA) and Prism (Version 9.0; GraphPad, La Jolla, CA). Values are presented as the mean ± standard error (SE) deviation for data that were normally distributed or median for data that were not normally distributed for continuous variables and number (%) for categorical variables. The consistency between two continuous variables was assessed using Pearson correlation analysis. For two-group comparison, P values were derived from the one-way Student's t test to determine differences between groups with normally distributed date. Data with normal distribution were analyzed by one-way analysis of variance with Tukey's correction for multiple comparisons. The values P < 0.05 were considered statistically significant. The different letters and * above bars denote significant differences between the treatment groups.
Results
Post-fasting changes of gut from larvae until pupae
We dissected the gut during the larval stage (~5 days) and the beginning of defecation until GE, and at 24 and 48 h after GE, and Pw (fig. 2). We defined the time of GE as 0 h, with ‘−’ representing the stage before GE and ‘ + ’ representing the stage after GE, to describe the time of gut maturity in different developmental stages. As can be seen from fig. 2, the gut morphology of honey bees was significantly different after GE, which was more similar to Pw. To further demonstrate the intimate aspects between gut development and metamorphosis, we analyzed the ultrastructure of the midgut. As shown in fig. 3a, at 0 h, the larva defecated empting the gut, the lumen of which collapses. At the same time, the epithelium collapsed, and the basal lamina was thick and folded. The cytoplasm of digestive cells was vacuolated, but the nucleus was intact. Some intact cells could be seen beside the vacuolated cells, and the microvilli almost disappeared. At +24 h, the muscle layer of midgut showed rupture of the degeneration of myofibrils, but cells with a clear cytoplasm and large nucleus (fig. 3c). The midgut of +48 h was undergoing epithelial replacement, and the degenerating cells were extensively vacuolated. The epithelium of the original larva is within the lumen, while the new epithelium is seen outside the lumen (fig. 3d). White-eyed pupae already had a reconstituted epithelial wall, in which digestive and regenerative cells were distinguishable (fig. 3e). In brown-eyed pupae, the midgut has adult-like epithelium and microvilli (fig. 3f). These results indicated that the development of the larval gut was closely related to the individual development stage.

Figure 2. Photographs of intact gut morphology from LS until Pw. The time marked in the figure defines the time point of GE as 0, before GE as −, and after GE as +. The intestinal morphology was recorded every 6–8 h from LS to GE and every 24 h from GE to Pw. The blue appearance of the gut was due to the addition of bromophenol blue dye in the diet. Due to the individual differences, these time points were for reference only. Pw, white-eyed pupa, unpigmented cuticle; GE, gut emptying.

Figure 3. TEM of the midgut wall. The time marked in the figure defines GE as 0, and after GE as +. (a, b) The larva defecated empting the gut, the epithelium collapsed, and the basal lamina was thick and folded. The cytoplasm of digestive cells was vacuolated, but the nucleus was intact. The microvilli almost disappeared and the cell division was shown (arrow). (c) The muscle layer of midgut showed rupture of the degeneration of myofibrils, but cells with a clear cytoplasm and large nuclei. (d) The midgut was undergoing epithelial replacement, and the degenerating cells were extensively vacuolated. (e) The midgut of Pw already had a reconstituted epithelial wall, in which digestive and regenerative cells were distinguishable. (f) Midgut epithelium from a Pb has adult-like epithelium and microvilli. Pw, white-eyed pupa; Pb, brown-eyed pupa; gc, group of regenerative cells; bl, basal lamina; mv, microvilli; v, vacuole; n, nucleus; ep, new epithelium; de, degenerating epithelium; l, lumen. The scale is shown in each diagram.
GE determined the transition from larva to prepupa
We then conducted quantitative analysis to explore the exact relationship between GE and the time point of larval metamorphosis. The larvae were fasted after defecation, and the time from fasting time to Pw was calculated (fig. 4a). The results showed that most of the fasted larvae would develop into Pw after 95–120 h. However, this time was much longer than the prepupal stage (about 72 h) of larvae in natural colonies. In other words, larvae reared indoors did not immediately enter the prepupal stage after fasting. After fasting, larvae continued to defecate, so we further counted the time from the time point of GE to Pw (fig. 4b), and found that most larvae developed into Pw at 70–75 h after GE, which was similar to larvae in natural colonies. However, the results in fig. 4c show that there were still many larvae deviating from the development process of natural colonies. We further calculated the GE time of larvae (fig. 4a), and found that it varied greatly among individual larvae, with a time span of 20–55 h; among them 73.1% emptied within 34 h, and the rest larvae took longer (fig. 4c). In order to investigate the individual factors affecting GE time, we calculated the fasting weight of larvae with different GE time, and found that those with a GE time <34 h weighed 160–180 mg; this was a proportion of >50% (fig. 4d, e). Correlation analysis of GE time and fasting weight of larvae showed that there was a negative correlation between the two (fig. 4f). Therefore, we concluded that when larval fasting weight was >160 mg, the time of GE can be defined as the critical point between the larval and prepupal stages and these larvae also developed more like those found in natural colonies.

Figure 4. Quantitative analysis of the exact relationship between GE and the time point of larval metamorphosis. (a) The time from fasting to GE and Pw, values are presented as the median for data. (b) The time from GE to Pw, values are presented as the median for data. (c) The proportion of different GE times; n, animal numbers. (d) Fasting weight range of individuals with different GE rates. (e) The proportion of fasting weight range in individuals with different GE rates. (f) Correlation analysis of the GE rate and fasting weight of individuals; n, animal numbers. Pw, white-eyed pupa, unpigmented cuticle; GE, gut emptying.
Effects of fasting weight on the development of pupae
Figure 5a-1, 2, and 3, respectively represent the larva with GE (0 h), +24 h, and +48 h, corresponding to Myster's previous description published in 1954 of larva age (Myster, 1954), the early, middle, and late stages of larval prepupae; 7 represents Pw; and 4, 5, 6 are three states show the gradual transformation to Pw. The previous results demonstrated that fasting weight affected the transition from larval to prepupal stage and pupal formation. We further explored whether fasting weight affected pupal development. Here, we selected three development stages within the pupal stage (Pw, Pp, and Pb); until NE these were the recorded time points (fig. 5d). Statistical analysis (df = 2; P > 0.05; and F = 2.42; 1.93; 0.83; 0.58) showed that there was no significant difference in interval of time length at each development time point for larvae in the three weight ranges. However, when the fasting weight of larvae was <160 mg, an interesting phenomenon was found: birth weight of new adults was positively correlated with fasting weight, as shown in fig. 6b, and the pupation rate was also higher (fig. 6a), with significant differences (df = 1; P < 0.05; and F = 8.22). Moreover, there was no such difference between the two groups with weight >160 mg. These results indicated that the fasting weight had no significant effect on pupal development of in vitro reared larvae, but the fasting weight should not be too low, otherwise it might affect the growth and development of new adults.
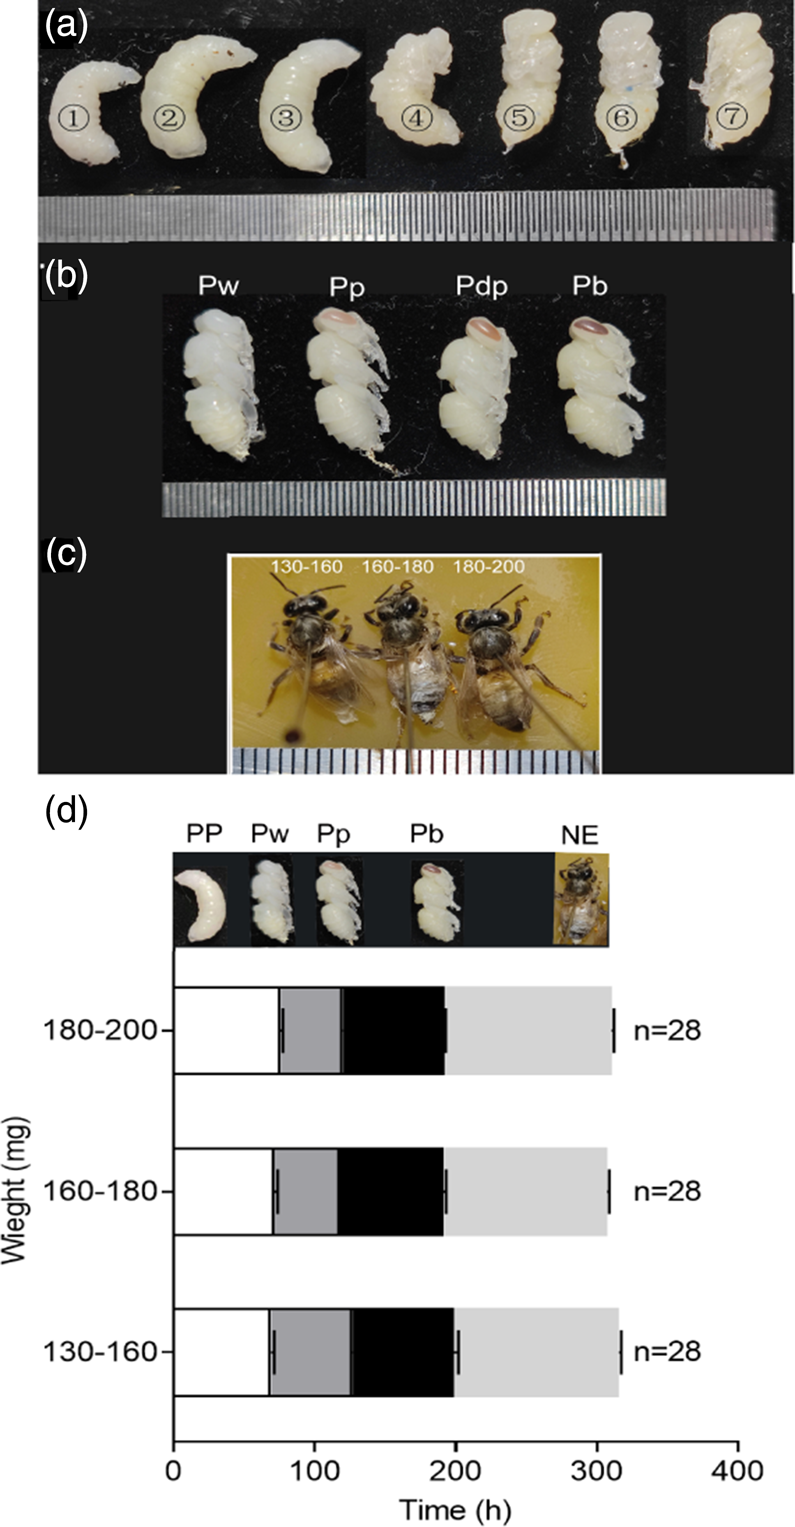
Figure 5. Development of larva after GE. (a) 1, 2, and 3 respectively represent the larva with GE (0 h), +24 h, and +48 h; 7 represents Pw; and 4, 5, and 6 are the transitional developmental state of the Pw. (b, c) Morphological records of honeybee pupa reared in vitro. The minimum scale of the steel ruler in the figure corresponds to 1 mm. (d) The development time of honey bees after GE in three fasting weight ranges. GE, gut emptying; PP, fifth instar larva, prepupa; Pw, white-eyed pupa; Pp, pink-eyed pupa; Pdp, dark pink-eyed pharate-adult, unpigmented cuticle; Pb, brown-eyed pupa; NE, newly emerged adult; n, animal numbers.

Figure 6. Statistics of pupation rate and eclosion rate under different treatments and analysis of the relationship between fasting weight and birth weight. (a) Statistics of pupation rate and eclosion rate under different treatments. 130–160, 160–180, 180–200, fasting weight range is 130–160 mg, 160–180 mg, and 180–200 mg; CK, basic diet group; S, basic diet plus the supernatant of recombinant AccApidaecin; BS, basic diet plus the bacteria solution of recombinant AccApidaecin. Results showed were compared with 160–180 or CK, respectively. (b) Linear correlation analysis of fasting weight and birth weight. n, animal numbers. * represents a significant difference between the two groups (P < 0.05).
Effects of recombinant AccApidaecin on antibacterial ability of honey bees
Using the above methods, we further investigated the effect of recombinant antimicrobial peptides on the antimicrobial activity of honey bees reared in vitro. Initially, we counted the pupation rate and eclosion rate of larvae fed with recombinant AccApidaecin and found that the pupation rate of the group fed S diet was significantly higher than that of CK (df = 1; P < 0.05; and F = 18.41) (fig. 6a); there was no significant difference in eclosion rate among the three groups (CK, S, and BS) (df = 1; P > 0.05; and F = 2.22; 0). We then examined the relative expression of the antimicrobial peptide genes (Apidaecin, Abaecin, Hymenoptaecin, and Defensin1) at various developmental stages (LS, PP, Pw, Pb, and NE) of honey bees fed with the recombinant AccApidaecin diet. Statistical analysis found that, at the beginning of fasting (LS), the expression of both antimicrobial peptide genes increased significantly in group S (P < 0.05) (fig. 7a–d). However, when the larvae emerged, the transcription levels of antimicrobial peptide genes were different from the levels at the beginning of fasting. As can be seen in fig. 7a–d, the expression of antimicrobial peptide genes was significantly higher in group BS than in the other two groups (P < 0.05).

Figure 7. Effects of recombinant AccApidaecin on antibacterial ability of honey bees. (a) The relative expression of Apidaecin; (b) the relative expression of Abaecin; (c) the relative expression of Defensin1; (d) the relative expression of Hymenoptaecin; (e) the relative expression of superoxide dismutase (SOD); (f) the relative expression of peroxidase, catalase (CAT); (g) the enzyme activity of PO; (h) the enzyme activity of LZM; and (i) the enzyme activity of serine protease (PRSS). LS, fifth instar larva; PP, fifth instar larva, prepupa; Pw, white-eyed pupA; Pb, brown-eyed pharate-adult; NE, newly emerged adult. CK, basic diet group; S, basic diet added the supernatant of recombinant AccApidaecin; BS, basic diet added the bacteria solution of recombinant AccApidaecin. Values are presented as the mean ± SE for data. The different letters above the data indicate significant differences (P < 0.05).
We also examined the activity of PO, LZM, and serine protease associated with the individual immunity of honey bees. Results showed that activities of the three enzymes had no obvious trend in each experimental group, and even showed a low activity of PO and LZM in newly emerged adult bees (fig. 7g–i). Finally, to detect whether exogenous AccApidaecin would cause a stress response in honey bees, we measured the relative expression levels of SOD and CAT. Our results showed that, compared with the larvae fed with the basal diet, both SOD and CAT transcription levels of NE in the BS group were significantly increased (P < 0.05) (fig. 7e, f). From the discussion above, it can be seen that feeding recombinant AccApidaecin can improve the antibacterial ability of honey bees; therefore, feeding larvae with the S diet is beneficial for larvae, whereas the BS diet is the more suitable for the adults.
Effects of recombinant AccApidaecin on gut of honey bees
Paraffin sections of the midgut of new adults showed that feeding the bees AccApidaecin in the gut peritrophic matrix thickness and density increased, and the vacuolation of midgut cells in the group S was clearly visible, but there was no obvious difference in morphology between the groups BS and CK (fig. 8).

Figure 8. Light microscopy of the midgut of new adult in A. mellifera. (a) The midgut of larvae fed with a basic diet (CK). (b) The midgut in the group S (larvae fed with the supernatant of recombinant AccApidaecin). (c) The midgut in the group BS (larvae fed with the bacteria solution of recombinant AccApidaecin) showing a close-grained epithelium and a thick PM. Ep, new epithelium; l: lumen; PM, peritrophic matrix; vacuolation, yellow triangle. CK, basic diet group; S, basic diet added the supernatant of recombinant AccApidaecin; BS, basic diet added the bacteria solution of recombinant AccApidaecin. All scale bars = 100 μm.
Discussion
For in vitro rearing of honey bee larvae, a standardized method must be used to determine the instar of the larvae. However, each instar that the larvae go through during development has a different duration, making it difficult for researchers to know the exact age of the larvae. Previous studies have shown that the development of head diameter (Rembold et al., Reference Rembold, Kremer and Ulrich1980), mouthparts, wing buds, leg buds, and gonadal prominences are useful parameters for determining an accurate age (Myser, Reference Myser1954). However, this labor-intensive technique can still cause honey bee populations to be out of sync at pupariation. The absence of accurate determination of larval and prepupal stages has made it difficult to study honey bee metamorphosis. According to previous studies on the development of the honey bee hindgut, the passage between the midgut and hindgut intestine is closed during the larval stage (Goncalves et al., Reference Goncalves, Fernandes, Santana, Martins, Zanuncio and Serrao2017), while in the prepupae, the passage opens (Dobrovsky, Reference Dobrovsky1951). Therefore, a simple solution to this problem is to feed larvae with the dye bromophenol blue, which is clearly visible in the gut and has no significant effect on development (Andres and Thummel, Reference Andres and Thummel1994).
We hypothesized that we could determine the time of the prepupal stage by looking at the timing of the arrival of the blue dye in the hindgut. However, we found that larvae do not enter the prepupal stage immediately after the opening of the passage, but need a transition time to continuously excrete waste from the body after fasting. Moreover, following dissection, we found that the gut of Pw resembled a transparent membrane, as shown in fig. 2. Next, we hypothesized that the larvae emptied their guts before moving on to the next stage of development. We measured the duration from the GE to Pw, and recorded the gut developmental trajectory after GE, compared with previous studies (Myster, 1954; Wang et al., Reference Wang, Ma and Xu2015). Our hypothesis was confirmed, as results showed that the larvae entered the prepupal stage after GE. In natural colonies, larval GE occurs on the first day after capping (just prior to LS). Therefore, we identified and confirmed that when larval fasting weight was >160 mg, the time point of GE was a critical point separating the larval and prepupal stages under conditions of rearing of honey bee larvae (Apis mellifera) in vitro.
The gut on the left of fig. 2 displayed a significant color difference between the midgut and hindgut, indicating that the channel between the two was indeed closed in the larval stage. When the passage between the midgut and the hindgut opens, the larvae defecate until it empties and enter the prepupal stage. Therefore, the opening of the passage between the midgut and hindgut of the larva occurs immediately before the prepupal stage. It follows that, in relation to a natural colony, the passage between the midgut and hindgut of the larvae opens up roughly at the time of capping. As to whether the in vitro reared larvae are inevitably different from those in natural colonies, a more systematic comparative study is needed, although the TEM results are similar to previous descriptions of worker midgut development during metamorphosis in natural colonies (Martins et al., Reference Martins, Neves, Campos and Serrao2006).
Another problem during the in vitro rearing of honey bee larvae is that they are highly susceptible to death from infection with bacteria. Because in the natural environment, honey bees employ group strategies to fight disease (Li et al., Reference Li, Zhao, Liu, Wang, Xu and Guo2018), once larvae are raised indoors they lose the protection of herd immunity. Therefore, it is necessary for larvae to enhance their individual antibacterial ability, whether in the natural colony or in the indoor environment. There are four families of antimicrobial peptides in honey bees, all of which are cationic peptides, named Apidaecin, Abaecin, Hymenoptaecin, and Defensin (DeGrandi-Hoffman and Chen, Reference DeGrandi-Hoffman and Chen2015). After pathogen invasion, antimicrobial peptide genes are activated, and antimicrobial peptides are produced in adipose bodies and blood cells, then secreted into body fluids to inhibit the growth of, or directly kill pathogens (El-Seedi et al., Reference El-Seedi, Ahmed, El-Wahed, Saeed, Algethami, Attia, Guo, Musharraf, Khatib, Alsharif, Naggar, Khalifa and Wang2022). The unique precursor structure enables the Apidaecin gene to be expressed rapidly after being stimulated by a very small number of pathogenic agents. The simple structure of the precursor gene of Abaecin enables the rapid and high expression of Abaecin as well as Apidaecin after pathogen invasion. However, compared with Apidaecin, the expression time of Abaecin is slightly later and requires a greater pathogen stimulation. Under physiological conditions, Hymenoptaecin can inhibit the growth of Gram-negative bacteria and a few Gram-positive bacteria; the minimum inhibitory concentration is lower than that of other antimicrobial peptides, and it can significantly inhibit strains that are resistant to Apidaecin. Additionally, compared with the other three antimicrobial peptides in body fluids, Defensin can only be expressed in small amounts after a relatively high pathogen stimulation, and only begins to be expressed after 12 h of stimulation; however, Defensin can be expressed in a constant flow after 24 h of stimulation (Casteels et al., Reference Casteels, Ampe, Jacobs, Vaeck and Tempst1989, Reference Casteels, Ampe, Riviere, Van Damme, Elicone, Fleming, Jacobs and Tempst1990, Reference Casteels, Ampe, Jacobs and Tempst1993; Casteels-Josson et al., Reference Casteels-Josson, Zhang, Capaci, Casteels and Tempst1994). The latter study provided evidence supporting a statement that Apis cerana cerana contains more antimicrobial peptides and genes than A. mellifera, and explains that this may be owing to the genetic degradation of A. mellifera after long-term domestication (Xu et al., Reference Xu, Shi and Chen2009).
Previously, our laboratory successfully induced the expression of AccApidaecin using B. subtilis (Chen et al., Reference Chen, Wang, Liu, Zhang and Xu2019). Since B. subtilis is a probiotic, we attempted to directly feed it to larvae expressing AccApidaecin and explore whether the exogenous expression of Apidaecin could enhance individual honey bee immunity. Recombinant AccApidaecin was expressed extracellularly, so it was collected in the supernatant of B. subtilis. Therefore, we adopted the two diets of S and BS used in vitro larval rearing technology to conduct related studies. Statistical analysis found that the expression of the studied genes (Apidaecin, Abaecin, Hymenoptaecin, and Defensin1) was increased significantly in group S at the beginning of fasting (LS) (P < 0.05), which may be owing to the larval gut not emptying and the presence of large amounts of AccApidaecin in vivo. Then the larvae detected an increase in homologous Apidaecin and stimulated the expression of other antimicrobial peptide genes in the body. However, when the larvae emerged, the transcription level of antimicrobial peptide genes differed from the beginning of fasting. As can be seen in fig. 7a–d, the expression of antimicrobial peptide genes was significantly higher in the group BS than in the other two groups (S and CK) (P < 0.05). We hypothesized that AccApidaecin in the supernatant was excreted with the emptied gut, and that a small amount of B. subtilis with AccApidaecin might have colonized the gut. Furthermore, the continuous expression of Apidaecin also stimulated the expression of other antimicrobial peptide genes. In view of this, feeding the S diet was beneficial for larvae, but the BS diet was the most suitable food for adults.
In addition to antimicrobial peptides, PO and three LZMs are the major effectors of the main effectors of immune-related Toll pathways in the honey bee (DeGrandi-Hoffman and Chen, Reference DeGrandi-Hoffman and Chen2015). The activity of PO was not detected in larvae at 1 or 2 days of age, but increased significantly thereafter (Chan et al., Reference Chan, Melathopoulos, Pernal and Foster2009). The main known function of LZM is to degrade the peptidoglycan shell of Gram-positive bacteria, thus playing a role in immune defense. In addition, serine protease and its homolog are closely related to hemolymph homeostasis and antimicrobial peptide synthesis. They participate in the activation of intracellular prophenoloxidase and the Toll immune signaling pathway, so they play an important role in humoral immunity of insects (Ligoxygakis et al., Reference Ligoxygakis, Pelte, Hoffmann and Reichhart2002; El Chamy et al., Reference El Chamy, Leclerc, Caldelari and Reichhart2008; Amparyup et al., Reference Amparyup, Charoensapsri and Tassanakajon2013; Lu et al., Reference Lu, Zhang, Zhang, Yang, Wu, Xie, Luan and Ling2014; DeGrandi-Hoffman and Chen, Reference DeGrandi-Hoffman and Chen2015). Our results indicated that activities of the three enzymes had no obvious trend in variation in each group; however, low activity was noted in newly emerged adults (fig. 7g–i). The midgut morphology of the new adults was not significantly affected by the addition of recombinant AccApidaecin (fig. 8). Combined with the previous analysis of antimicrobial peptide gene expression, we speculated that B. subtilis was not harmful to bees and could not fully stimulate the immune defense mechanism. Although the antimicrobial peptide gene was highly expressed, no real pathogenic bacteria invaded the body, the immune system was in a silent state, and the immune-related enzymes had low activity.
In order to reduce and prevent reactive oxygen species (ROS) damage, insects have formed a complex oxidative stress mechanism, which can scavenge excessive ROS through enzymes such as superoxide dismutase (SOD), peroxidase, catalase (CAT), and non-enzymatic scavenging systems such as glutathione peroxidase, ascorbic acid, and carotene (McDermott et al., Reference McDermott, Millar and Piper1993; Balieira et al., Reference Balieira, Mazzo, Bizerra, Guimarães, Nicodemo and Mingatto2018). The daily living environment places both larvae and adults under constant stress. SOD and CAT are widely found in insects and are the most common indicators of antioxidant capacity (Millar et al., Reference Millar, Weis, Piper, Weber, Borchard, Mcdermott and Balasubramaniam1991; McDermott et al., Reference McDermott, Millar and Piper1993; Balieira et al., Reference Balieira, Mazzo, Bizerra, Guimarães, Nicodemo and Mingatto2018). Therefore, we measured the gene expressions of SOD and CAT to detect whether the exogenous addition of AccApidaecin would cause a stress response in honey bees. Our results showed that the gene expression of SOD and CAT in the pupal stage did not significantly increase after fasting (P > 0.05), indicating that feeding AccApidaecin to the larvae does not lead to a stress response in honey bees (fig. 7e, f). However, gene expression was significantly increased in newly emerged adult bees (P < 0.05), suggesting that the high expression of antimicrobial peptide genes may induce the expression of individual antioxidant genes; a process called stress adaptation.
Conclusions
In this study, we identified and confirmed that when larval fasting weight was >160 mg, the time point of GE was a critical point separating the larval and prepupal stages under conditions of rearing of honey bee larvae (A. mellifera) in vitro. Moreover, adding recombinant AccApidaecin to the diet improved the antibacterial ability of honey bees without stimulating a stress response. These results will help us to develop healthier and more natural workers in laboratory conditions, facilitating the study of honey bees as a model organism.
Supplementary material
The supplementary material for this article can be found at https://doi.org/10.1017/S0007485323000020
Acknowledgments
This work was funded by the special funds for the Efficient Ecological Agriculture Innovation Project of the Taishan Industry Leading Talent Program (No. LJNY202003), the National Natural Science Foundation of China (No. 32272937) and the earmarked fund for China Agriculture Research System (CARS-44). And we thank the apiary manager Mr Li for his help and guidance.
Author contributions
B-HX and H-FW conceived this research and designed experiments. YW and Z-GL performed experiments and analysis. W-FC and H-FW contributed significantly to writing. All authors read and approved the final manuscript.


