


Introduction
Firms compete in their market environment. Their market successes depend on their products and services, efficiency in operations, internal organization, the organization of supply chains, distribution channels, and alliance networks. Firms with well-formulated market strategies around such components could still fail due to other nonmarket factors. Firms’ public affairs and governmental relations are the illustrations of nonmarket attributes that may affect business performance. It is thus essential for firms to develop not only market but also nonmarket strategies and integrate them to succeed and sustain their long-term market positions (Baron, Reference Baron1995).
The significance of nonmarket strategy coincides with the increasing consumer attention to social and environmental issues, including climate change. As the defining issue of our time, climate change pushes firms into a highly uncertain, unpredictable business environment. Firms face several forms of climate risks. Changes in the climate system, such as sea-level rise, wildfires, or extreme weather events, lead to physical risks to firms and cause financial losses. Regulatory risks also challenge firms because, in many parts of the world, climate policies that would affect firms' market stances have not yet been fully established or implemented (Helm, Reference Helm2008; Boiral et al., Reference Boiral, Henri and Talbot2012; Kim and Darnall, Reference Kim and Darnall2016; Bodle et al., Reference Bodle, Donat and Duwe2016).
Against this backdrop, firms are becoming strategic in their responses to climate change. Prior scholarship in business and climate change has indicated the variance of firms’ strategic climate actions. Some firms took market-oriented steps to reduce carbon emissions, while other firms deeply engage in climate policy making without genuine commitments (Boiral et al., Reference Boiral, Henri and Talbot2012; Böttcher and Müller, Reference Böttcher and Müller2015; Doda et al., Reference Doda, Gennaioli, Gouldson, Grover and Sullivan2015; Ernst & Young, 2010; Falkner, Reference Falkner, Ougaard and Leander2010; Jeswani et al., Reference Jeswani, Wehrmeyer and Mulugetta2008; Kolk and Pinkse, Reference Kolk and Pinkse2007; KPMG, 2008; NRG Energy, 2019). Interestingly, a subset of firms emerges with the proactive market and nonmarket strategies toward climate change. For instance, NRG Energy, Inc. has substantially invested in low-carbon management practices. Its practices include improving energy efficiency at existing thermal plants and promoting renewable-based electricity generation. The company also publicly supported the 2015 Paris Agreement, and its policy support has not wavered even with the Trump administration's withdrawal from the treaty (NRG Energy, 2019). As another example, BP has reduced its facility-level carbon emissions with a wide array of carbon-reducing projects, including the Advancing Low Carbon Accreditation Programme. Along with its push to a low-carbon pathway, BP has advocated carbon tax as a carbon pricing mechanism (Plumer, Reference Plumer2020). Such firms’ market and nonmarket responses are noteworthy because firms have been typically less cooperative to regulatory approaches to environmental policies (Kamieniecki, Reference Kamieniecki2006; Kim and Darnall, Reference Kim and Darnall2016) or greenwashers (Lyon and Maxwell, Reference Lyon and Maxwell2011; Lyon and Montgomery, Reference Lyon and Montgomery2015). Accordingly, it is critical to know what leads firms to take both market and nonmarket strategies in a harmonious, sociopolitically progressive way.
Prior researchers found that firm-level, industrial, and institutional factors could drive firms’ responses to climate change (Jones and Levy, Reference Jones and Levy2007; Pinkse and Kolk, Reference Pinkse and Kolk2009; Pinkse and Kolk, Reference Pinkse and Kolk2010; Weinhofer and Hoffmann, Reference Weinhofer and Hoffmann2010; Kim and Darnall, Reference Kim and Darnall2016). However, the scholarship is lacking in two ways. First, nonmarket strategy is insufficiently understood when compared to market strategy, and firms’ motives for engaging in their nonmarket environment have been relatively unknown. It is also unclear if firms attempt to integrate market and nonmarket strategies to address the complex social and environmental issues holistically. This study fills this research gap by drawing on a novel dataset of the US S&P 500 firms’ responses to climate change. It relies on the resource-based view and posits that firms’ organizational resources and capabilities underlying market strategy are related to their policy support, one of the nonmarket strategies. In employing the two-step econometric modeling technique to address endogeneity, this study found the positive relationship as the first kind of empirical evidence.
This study contributes to the research stream of integrated market and nonmarket strategies. Concerning climate change, firms face high-level business risks and regulatory uncertainty. Integrated market and nonmarket strategies could help the long-term prospect of firms’ competitive advantage be more realistically achieved. However, many firms do not engage in public discussions for climate policy making in part due to their negative views of nonmarket strategy as a cost or an institutional constraint on firms (Scott, Reference Scott2001; Oliver and Holzinger, Reference Oliver and Holzinger2008). Indeed, firms’ efforts for regulatory policy development have a public good property, which could discourage firms’ nonmarket actions. Consequently, many firms may forgo an opportunity to configure political resources like reputation as good corporate citizens, access to policy makers, or information that may provide a competitive advantage during the policy-making process (Baron, Reference Baron1995, Reference Baron2001; Bonardi and Urbiztondo, Reference Bonardi and Urbiztondo2013). However, by outwardly supporting regulatory policy and forging relations with policy makers, firms may secure and sustain a competitive advantage that otherwise would not have been achieved. This would be particularly true when market opportunities are more controlled by governments instead of markets (Baron, Reference Baron1995).
Antecedents of firms’ support for mandatory policy
Scholars in management science have examined the antecedents of firms’ nonmarket strategy with the resource-based view (RBV). The theoretical framework helps explain firms’ response to the external environment from an organizational perspective (Barney, Reference Barney1991). According to the framework, firms actively engage in a political environment, relying on their organizational resources and capabilities. They tend to influence regulatory or legislative processes to gain competitive advantage (Buchanan et al., Reference Buchanan, Tollison and Tullock1980; Hillman and Hitt, Reference Hillman and Hitt1999; Hillman et al., Reference Hillman, Keim and Schuler2004; Keim and Baysinger, Reference Keim and Baysinger1988; Schuler, Reference Schuler1996; Shaffer, Reference Shaffer1995) or to offset or remove competitive disadvantage (McWilliams et al., Reference McWilliams, Van Fleet and Cory2002). Some firms would choose not to engage in public discourses, taking inactive stances (Scott, Reference Scott2001; Oliver and Holzinger, Reference Oliver and Holzinger2008; Kim and Darnall, Reference Kim and Darnall2016).
Not all resources and capabilities potentially are related to nonmarket strategies. Scholars found that, among resources, firms’ size, slack resources, diversification level, dependency on government, or age would attribute to firms’ nonmarket strategy (Hillman et al., Reference Hillman, Keim and Schuler2004; Keim, Reference Keim2001; McWilliams et al., Reference McWilliams, Van Fleet and Cory2002). Some scholars have focused on firms’ capabilities, which are capacities to deploy resources, usually in combination, to integrate the performance of tasks or activities (Amit and Schoemaker, Reference Amit and Shoemaker1993; Sharma and Vredenburg, Reference Sharma and Vredenburg1998; Christmann, Reference Christmann2000; Teece et al., Reference Teece, Gary and Shuen1997; Darnall and Edwards, Reference Darnall and Edwards2006). Examples include firms’ scanning and predictive capabilities or structural and process reconfiguration abilities (Oliver and Holzinger, Reference Oliver and Holzinger2008). The combination of resources and capabilities for managing a political environment can result in variations in nonmarket strategies (Oliver and Holzinger, Reference Oliver and Holzinger2008; Kim and Darnall, Reference Kim and Darnall2016).
Despite such existing knowledge, there is limited understanding about the role of organizational resources and capabilities underlying market strategy on firms’ nonmarket strategy. Bonardi and Urbiztondo (Reference Bonardi and Urbiztondo2013) contend that firms may “freeze economic assets” to create political resources rather than invest in political tactics such as campaign contributions or hiring lobbyists, in which firms would not grow political resources inside them. Asset freezing is a business action whereby a firm sacrifices profits to increase its bargaining power vis-à-vis policy makers. Some exemplary practices involve adopting politically friendly technologies or investing in a project that would not have been chosen unless politics had not been factored into it. While asset freezing would come at higher costs than traditional nonmarket strategic actions, it may help firms develop resources with high political value and thus lawfully influence public policy making (Bonardi and Urbiztondo, Reference Bonardi and Urbiztondo2013). In doing so, a firm's business strategy would be more effective and integrative (Baron Reference Baron1995), enhancing a fit between a firm's economic actions and public policy requirements.
In the context of climate change, forming and undertaking market-based carbon management practices would be regarded as asset freezing. Firms with asset freezing would be more likely to build organizational resources and capabilities that could be useful for their engagement in climate policy making. Figure 1 illustrates organizational resources and capabilities underlying market-based carbon actions.

Figure 1: Integrated strategy analysis through the development of organizational resources and capabilities underlying market strategy.
Response to climate change: Market and nonmarket strategies
Firms’ responses to climate change have been either market- or non-market-based. Market-based carbon activities can be classified into three different carbon management strategies, depending on the time horizons of strategic decisions. The three approaches are carbon compensation, carbon reduction, and carbon independence (Weinhofer and Hoffmann, Reference Weinhofer and Hoffmann2010). Carbon compensation strategy refers to a company's actions focusing on carbon offsets for a short-term period. Firms choosing this strategy may acquire carbon permits from emissions trading schemes in operation or invest in carbon offset projects. Carbon reduction strategy relates to a firm's longer-term carbon-reducing initiatives and practices. The strategy leads firms to improve carbon performance from existing production processes or products or develop low-carbon products. Carbon independence, the most advanced strategy, relates to a firm's considerations for carbon removals for an even longer time horizon. The exemplary carbon independence actions involve renewable-based business operation or zero-carbon product development (Weinhofer and Hoffman, Reference Weinhofer and Hoffmann2010).
A firm's nonmarket strategy is a concerned pattern of actions taken in the nonmarket environment to create value by improving its overall performance. The nonmarket environment includes those interactions that are intermediated by the public, stakeholders, government, the media, and public institutions (Baron, Reference Baron1995). Under the circumstances where nonmarket environments are highly influential to a firm's financial performance, a business strategy may be more effective if the market and nonmarket components in the strategy are integrated (Baron, Reference Baron1995).
Related to climate change, firms have developed different nonmarket strategies, including taking a sociopolitically supportive stance, especially when the regulatory environment is uncertain and uneven across the board (Weinhofer and Hoffman, Reference Weinhofer and Hoffmann2010). For instance, Entergy, DuPont, Alcoa, NRG Energy, and BP have vouched for mandatory climate policy. However, most firms appear to be inactive in the nonmarket environment or join voluntary carbon reduction programs to avoid compulsory regulatory schemes (Kim and Darnall, Reference Kim and Darnall2016).
The firm's market-based actions have shown variances, combining carbon compensation, carbon reduction, or carbon independence strategies. Among them is an investment in carbon offset projects or participation in emissions training schemes, process or product enhancement for carbon control, and development of units for climate affairs. Once firms manage carbon emissions in such ways, they would be more likely to redefine organizational routines; change corporate culture; develop technical and managerial capabilities to monitor, measure, report, and verify carbon emissions; and reengineer their current business operations for climate affairs (Weinhofer and Hoffmann, Reference Weinhofer and Hoffmann2010). As such, firms with market-based carbon actions would be more likely to support mandatory climate policy to leverage their investments in carbon management. The hypothesized relationship between each carbon-reducing practice and firms’ supportive policy stance is presented in the following text.
Active engagement in emissions trading
Carbon emissions trading is one of the central mechanisms for climate mitigation. It was first introduced under the Kyoto Protocol, and it has been promoted due to the successful design and operation of the US acid rain program that was developed to reduce sulfur dioxides from power plants (Bestill and Fiske, Reference Bestill, Fiske, Axelrod and Vandeveer2020). Currently, more than twenty emissions trading systems (ETS) are in force, and a notable example of emissions trading is the EU Emissions Trading Scheme (EU-ETS). The EU-ETS began in 2005 to reduce carbon emissions from around 11,000 installments in energy-intensive industries after witnessing that a well-designed emissions trading system can significantly reduce compliance costs compared to the command-and-control approach (Ellerman and Joscow, Reference Ellerman and Joscow2008; ICAP, 2019). Emissions trading has been at the core of many climate policy proposals across the world (Arimura et al., Reference Arimura, Burtraw, Krupnick and Palmer2007; Aldy and Pizer, Reference Aldy and Pizer2008; ICAP, 2019), and in the United States, emissions trading has been part of climate mitigation policy portfolios due to expected political resistance to carbon taxes (Stavins, Reference Stavins2007; Aldy et al., Reference Aldy, Krupnick, Newell, Parry and Pizer2009).
Firms in emissions trading would opt to buy or sell carbon permits, depending on their surveyance of marginal abatement costs. To figure out the best course of action in trading, firms would then measure, monitor, and track their carbon emissions. At the planning and monitoring stage, firms can acquire tacit knowledge essential for emissions monitoring (Malmborg and Strachan, Reference Malmborg and Strachan2005). Firms may decide to change their daily routines and shift their corporate culture that would be rewarded in a future carbon regulatory environment (Hoffman, Reference Hoffman2005). Firms may also develop sophisticated bidding strategies in response to fluctuations in carbon market prices (DEFRA, 2002), enhancing organizational coordination between environment and finance departments (Vis, Reference Vis and Delbeke2006). The knowledge-based processes, corporate culture, and capabilities for continuous improvement and higher-order learning could be a competitive advantage and sustained over the longer term if mandatory climate policy is adopted. Therefore, firms that developed organizational resources and capabilities underlying their emissions trading experience may be more likely to get involved in their nonmarket environment and support mandatory climate policy.
Hypothesis 1: The greater the degree to which a firm develops organizational resources and capabilities underlying its emissions trading experience, the greater the likelihood that the firm would support mandatory climate policy, as compared to oppose or take an inactive stance.
Process improvement and product development for carbon reduction
Following the manufacturing cycle, firms can decarbonize by improving processes and innovating products. Firms operating procedures can be enhanced while readily reducing carbon emissions by increasing energy efficiency (Kolk and Pinkse, Reference Kolk and Pinkse2004, Reference Kolk and Pinkse2007). Examples of process improvements for carbon reduction include adopting simple housekeeping measures, utilizing renewable energy, materials, and heat wastes recycling, and employment of cutting-edge low-carbon technologies. Such processes would promote organizational learning as to how their industrial systems and operations relate to carbon emissions. By assessing energy consumption patterns and their related carbon emissions, firms can identify operational inefficiencies and existing processes that require modification and optimize materials usage (Frosch and Gallopoulos, Reference Frosch and Gallopoulos1989). Process-related carbon reductions would also require firms to continually improve carbon management practices while facilitating organization-wide changes and perpetual improvement of their internal operations (Falk, Reference Falk2002). For instance, Alcoa, the US aluminum manufacturing company, annually reduced its energy costs by 5–10 percent, as the company continually assessed carbon reduction potentials and improved aluminum smelting operational efficiencies (USDOE, 2004).
The development of low-carbon products, such as biofuels, biomaterials, and hybrid-engine cars, can help firms cultivate their ability to design for the environment and acquire their knowledge of the green market and consumers. Firms may also collaborate with internal and external stakeholders for product developments, enhancing organizational capacities for higher-order learning, cross-functional integration, and stakeholder engagement (Sharma and Vredenburg, Reference Sharma and Vredenburg1998; Verona, Reference Verona1999; Hoffman, Reference Hoffman2005; Kolk and Pinkse, Reference Kolk and Pinkse2004). Once firms have improved operational processes by removing material and energy inefficiencies or have designed products that can lower carbon emissions, they may be better positioned for a low-carbon economy (Holdren, Reference Holdren2006). However, firms’ competitive advantage, driven from process improvements and product developments to reduce carbon emissions, would be constrained in a society where mandatory climate policy has not been in place. Consequently, firms that implement low-carbon process improvements and product developments are more likely to engage in their nonmarket environment and support mandatory climate policy.
Hypothesis 2: The greater the degree to which a firm develops organizational resources and capabilities underlying its process and product improvements for carbon reductions, the greater the likelihood that the firm would support mandatory climate policy, as compared to oppose or take an inactive stance.
Corporate climate governance bodies
The rise in climate change salience has prompted some firms to create structural units (such as a dedicated board or team) to take the overall responsibility for managing organizational carbon emissions. The organizational structure may take different forms of governance. For instance, some firms may utilize already executive bodies such as an Environment, Health, and Safety Department, while others may form specific teams or departments dedicated to climate change that may promote cross-functional cooperation for actual carbon reductions (Carbon Disclosure Project, 2008). Regardless of the structural format, climate governance bodies would help firms support mandatory climate policy for the following two reasons.
First, once climate governance bodies are in place, they would be more likely to engage with specific actors dedicated to climate issues and tasked with identifying solutions, packaging them as attractive, and selling them to the organization's decision makers (Andersson and Batemen, Reference Andersson and Bateman2000). That means, they would assess a firm's carbon management issues, gather information about carbon-reducing technologies and best practices, and identify carbon-reducing opportunities. Climate governance units would then implement the initiatives and programs to improve the carbon efficiency of manufacturing processes and develop low-carbon products. In doing so, the firm would build organizational resources and capabilities underlying the market strategy, reputation, and information that would prevail in negotiations during policy making. Firms with the organizational resources and capabilities would sense that they would be better positioned in a carbon regulatory environment, thereby being more likely to engage in a nonmarket environment and support mandatory climate policy than others lacking the dedicated governance units.
Second, climate governance bodies would bring greater organizational congruence to firms. Organizational congruence is defined as the degree to which the needs, demands, goals, objectives, and/or structures of one organizational component are consistent with those of another (Nadler and Tushman, Reference Nadler, Tushman, Nadler, Gerstein and Shaw1992). With climate governance bodies, firms would facilitate carbon management across all organizational functions. They may integrate climate change into strategic planning processes. The enhanced organizational congruence would then result in firms’ internal capabilities to reduce carbon emissions more effectively, which would in turn lead to firms’ support for climate change policy. For these reasons, companies that built organizational resources and capabilities underlying the establishment of corporate climate governance bodies would be more likely to engage in their nonmarket environment and support mandatory climate policy.
Hypothesis 3: The greater the degree to which a firm develops organizational resources and capabilities underlying the development of climate affairs units, the greater the likelihood that the firm would support mandatory climate policy, as compared to oppose or take an inactive stance.
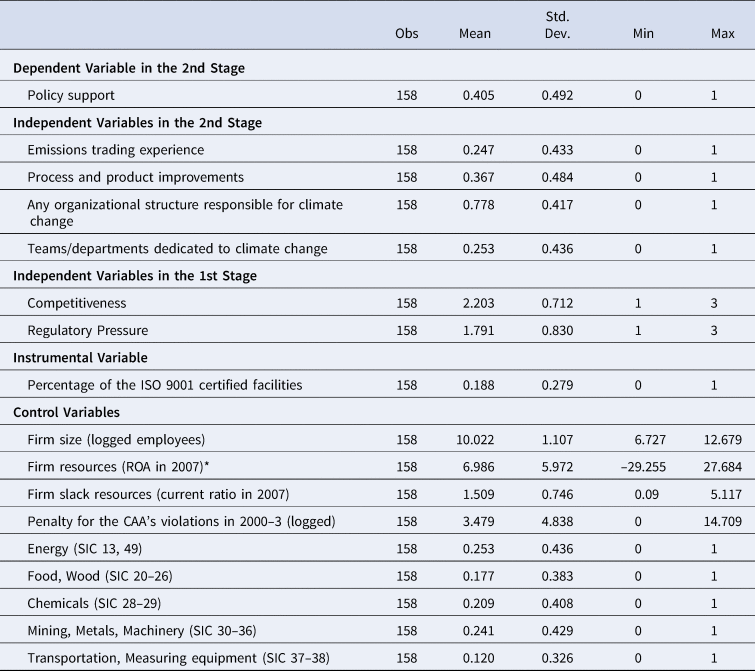
Figure 2 illustrates the relationship between organizational resources and capabilities underlying carbon management practices and their support for mandatory climate policy.
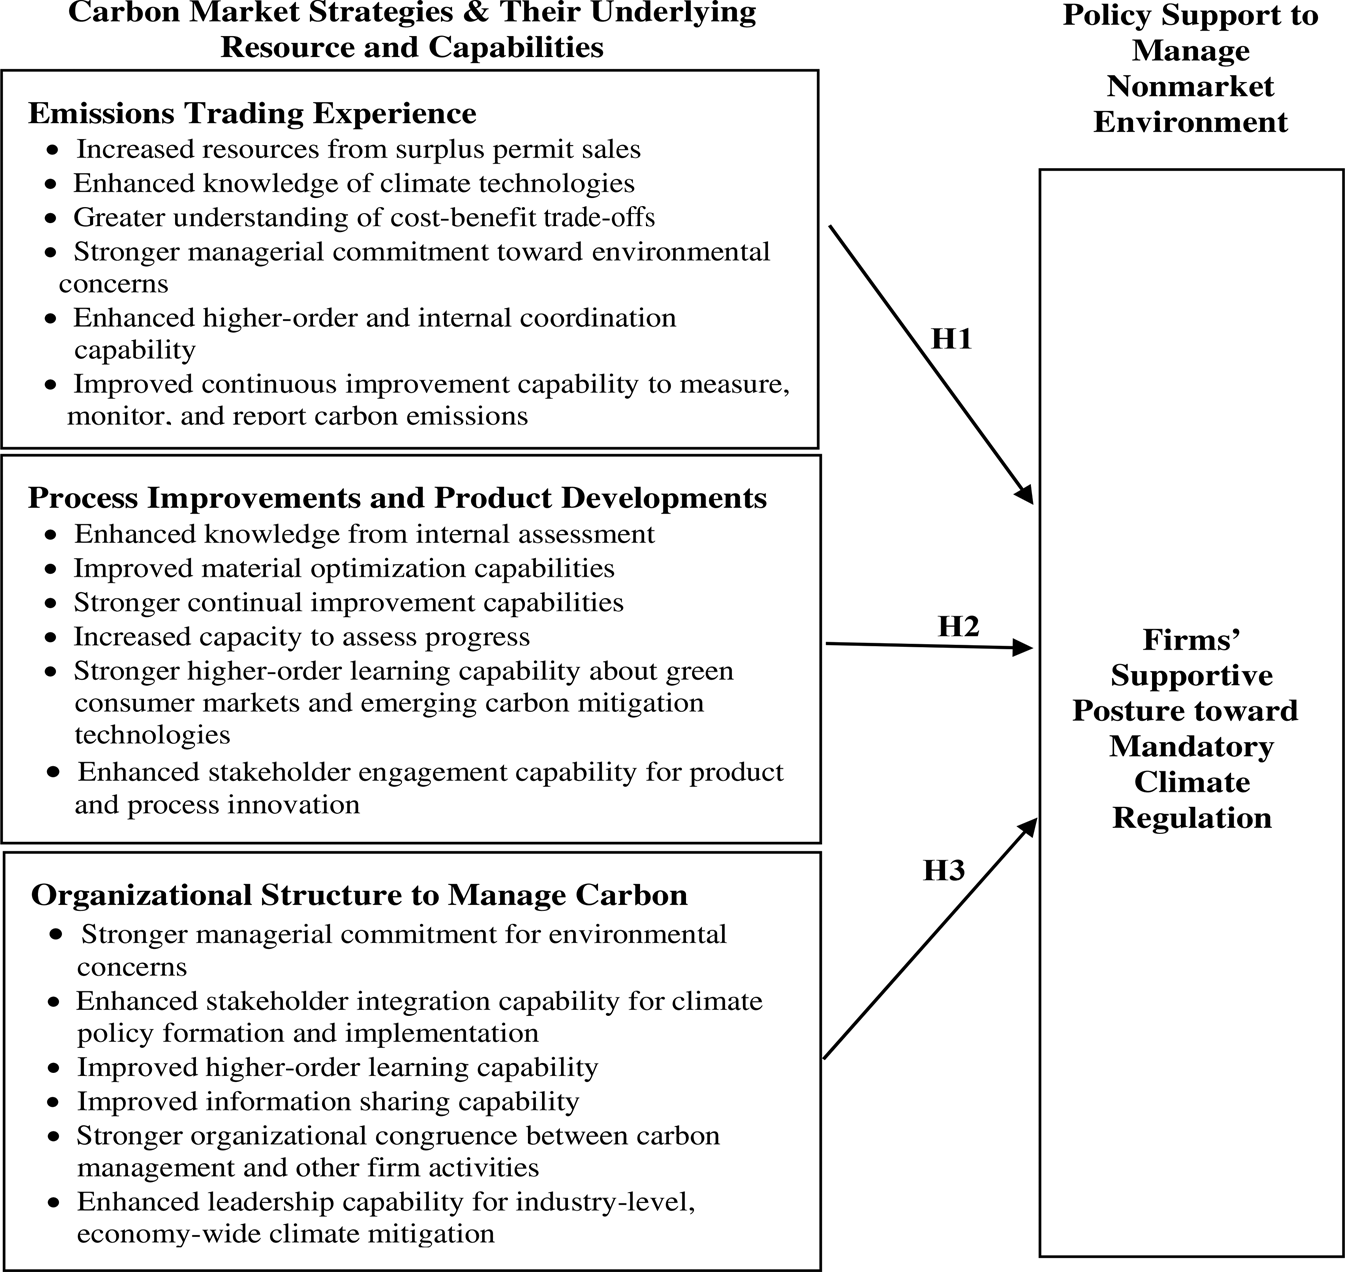
Figure 2: Relationship between firms’ carbon market strategies, the resources and capabilities that underlie them, and the supportive posture toward mandatory climate regulation to manage nonmarket environment.
Research methods
Data and sample
To empirically test the relationships of interest, this study relied on the Carbon Disclosure Project (CDP) data for the US S&P 500 firms. CDP is a coalition of around 590 institutional investors with a combined asset base of more than US $110 trillion and has asked companies to disclose their environmental impact by using investors and customers’ power. Climate change is one of the key issues that CDP focuses on, and CDP has surveyed firms’ market and nonmarket responses to climate change since 2003. The questions cover four principal areas: (1) risks and opportunities of climate change for companies; (2) actual greenhouse gas emissions data; (3) technologies, products, and processes or services that companies develop or apply in response to climate change; and (4) corporate governance and policy engagement with regard to climate change. With such information, CDP data provide a comprehensive overview of firms’ carbon strategies to date (CDP, 2021).
In 2008, the CDP sent its questionnaire to more than 3,000 companies, including the US S&P 500 firms, and received 1,550 responses. This study focuses on S&P 500 firms’ responses to CDP in 2008, and there are two reasons for this approach. First, scholars suggest that firms’ carbon management practices and their policy responses have been more visible in larger firms than smaller or more medium-sized firms (Kolk and Pinkse, Reference Kolk and Pinkse2007; Wickert, Reference Wickert2016). Thus, S&P 500 companies representing about 75 percent of the American equity market would be a suitable population to predict the hypothesized relationships. Second, the year 2008 is more than optimal to observe firms’ heterogeneous policy posture since the US 110th Congress had actively debated climate change legislative proposals in 2007 and 2008 (Aldy and Pizer, Reference Aldy and Pizer2008). Firms’ policy responses in 2008 were dynamic and visible (Jones and Levy, Reference Jones and Levy2007).
The response rate was 64.2 percent, as 321 companies out of the S&P 500 firms submitted their answers to the CDP. Of the respondents, 243 companies elected public disclosure of their submitted data. The remaining 78 firms provided their information only to the institutional shareholders CDP represented (CDP, 2008). Among 243 publicly available answers, firms in energy-intensive industries or firms with manufacturing facilities are selected to empirically test the relationship between firms’ carbon reductions in industrial processes and their policy posture in hypothesis 2. As a result, the final sample included 158 companies in oil and gas (SIC 13); utility (SIC 49); food, wood, paper, and printing products (SIC 20–27); chemical, petroleum, rubber, and plastic products (SIC 28–30); machinery and electronic equipment (SIC 33–36); and transportation equipment (SIC 37–38).
With respect to climate policy, this study focuses on proposed climate legislation or regulations that would include market-based instruments. Indeed, as shown in the 109th Congress and the first session of the 110th, many climate legislation proposals had included nationwide carbon reduction goals and allocation programs for carbon allowances (Arimura et al., Reference Arimura, Burtraw, Krupnick and Palmer2007; Aldy and Pizer, Reference Aldy and Pizer2008). The 2008 CDP responses were collected during the 1st session of the 110th Congress. It should be noted that around 2008, the firms were under economic meltdown, but evidence suggests that firms’ overall sustainability strategy was not withdrawn or retreated even with economic constraints (Barnett et al., Reference Barnett, Darnall and Husted2015).
Measures for assessing firms’ policy support
Dependent variable
The dependent variable, firms’ support for mandatory climate policy, was measured using the CDP data. Firms’ sustainability reports or websites, press release materials, or media coverage were also examined. In the CDP survey, companies were asked, “Do you engage with policymakers on possible responses to climate change including taxation, regulation and carbon trading?” (CDP Question 4(d)). While the question did not directly ask whether a firm prefers (or against) mandatory climate policy, most firms revealed their posture toward mandatory climate policy by answering the open-ended question. For instance, “Firm X supports the idea of emissions trading programs because these programs have proven to be effective,” and “Firm Y supports a comprehensive, economy-wide, market-based cap and trade to reduce carbon emissions.”
Responses were coded “not supportive” = 0, “supportive” = 1, respectively. A test of interrater reliability was performed to assess the consistency of implementing a rating system. In the test, twelve researchers were asked to code randomly selected firms’ policy posture. This interrater reliability analysis assesses the degree to which different raters give consistent estimates of a categorical variable. Cohen's kappa coefficient, a function of the ratio of agreements to disagreements in relation to expected frequencies, is commonly used (Cohen, Reference Cohen1988). The averaged Cohen's kappa is reported to compare with the criteria of reliability. The Cohen's kappa was 0.89, meeting the reliability criteria of greater than 0.70 (Landis and Koch, Reference Landis and Koch1977). Disagreements among raters were discussed. As most disagreements were resolved, the kappa value was increased by 0.96.
Independent variables
Experience in emissions trading
The first independent variable was drawn from the CDP question 2(g). In this question, firms were asked “i) Does your company have facilities covered by the EU Emissions Trading Schemes? ii) What is your company's strategy for trading or participating in regional and/or international trading schemes (e.g., EU ETS, Regional Greenhouse Gas Initiative, and Chicago Climate Exchange (CCX)) and Kyoto mechanisms such as Clean Development Mechanism and Joint Implementation projects? Explain your investment for each of the following: EU ETS, CDM/JI, CCX, RGGI, and others.”
Because the EU-ETS is a mandatory public scheme, some US firms with facilities in the EU had taken part in the EU-ETS in 2008. The variable was coded “1” for firms that stated their emissions trading experiences in the EU ETS and other trading regimes, and otherwise “0.”
Process and product improvements for carbon reductions
The second independent variable that captured firms’ process and product improvements was measured by the CDP question 3 (iv). In this question, the CDP asked, “What activities are you undertaking to reduce your emissions (e.g., renewable energy, energy efficiency, process modifications, carbon offsets, and carbon sequestration)?” Most firms answered that they had enhanced energy efficiency by way of simple housekeeping measures. Because around 88 percent of firms in the sample responded that they improved energy efficiency for carbon reductions in their processes or products, more rigorous levels of process and product improvements had to be considered. Other process-related activities include reducing flaring in gas and oil extraction; adopting green power generation systems to increase the use of renewable energy; applying alternative hydrofluorocarbons (HFCs)-free refrigeration technologies in operations; closing down older, inefficient fossil generating plants; and reducing sulfur hexafluoride (SF6) emissions and methane (CH4) leakage, among other measures. With respect to product improvement, some firms cited their efforts to enhance products’ carbon efficiencies in considerations of raw material consumption, design specifications, packaging, consumer usage, product functionality, end-of-life disposal and reuse, and so forth. Therefore, if companies improved energy efficiency and implemented other process or product-related carbon reduction practices, they were coded “1.” However, firms that did not adopt both measures were coded “0.”
Corporate climate governance bodies
Organizational structure to address climate issues and carbon emissions was measured by relying on the CDP question 4(a), “Does a Board Committee or other executive body has overall responsibility for climate change? If not, please state how overall responsibility for climate change is managed.” Firms’ answers were identified in three ways: (1) no responsible committees or executive bodies existed; (2) an already-existing executive body or committee, such as the Environment, Health, and Safety Department, had taken overall responsibility for addressing climate change as one of the firms’ environmental or social issues; or (3) teams or departments dedicated to climate change had been formed to address carbon emissions.
Two measures were constructed, and the first measure was coded “1” if a firm has any organization types mentioned previously, (1), (2), and (3). Firms that answered no organizational structure were coded “0.” This second measure was coded “1” if firms have answered that they created teams and departments dedicated to climate change, otherwise “0.” This measure may reflect a firm's more heightened concerns, show higher commitment to accentuate the issue within firms, or lead to more swift action toward actual carbon reductions (Carbon Disclosure Project, 2008).
Control variables
As firm size and firm resources are often discussed as influential in managing a nonmarket environment (Hillman Reference Hillman2003; Keim and Baysinger, Reference Keim and Baysinger1988; Schuler et al., Reference Schuler, Schnietz and Baggett2002), it is necessary to control for them. Firms’ number of employees (natural log transformation) and Return on Assets (ROA; natural log transformation) in 2007 were used as measures for firm size and firm resources, respectively. Those data were obtained from Compustat databases, which provide company-specific information on all publicly traded firms that file 10-K forms with the Securities and Exchange Commission.
Organizational slack is a cushion of actual or potential resources that allows an organization to respond to internal or external pressures for an adjustment (Bourgeois, Reference Bourgeois1981). It has been suggested that politically active firms are more likely to possess excess slack resources (Hillman et al., Reference Hillman, Keim and Schuler2004). Current ratio is a ratio of current assets to current liabilities and has been commonly used as a proxy for slack resources (Schuler, Reference Schuler1996). Firms’ current ratios in 2007 were added to control for organizational slack resources.
Although an economy-wide mandatory climate policy can affect all businesses, the level of regulatory impact on each industry will be different. To control for industry effects, industry dummies representing SIC codes 20–27 (food, wood, paper, and printing products), 28–30 (chemistry, petroleum, rubber, and plastic products), 33–36 (machinery and electronic equipment), and 37–38 (transportation equipment) were included. The omitted industry dummy variable was oil, gas, and utilities industry (SIC 13 and 49). Sample size restrictions prohibited the inclusion of more precise industry dummies.
Measures for assessing market-based carbon actions
Empirically assessing the relationships of interest is somewhat complex since the hypothesized relationships are potentially endogenous. A regressor is said to be endogenous if it is correlated with the error that affects the dependent variable in a regression model. Endogeneity can come about in the presence of selection bias or omitted variables bias or in a system of simultaneous equations (Nichols, Reference Nichols2007). The issue in this study is that unobserved factors such as managers’ attitudes toward the environment are likely to be correlated with both market-based carbon activities and firms’ support for mandatory climate policy. An instrumental variable was adopted to address the potentially endogenous relationship.
Instrumental variable
Quality management systems
One of the factors that may encourage the development of firms’ market-based carbon actions is Quality Management Systems (QMS). QMS enables firms to continuously improve all operations by discovering the reasons for poor quality performance and implementing methods to reduce it (Hoyle, Reference Hoyle2006). Some firms implement a certified QMS, such as the ISO 9000 standard, verifying firms’ strong commitment to continuous improvement for product quality (Terlaak and King, Reference Terlaak and King2006). More than one million organizations in 170 countries have adopted the ISO 9000 QMS standard.
Some scholars have examined a positive linkage between QMS and firms’ environmental management practices (Halkos and Evangelinos, Reference Halkos and Evangelinos2002; Darnall and Edwards, Reference Darnall and Edwards2006; Darnall et al., Reference Darnall, Henriques and Sadorsky2008; Ziegler and Nogareda, Reference Ziegler and Norgareda2009). Their logic is that QMS can help firms integrate proactive environmental practices to remove wastes or pollution-related inefficiencies in manufacturing processes. Also, the success of QMS is subject to extensive knowledge and monitoring of organizational resources, constraints, production capabilities, and processes (Kitazawa and Sarkis, Reference Kitazawa and Sarkis2000; Falk, Reference Falk2002). Also, the plan-do-check-act approach in QMS helps firms minimize defects-based wastes, reduce energy and material consumption, and lower carbon emissions (Kamenders et al., Reference Kamenders, Rosa and Kass2017; Giampieri et al., Reference Giampieri A., Taylor, Smallbone, and A and Roskilly2019). As such, QMS could be instrumental in the adoption of market-based carbon actions, but there is no a priori reason to expect that QMS directly influence firms’ engagement in nonmarket environment and support for mandatory climate policy. Coding the QMS variable was not straightforward, as the ISO 9000 certification occurs at the facility level while all other variables were measured at the firm level. To reconcile the unit of analysis, ISO certification data were linked to facilities’ parent company data. The percentage of total certified QMS facilities in a firm was calculated and then used as a QMS measure.
Independent variables
Competitiveness
Competitiveness is a key driver of proactive organizations’ environmental initiatives beyond regulatory compliance (Reinhardt, Reference Reinhardt2000; Bansal and Roth, Reference Bansal and Roth2000). Firms would respond to environmental issues to reduce costs of energy or raw materials consumption (Cordano, Reference Cordano1993; Porter and van der Linde, Reference Porter and van der Linde1995). They may also develop green products in the hope that they can raise market revenues (Ambec and Lanoie, Reference Ambec and Lanoie2008). Likewise, firms would respond to climate issues with the same competitiveness motive (Okereke, Reference Okereke2007).
The competitiveness variable was measured by accounting for whether firms were motivated by cost savings or market prospects. It has been suggested that climate change would present an opportunity for gaining a competitive advantage to firms driven by monetary gains (Okereke, Reference Okereke2007). The CDP survey asked, “how does climate change present general opportunities for your company (Question 1(b) (iii)).” Relying on firms’ answers to the open-ended question, this measure was coded “no opportunities = 1,” “stated opportunities = 2,” and “assessed opportunities = 3,” respectively. “Stated opportunities” indicate that a company recognizes climate change as business opportunities but fails to provide specific examples, while “assessed opportunities” demonstrate a company perceiving climate change as market opportunities and providing a detailed explanation of the opportunities. The interrater reliability analysis was performed, and Cohen's kappa was 0.97.
Regulatory pressure
Firms’ external environments, institutions, and actors can influence corporate strategic decisions (Ingram and Silverman, Reference Ingram and Silverman2002), and regulatory pressure is considered one of the key driving forces of firms’ corporate environmental practices (Jennings and Zandbergen, Reference Jennings and Zandbergen1995; Delmas and Toffel, Reference Delmas and Toffel2004; Hahn and Scheermesser, Reference Hahn and Scheermesser2006). In the lack of a unifying federal climate policy, firms might face regulatory pressure at the state level. Under the Bush administration (2001–8), state governments took the lead on climate policy (Rabe, Reference Rabe2004; Posner, Reference Posner2008). For instance, California adopted the Global Warming Solutions Act in 2006, and ten eastern states adopted the Regional Greenhouse Gas Initiative (RGGI) (Aulisi et al., Reference Aulisi, Larsen, Pershing and Posner2007) to reduce carbon emissions from power plants. Several western statesFootnote 1 formed the Western Climate Initiative (WCI) to implement a joint strategy for reducing carbon emissions in 2007. Accordingly, firms headquartered in those states or that have a significant number of operating facilities in those states would face greater regulatory scrutiny (Reid and Toffel, Reference Reid and Toffel2009).
Regulatory pressure was operated by measuring state-level regulatory pressures.Footnote 2 If a firm's headquarters and half of the firm's facilities are not located in the states with regional climate change initiatives, this is coded “1.” Firms that had either headquarters or more than half facilities (of the total facilities) in those states were coded “2.” Lastly, firms that had both headquarters and more than half facilities in those states were coded “3.” The location data for headquarters and facilities were obtained from the Dun & Bradstreet database.
Control variables
Motivations for engaging in carbon strategy are expected to be related to firms’ relative economic standing. It is possible that firms with strong standing might have more organizational slack resources compared to other firms, and the slack resources would allow firms to invest in environmental management practices (Etzion, Reference Etzion2007). As such, organizational slack might be associated with undertaking firms’ carbon strategy. A firm's current ratio was used to account for organizational slack.
Firms’ environmental performance might be another important variable that explains firms’ carbon management practices. It has been suggested that environmental incidents or crises (Klassen, Reference Klassen, Keys and Dozier1997; Rappaport and Flaherty, Reference Rappaport and Flaherty1992), as well as bad pollution records (Khanna and Damon, Reference Khanna and Damon1999) are associated with firms’ proactive environmental management. That means, firms that showed poor performance records in complying with air pollution regulations are more likely to reduce air pollutants to avoid expensive penalties or negative scrutiny from external stakeholders. Firms’ total penalties for the Clean Air Act's violation during 2000–3 (logged) were included in regression models. This is a time-lagged variable, considering the effects of prior penalties on implementing carbon management practices in 2008. The year of 2003 was particularly chosen because emissions trading schemes were actively developed after 2004.Footnote 3 Firms’ fines ranged from $0 and $334 million over the period. Firm size, firm resources, and industry effects were also used as control variables.
Analytic methods
Spearman correlations among the explanatory variables were within the range of acceptability (<.44), far less than Kennedy's (Reference Kennedy2003) recommended maximum threshold of .80. An analysis of the Variance Inflation Factors (VIF) revealed the highest VIF to be 3.45, and multicollinearity was not an issue in this empirical analysis.
In the absence of controlling for endogeneity, a simple regression model examining the relationship between firms’ carbon-reducing practices and their policy support will yield estimates that potentially overestimate the relationships of interest (Monfardini and Radice, Reference Monfardini and Radice2008). To correct for endogeneity, this study employs a two-stage bivariate probit model that belongs to the general class of simultaneous equation models as the Heckman selection model (Baum, Reference Baum2007).
The bivariate probit model explicitly takes into account that firms’ decisions on carbon market strategy (carbon management practices) and on nonmarket component (corporate policy support) are correlated. Therefore, the model in this study is formulated as a system of two latent-variable equations with one equation for a firm's carbon management practice adoption and a second for the firm's policy support decision. There are two probability equations (Maddala, Reference Maddala1983); the first reduced form equation for the potentially endogenous dummy (1) and the second structural form equation determining the outcome of interest (2),


where Y1, Y2 are observed as 1 if their latent variables Y1*, Y2* are positive and zero otherwise (Y1 = 0 if Y * ≤ 0, Y1 = 1 if Y1* > 0, Y2 = 0 if Y2* ≤ 0, Y2 = 1 if Y2* > 0).
In the equations, X1 and Z 2 are vectors of exogenous variables, which belong to independent variables described in the previous section, and β1 and δ2 are parameter vectors, and δ1 is a scalar parameter. β2 = (δ1, δ2) and the error terms (u 1, u 2) are identically distributed as bivariate normal with zero mean. As the random error terms (u 1, u2) are assumed to be correlated, a correlation of equations’ disturbance (correlation coefficient ρ(rho)) plays an important role in the bivariate probit model, and if ρ≠ 0, the two probit equations can be jointly determined.

Coefficients will then be estimated in a two-stage process in which the second equation is observed conditional on the outcome of the first. The statistical test for rho (ρ) indicates the interdependence of the two equations, and thus there is a need to correct for endogeneity using simultaneous two-step estimation (Wooldridge, Reference Wooldridge2002; Baum, Reference Baum2007).
In this study, the error terms’ correlation may be likely in that unobserved factors such as “green” preferences of the management and its progressive attitude toward the environment and climate change. Such unobservable factors would affect both the carbon market strategy and nonmarket strategy decision and may contaminate the estimation results. The potential existence of simultaneity problems due to common unobservable factors need to be addressed, and the QMS variable was adopted to control endogeneity because QMS has been proven to be a positive effect on the adoption of proenvironmental management practices as QMS could function as a complementary capability that could lower the adoption cost of proenvironmental management practices (Halkos and Evangelinos, Reference Halkos and Evangelinos2002; Darnall and Edwards, Reference Darnall and Edwards2006; Darnall et al., Reference Darnall, Henriques and Sadorsky2008; Ziegler and Nogareda, Reference Ziegler and Norgareda2009). QMS is thus assumed to help firms adopt carbon management practices but would be exogenous to firms’ nonmarket environment management and support for mandatory climate policy. In doing so, we can ignore the endogeneity of carbon management practices (Y1) and treat it as if it were an exogenous variable in equation (2) (Greene, Reference Greene2000).
The sample size might be a constraint to investigate the relationships of interest as a complex two-stage empirical model was employed. To check whether sample size is sufficient for securing validity and reliability, a statistical power analysisFootnote 4 was performed (Cohen, Reference Cohen1988). The estimated power was 0.88, with a significance level of .05 and a standard effect size of 0.5, which is typical of and recommended for research in management science (Mazen et al., Reference Mazen, Graf, Kellogg and Hemmasi1987; Andersson and Bateman, Reference Andersson and Bateman2000). The hypotheses were tested in separate regressions because in the bivariate probit model, the outcome of the first stage probit model will be an explanatory variable in the second stage, and the three different carbon managements will lead to different latent variables (Y1*). The descriptive statistics for all variables in the analysis are shown in table 1.
Table 1: Descriptive statistics
Results
Table 2 presents the estimated coefficients of the first equations, which predict the implementation of firms’ carbon management practices. The competitiveness variable was associated with a greater likelihood of managing carbon emissions in all models, holding other variables constant (p < .05). These findings state that firms motivated by competitiveness are more likely to meaningfully engage in emissions trading, improve their processes and products to reduce carbon emissions, and develop an organizational structure to handle climate issues.
Table 2: Predicting firms’ carbon management practices
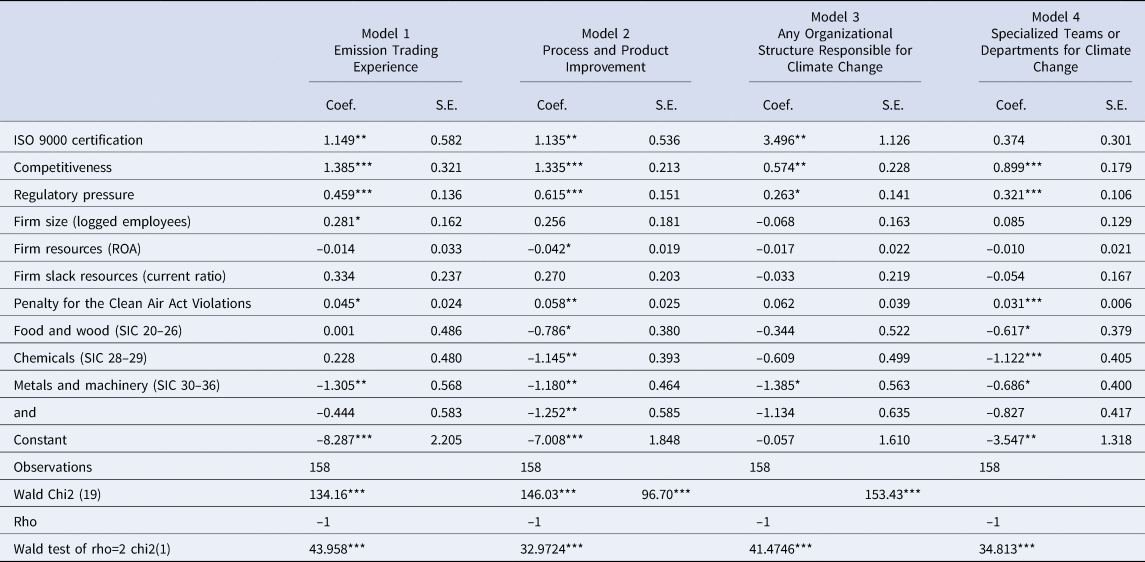
* p < .10; **p < .05; ***p < .01.
In examining the estimated coefficients of regulatory pressures in four models, the results showed that regulatory pressure was positively associated with carbon management practices (p < .10). That is, if firms’ operations are under strong institutional pressures, they are more likely to implement market-based carbon practices. In other words, if firms’ headquarters or half the facilities are in the states where strict state-level climate policy had been in place, they would be more likely to employ carbon management practices.
A firm's ISO 9000 certification, which was included as an instrument to address endogeneity, was associated with its carbon-reducing practices in three of four estimation models (p < .05). An instrumental variable should be correlated with an endogenous variable, and these findings confirm the variable as a relevant instrument.
Related to control variables, firms’ penalty for the Clean Air Act (CAA) violations was statistically significant and positive in three of four models (p < .01–.10). Firms that paid penalties due to the CAA violations were more likely to manage their carbon emissions by way of participating in emissions trading, improving processes and products, and establishing organizational structures responsible for climate change. With respect to industry effects, the findings suggest that firms in the oil, gas, and utility industry are more likely to implement carbon management practices than firms in the food, wood, chemistry, transportation, metal, and mechanical equipment industries (p < .01–.10).
Table 3 presents the estimated coefficients of firms’ support for mandatory climate policy. The Wald chi-square statistics were significant at p <.01 across all four treatment models (models 1–4), suggesting that variables in the model altogether can predict the likelihood of firms’ policy support. The results also illustrate that three carbon-reducing practices were endogenous, as denoted by the Wald test of rho. For each treatment model, rho was statistically significant (p < .01), indicating that a firms’ ISO 9000 certification was important in understanding the relationship between a firm's carbon market strategy and policy support.
Table 3: Assessing the relationships between carbon management practices and business support for mandatory climate policy†

† Excluded industry dummy is oil, gas, and utility industry.
* p < .10; ** p < .05; *** p < .01
The estimated coefficient of emission trading experience in model 1 was positive and statistically significant (p < .01). This finding offers support for hypothesis 1, which states that firms with organizational resources and capabilities underlying their emissions trading experiences are more likely to engage in a nonmarket environment and support mandatory climate policy.
The results of model 2 also show that a firm's process and product improvements were positively associated with whether it supported mandatory climate policy (p < .01). This finding offers evidence in support of hypothesis 2, which states that firms that develop organizational resources and capabilities underlying their process and product improvements are more likely to engage in a nonmarket environment and support mandatory climate policy.
In addition, a firms’ organizational structure was another predictor of firms’ policy support (p < .01). This was true for models 3 and 4, offering evidence for hypothesis 3. That is, firms with organizational resources and capabilities underlying their climate affairs teams are more likely to coordinate and handle climate issues, engage in a nonmarket environment, and support mandatory climate policy.
To further investigate the differential effect of carbon management practices on firms’ policy support, marginal effects were calculated in each model using bivariate probit postestimation tools.Footnote 5 The marginal effects ranged from 0.328 to 0.756. The largest effect was shown in process and product improvements (in model 2) as of 75.6 percent, while the marginal effect of any type of organizational structure was 32.8 percent (model 3), and the effect of specialized climate teams or departments was 35.1 percent (model 4).
Related to control variables, firm size was positive and statistically significant (p < .05) in three of the four models (model 1, model 3, and model 4). These findings support that larger firms are more likely to support climate legislation or regulatory proposals. That might be due to these firms’ greater visibility (Meznar and Nigh, Reference Meznar and Nigh1995; Pfeffer and Salancik, Reference Pfeffer and Salancik1978). In addition, firm resources were negatively associated with firms’ support for mandatory climate policy in three of the four models (p < .10). The findings suggest that more profitable firms are less likely to support climate policy that could challenge the firms’ existing economic standings.
Related to industry effects, the results showed that firms in the oil, gas, and utility industry were more likely to support mandatory climate policy than firms in the chemical industry (p < .10). They were also more likely to support the climate policy than firms in the food and wood industry (p < .10). Accordingly, the findings indicate that once firms in the energy industry have managed carbon emissions, they are more likely to support mandatory climate policy.
Discussion
Firms compete in the market and nonmarket environments, and an effective business strategy needs to consider managing both market and nonmarket environments. However, the nonmarket context seems harder to be handled due to its decision-making power residing in public institutions. Also, changes in the nonmarket context are contingent upon a wedding of interest groups, the public, and businesses alike. Firms thus find the nonmarket environment as more complex than the market environment (Marquis et al., Reference Marquis, Toffel and Zhou2016). If firms do not appropriately respond to the nonmarket environment, their long-term stability could be challenged.
Climate change is one of the most critical social and environmental issues that pose enormous challenges to firms. Firms face physical, financial, technological, and regulatory risks, and these risks have been witnessed across different sectors and in multiple countries. In response, some firms strategically managed carbon emissions and forged climate strategies with both market and nonmarket components (Kolk and Pinkse, Reference Kolk and Pinkse2004; Kolk and Pinkse, Reference Kolk and Pinkse2005; Falkner, Reference Falkner, Ougaard and Leander2010; KPMG, 2008; Reid and Toffel, Reference Reid and Toffel2009; Ernst & Young, 2010; Boiral et al., Reference Boiral, Henri and Talbot2012; Doda et al., Reference Doda, Gennaioli, Gouldson, Grover and Sullivan2015; Böttcher and Müller, Reference Böttcher and Müller2015). Firms’ market and nonmarket strategies have shown substantial variances. For instance, with respect to nonmarket strategy, some firms actively engage in their nonmarket environment, while some other firms remain silent or inactive toward their nonmarket environment (Jeswani et al., Reference Jeswani, Wehrmeyer and Mulugetta2008; Kolk and Pinkse, Reference Kolk and Pinkse2007; Levy and Kolk, Reference Levy and Kolk2002; Kim and Darnall, Reference Kim and Darnall2016).
Prior scholars in business and climate change have paid particular attention to the factors driving a firm's strategic response to climate change. They found firm demographics such as industrial sector (Levy and Egan, Reference Levy and Egan2003; Jeswani et al., Reference Jeswani, Wehrmeyer and Mulugetta2008; WRI, 2014) or corporate headquarters’ locations (Levy and Kolk, Reference Levy and Kolk2002; Kolk and Pinkse, Reference Kolk and Pinkse2007), fragmented policies across multiple layers of government (Adelle and Russel, Reference Adelle and Russel2013) or regulatory uncertainty (Weinhofer and Hoffman, Reference Weinhofer and Hoffmann2010) as driving forces. However, little is known about how a firm's organizational resources and capabilities underlying carbon market strategy relate to the firm's support for mandatory climate policy. What is also unknown is whether the firm's supportive stance is credible or not. Insomuch as firms are presumed to be a promising social actor for addressing the greatest market failure, climate change (Stern, Reference Stern2007; Vogel Reference Vogel2007), a better understanding of firms’ support for mandatory climate policy that would force firms to alleviate or remove negative externality is essential.
This study fills out this research void, hypothesizing that firms with organizational resources and capabilities that emerged from their carbon market strategy are more likely to lead firms to support mandatory climate policy. The results find positive relationships, as this study focused on the three prominent carbon management practices around 2008 at the time of this study's focus, engaging in emissions trading, improving processes and products for carbon emissions, and configuring climate units responsible for climate affairs.
This study offers four unique contributions. First, this study underscores organizational resources and capabilities underlying a firm's market strategy are a valuable factor for shaping public policy and regulatory changes. According to Bonardi and Urbiztondo (Reference Bonardi and Urbiztondo2013), firms may create political resources by asset freezing. While asset freezing would come at higher costs than traditional nonmarket actions, it may help firms build resources with high political value and thus lawfully influence public policy making. A firm's business strategy can be then viewed as more effective and integrative (Baron, Reference Baron1995) with an enhanced fit between a firm's economic actions and public policy requirements. Therefore, this study contributes to the corporate political activity scholarship, providing empirical evidence that firms may influence policy by asset freezing that helps firms develop political resources instead of campaign contributions or hiring lobbyists (Bonardi and Urbiztondo, Reference Bonardi and Urbiztondo2013).
Second, this study sheds light on firms’ nonmarket action, including their support for regulatory policy. Many firms do not engage in public discussions for climate policy formation in part due to their negative views of nonmarket strategy as a cost or an institutional constraint on firms (Scott, Reference Scott2001; Oliver and Holzinger, Reference Oliver and Holzinger2008). That means, a firm's efforts to facilitate the development of regulatory policy have the property of a public good, which may diminish the firm's incentive to engage in public policy making. For this reason, many firms may forgo the opportunity to develop political resources like reputation, good rapport with policy makers, or high-quality information that would give firms competitive advantages against rivals during policy-making processes (Baron, Reference Baron1995, Reference Baron2001; Bonardi and Urbiztondo, Reference Bonardi and Urbiztondo2013). Unlike conventional wisdom, this study informs that firms’ nonmarket strategy in tandem with carbon market strategy may lead them to gain a competitive foothold over the long term. This would be particularly true in firms’ responses to issues like climate change on which market opportunities are more controlled by governments instead of markets (Baron Reference Baron1995), and flexible policy mechanisms are favored as compared to command-and-control regulatory approaches (Kolk and Pinkse, Reference Kolk and Pinkse2005).
Third, being related to the second point, this study expands the understanding of the two mechanisms under which firms integrate market and nonmarket strategies in the context of climate change. Integrating market and nonmarket strategies could involve two potential mechanisms. First, firms could align their nonmarket actions to the decisions made at the market level. If a firm has decided to invest in production or processes that are more climate-friendly, this firm will try to build a competitive advantage on this and capitalize on this advantage by pushing for more stringent climate policies. In another case, firms could use their advantage in climate-oriented production and processes in the nonmarket arena to be more successful and push for more favorable policies. In this scenario, firms would be more likely to earn a seat at the table while the regulation is being implemented. Indeed, this mechanism was found when BP and Shell had internal trading schemes before the EU-ETS was formed in 2005, and their internal trading schemes, which preceded the EU-ETS, gave them more political leverage in the design process of the EU-ETS. This research suggests a vibrant illustration of the two potentially different mechanisms that lead the integration of market and nonmarket strategies toward climate change.
Lastly, this study contributes to the discussion of greenwashing and provides implications for public policy. It suggests that a firm's policy support integrated with its market strategy is more sincere than is generally assumed and needs to be distinct from greenwashers’ empty claims. Greenwashing encompasses a range of communications that mislead people into adopting overly positive beliefs about a firm's environmental performance, practices, or products (Lyon and Maxwell, Reference Lyon and Maxwell2011; Lyon and Montgomery, Reference Lyon and Montgomery2015). Prior scholarship in greenwashing has examined drivers (Delmas and Burbano, Reference Delmas and Burbano2011), means, and impacts of greenwashing (Lyon and Montgomery, Reference Lyon and Montgomery2015), as well as multilayers of greenwashing beyond direct, misleading communications (Bowen and Aragon-Correa, Reference Bowen and Aragon-Correa2014). However, scholars indicate the challenges of identifying greenwashers from firms with authentic voices because little consensus is made to identify greenwashers objectively (Lyon and Montgomery, Reference Lyon and Montgomery2015). This study speaks to this issue, suggesting that greenwashers may be determined by examining whether firms freeze their assets and invest in a market strategy to develop organizational resources and capabilities, which will be an indicator of firms’ involvement in the nonmarket environment. Thus, this study warns against the tendency to disregard firms’ policy support, informing that firms’ policy support combined with carbon market strategies is qualitatively different from greenwashers’ empty claims without actions. It implies that policy makers could leverage firms’ policy support to enhance legitimacy to mandatory climate policy proposals during policy-making processes and expand the needed support for the proposals.
Limitations and future research
Despite these contributions, however, several limitations need to be acknowledged. The first limitation relates to the self-reported feature of the CDP data. CDP data provided a deep understanding of firms’ climate market and nonmarket strategies (Reid and Toffel, Reference Reid and Toffel2009). However, the results drawn from CDP data need to be interpreted with caution as they may differ from those from independent survey data. More thoughtful, meticulously designed research such as using randomization-based experimentation and a difference-in-differences approach may provide a more accurate picture of the relationships of interest (Frondel et al., Reference Frondel, Horbach and Rennings2008). Future researchers may build on this research with that direction.
Second, this study fails to specify the type of mandatory climate policy. It measured flexible climate policy mechanisms broadly but could not further differentiate them due to a lack of detailed information in the CDP data that caused data absences. However, firms supporting emissions trading may not necessarily advocate a carbon tax, while both policies are well-known flexible market-based mechanisms to address climate change. Future scholarship can consider this issue and specify the policy type.
Third, future scholars can expand this study by empirically disentangling the two potential mechanisms integrating market and nonmarket strategies. Firms may align their nonmarket actions to the market level's decisions or use their competitive advantage in the nonmarket arena to be more influential and thrive in the policy-making process. This study's empirical aspect has not separated these two mechanisms. Future scholarship can overcome this limitation and advance the understanding of the integrated strategy process by unraveling the two mechanisms.
Fourth, the study is limited in terms of generalizing the outcome particularly related to the role of emissions training experience in firms’ involvement in the nonmarket environment. While emissions trading-based carbon pricing mechanisms are popular, there are still many institutional settings without the mechanisms, and thus the outcome could be restrictively applicable to large firms in the countries where emissions trading policies are in place. Despite this constraint, this study counterintuitively hints at the reasons for policy makers to consider launching at least a pilot-based carbon trading policy where firms could be motivated to manage their carbon emissions and potentially engage in the nonmarket environment where carbon policies are discussed. Firms’ experience-based feedback on the potential policy mechanisms could improve the sound planning of policies to manage carbon emissions.
Lastly, this study takes an initial step at evaluating an organization's climate policy support. In doing so, this study relied on S&P 500 firms’ policy support when the US Congress debated climate proposals in 2007–8. However, it would be interesting to expand this study in different periods in the United States, particularly as infrastructure-based climate policy discussion has been active under the Biden administration (Tankersley, Reference Tankersley2021) and in other large firms (like Fortune 500 firms) operating in different institutional contexts. This way would bring a deeper understanding of firms’ nonmarket strategy and subdue the concerns over the generalization of the study.
Implication
This study sheds light on firms’ nonmarket strategy, policy support associated with firms’ market strategy. The information of firms’ policy support motives helps diverse social actors to determine whether they can count on firms’ policy support to pass or implement socially desirable policies (Kim and Darnall, Reference Kim and Darnall2016). By supporting mandatory climate policy, firms can contribute to producing a public good while creating a sustained competitive advantage embedded in policy changes. Firms may consider such nonmarket action more seriously and develop corporate political resources with asset freezing when business opportunities are more controlled by governments than markets (Baron, Reference Baron1995; Bonardi and Urbiztondo, Reference Bonardi and Urbiztondo2013). There is a greater value in integrating market and nonmarket strategies both for firms and society.


 Open access