


Introduction
Advancements in medical technologies and emergency medicine have done a marvellous job in saving human lives, remarkably decreasing the death rate attributed to neurological emergencies (neurotrauma and cerebrovascular diseases) over time.Reference Miyata, Kijima, Nakamura and Ono1 Nevertheless, these advancements have increased the number of patients with chronic disorders of consciousness (DOCs), including patients in a vegetative state (VS) or a minimally conscious state (MCS). In Japan, a field assessment of the Tohoku district by Sato et al.Reference Sato, Ueki and Arai2 reported the number of patients with chronic DOCs to be 3000 in 1978, whereas Fujiwara estimated the number to be 55,000 in 2010.Reference Fujiwara3 Thus, the number of patients with chronic DOCs increased 18-fold from 1978 to 2010. In the USA, about 14,000 patients with brain injuries were categorised as being in a VS every year.Reference Laureys4
The treatment and care of patients with chronic DOCs result in both medical and social burdens. As no effective treatment exists for patients with chronic DOCs, the prospect of consciousness recovery is low among those patients; however, for unknown reasons, a small number of patients emerge from chronic DOCs.Reference Sancisi, Battistini and Di Stefano5–Reference McMillan and Herbert10 Per the Multi-Society Task Force on PVS, the recovery rate among patients with chronic DOCs within 12 months after traumatic brain injury (TBI) was 1.6%.11 In patients with non-trauma-induced DOCs, Estraneo et al.Reference Estraneo, Moretta and Loreto12 reported that 9 of 43 patients with prolonged anoxic VS had recovered responsiveness (although 2 of them died after regaining consciousness), whereas 12 patients remained in a VS and 22 died in the VS within 24 months after onset. Nonetheless, research on the cerebral metabolism of patients who recover from chronic DOCs is limitedReference Laureys, Lemaire, Maquet, Phillips and Franck13 and the details of this phenomenon remain unclear. In the last two decades, studies evaluating cerebral functions have increasingly focused on neuroradiological, neurophysiological and metabolic examinations designed to identify patients with the highest chance of improvement following aggressive rehabilitation.Reference Stender, Gosseries and Bruno14–Reference Landsness, Bruno and Noirhomme23
18F-fluorodeoxyglucose positron emission tomography (FDG-PET) facilitates the quantitative measurement of cerebral glucose metabolism in specific brain regions considered vital for consciousness. Stender et al.Reference Stender, Kupers and Rodell24 reported that the median cortical glucose metabolic rates averaged 42% of normal cortical activity in patients with VS and 55% of normal cortical activity in patients with MCS. A meta-analysis by Bender et al.Reference Bender, Jox, Grill, Straube and Lulé25 demonstrated that FDG-PET is the most sensitive clinical examination for differentiating MCS from VS compared with functional magnetic resonance imaging, event-related cognitive potentials, quantitative electroencephalography (EEG), combined transcranial magnetic stimulation and EEG, electromyography and eye-tracking. Indeed, several studies have established correlations between metabolically reduced brain regions shown by qualitative analyses and consciousness levels in patients with chronic DOCs. For example, Nakayama et al.Reference Nakayama, Okumura, Shinoda, Nakashima and Iwama26 demonstrated that in patients with diffuse brain injury, bilateral hypometabolism in the medial prefrontal regions, medial frontobasal regions, cingulate gyrus and thalamus might reflect clinical deterioration and that hypometabolism in these regions was more prevalent and prominent in those with severe consciousness impairment. In addition, Thibaut et al.Reference Thibaut, Bruno and Chatelle27 reported that patients with VS due to various diseases demonstrated metabolic dysfunction in both the thalamus and an extensive cortical network, whereas MCS patients displayed metabolic dysfunction in both the thalamus and the intrinsic/internal awareness system. To the best of our knowledge, no study has clarified brain region-specific differences in quantitatively analysed brain glucose metabolism among patients with different levels of chronic DOCs. Perhaps, the quantitative approach might contribute to the understanding of the mechanisms of prolonged disturbance of consciousness.
Hence, this retrospective cohort study aims to quantitatively measure the regional cerebral metabolic rate of glucose (CMRGlu) using FDG-PET in patients with TBI-induced chronic DOCs and assess differences noted in each brain region based on the chronic DOC classification.Reference Giacino, Ashwal and Childs28
Patients and Methods
Patients
Among 60 consecutive patients with TBI-induced chronic DOCs due to traffic accidents admitted to the Chubu Medical Centre for Prolonged Traumatic Brain Dysfunction, between 1 April 2014 and 31 March 2019, we enrolled 50 patients (mean age: 40.9 ± 20.1 years; 39 men; mean injury-to-admission interval: 285.4 ± 145.3 days) who fulfilled the inclusion criteria. The inclusion criteria were as follows: patients without massive focal morphological brain damage (detectable lesions were <10 cmReference Fujiwara3, such as contusions, haematomas or infarctions on the high spatial resolution T1-weighted MRI image collected at the time of the study); patients aged ≥16 years and patients without consciousness level changes within 2 weeks before/after FDG-PET examination. Meanwhile, the exclusion criteria, based on which we excluded 10 patients, were as follows: massive focal morphological brain damage more than 10 cmReference Fujiwara3 (n = 2); missing data (n = 6); aged <16 years (n = 1) and insufficient neuroradiological examination owing to the physical ability (n = 1).
We divided the 50 patients into 3 groups (MCS+, MCS− and VS) based on their JFK Coma Recovery Scale-Revised score.Reference Giacino29,Reference Bruno, Vanhaudenhuyse, Thibaut, Moonen and Laureys30 MCS is used when patients with chronic DOCs show minimal signs of consciousness but cannot communicate reliably.Reference Giacino29,Reference Bruno, Vanhaudenhuyse, Thibaut, Moonen and Laureys30 MCS patients were further subcategorised according to the complexity of their behaviours: MCS+ describes high-level behavioural responses, such as command following, intelligible verbalisations or non-functional communication; MCS− describes low-level behavioural responses, including visual pursuit, localisation of noxious stimulation or contingent behaviour, such as appropriate smiling, or crying in response to emotional stimuli.Reference Bruno, Vanhaudenhuyse, Thibaut, Moonen and Laureys30
Of note, the consciousness level of each patient was examined during the admission process, which was determined by three neurosurgeons, three specialist nurses and three rehabilitation therapists. Accordingly, we assigned 20 patients to the MCS+ group (mean age: 40.9 ± 19.3 years; 17 men; 2 left-handed patients; mean injury-to-admission interval: 293.5 ± 142.1 days), 15 to the MCS− group (mean age: 40.0 ± 19.5 years; 12 men; 1 left-handed patient; mean injury-to-admission interval: 270.3 ± 88.3 days) and 15 to the VS group (mean age: 41.6 ± 23.1 years; 10 men; 1 left-handed patient; mean injury-to-admission interval: 322.5 ± 203.0 days; Table 1). No significant differences were noted in age (P = 0.984), sex (P = 0.429), the proportion of left-handed patients (P = 0.915) or the injury to study (P = 0.973) among the three groups.
Table 1: Summary of patient characteristics
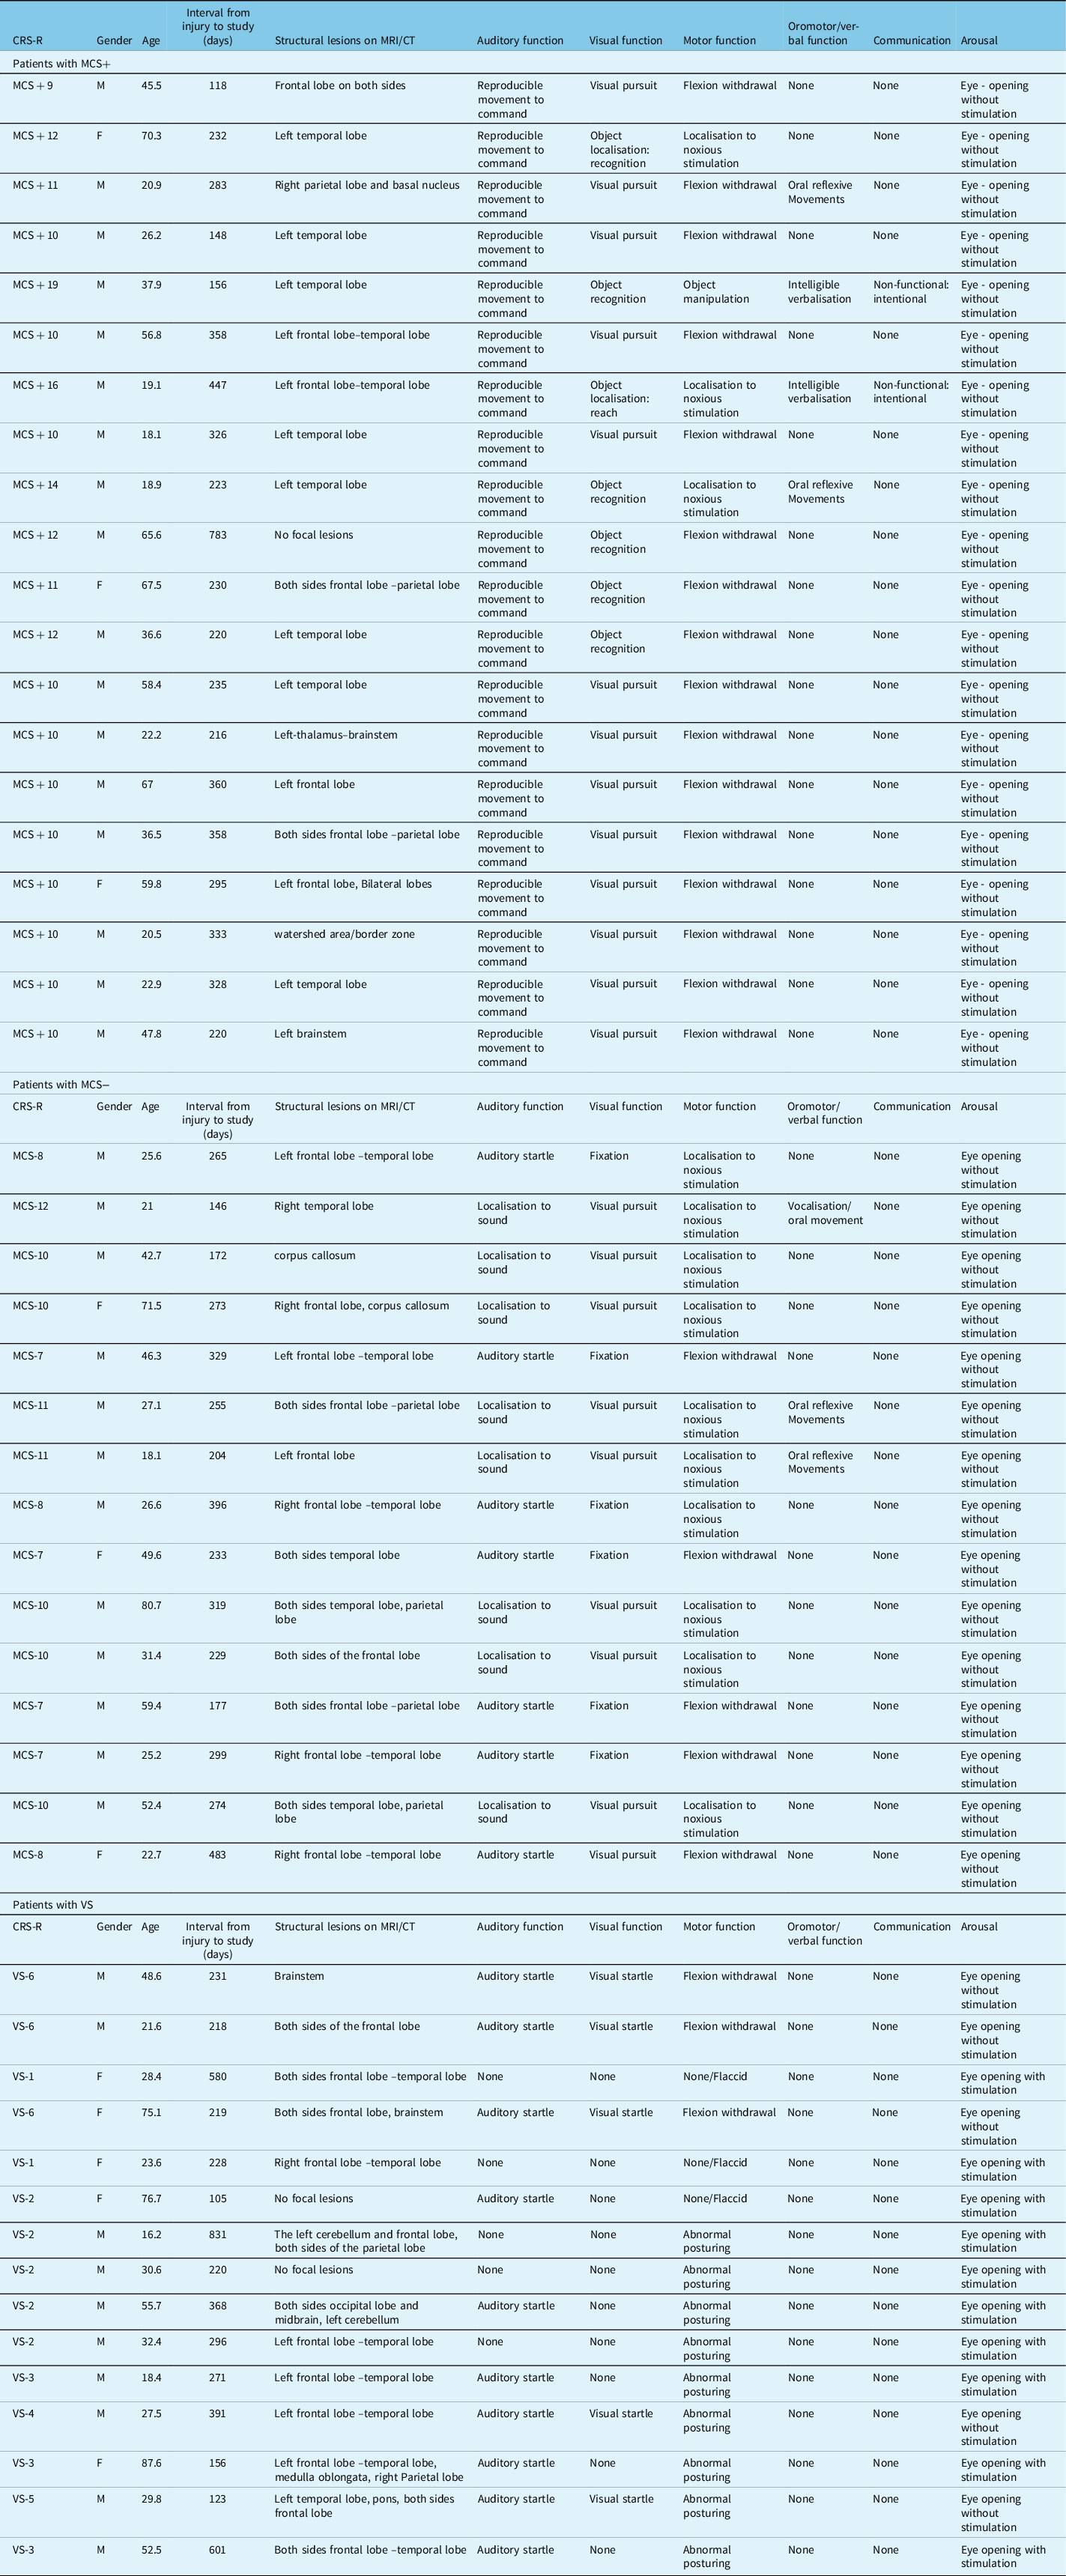
CT=computed tomography; MCS=minimally conscious state; MRI=magnetic resonance imaging; VS=vegetative state.
Magnetic Resonance Imaging
MRI was conducted using a 3-T system (Achieva 3.0T TX QD MRI System; Philips) to obtain transaxial T1-weighted inversion recovery images [repetition time (TR), 2200 ms; echo time (TE), 9.5 ms; number of excitations, 1; inversion recovery delay, 950 ms; field of view (FOV), 23 cm × 23 cm; matrix size, 512 × 510; slice thickness, 5 mm with a 1-mm slice gap].
F-fluorodeoxyglucose Positron Emission Tomography
FDG-PET was performed within 2 weeks (either before or after) of consciousness level assessment. The PET scanner used was an Eminence STARGATE instrument (Shimadzu Corporation, Kyoto, Japan), which provides 99 transaxial images at 2.65-mm intervals. The in-plane spatial resolution (full-width at half-maximum) was 3.5 mm and the scan mode was the standard three-dimensional (3D) mode. All participants were placed in a PET scanner such that slices were parallel to the canthomeatal line. Notably, the participants fasted for at least 4 h before FDG injections. Each patient received a 3.5 MBq/kg dose of FDG administered intravenously through the cubital vein over 1 min. Then, the arterial blood radioactivity concentration was measured over time and the time curve of plasma tracer radioactivity was obtained using an FDG autoradiographic Eminence STARGATE scanner, as reported by Phelps et al.Reference Phelps, Huang, Hoffman, Selin, Sokoloff and Kuhl31 Furthermore, we generated a quantitative image representing the regional glucose metabolic from the frame and the time-activity curve of the local tracer PET measurements.
To analyse regions of interest (ROIs), FDG images were atlas-based parcellated into ROIs through a 3D stereotactic ROI template (3D-SRT; Fujifilm RI Pharma, Tokyo Japan). The embedded 3D-SRT software normalised the FDG images for the ROI analysis per SPM2 algorithm. Next, we acquired regional CMRGlu measurements in the following 12 brain regions of each hemisphere: the corpus callosum, precentral region, central region, parietal region, angular gyrus, temporal region, occipital region, pericallosal region, lenticular nucleus, thalamus, hippocampus and cerebellum.
Statistical Analysis
First, we determined the presence or absence of homogeneity of variance using Levene’s test and then analysed differences in the regional CMRGlu values between the right and left hemispheres and in the 12 brain regions for each hemisphere among the three patient groups (MCS+, MCS− and VS) using analysis of variance (ANOVA) or Welch’s test. Second, significant between-group regional CMRGlu differences identified by ANOVA were further analysed by multiple comparisons using the Tukey method and significant differences highlighted by Welch’s test were further analysed by multiple comparisons using the Games–Howell method. In this study, all P values were two-sided and P < 0.05 was considered statistically significant. Furthermore, all statistical analyses were performed using SPSS ver. 26 (IBM).
Ethics
The Institutional Research Ethics Committee of Kizawa Memorial Hospital approved this study (Approval number 30-039. 12/6/2018), which was performed in accordance with the Declaration of Helsinki. We obtained written informed consent regarding participation in this study and the publication of study results from a family member of each participant.
Results
Comparison of CMRGlu Values among the MCS+, MCS− and VS Groups
Regional CMRGlu values in both the right and left hemispheres decreased with deteriorating levels of consciousness among patients (P = 0.002, ANOVA; Figure 1; Table 2). In the right hemisphere, regional CMRGlu values decreased with deteriorating levels of consciousness in 11 of 12 regions examined, including the corpus callosum (P = 0.015, ANOVA), central region (P = 0.007, ANOVA), parietal region (P = 0.001, ANOVA), angular gyrus (P = 0.001, ANOVA), temporal region (P = 0.007, ANOVA), occipital region (P < 0.001, ANOVA), pericallosal region (P = 0.001, ANOVA), lenticular nucleus (P = 0.029, Welch’s test), thalamus (P = 0.003, ANOVA), hippocampus (P = 0.047, ANOVA) and cerebellar hemisphere (P = 0.037, ANOVA; Figure 2). We observed no statistically significant differences in regional CMRGlu values in the precentral region (P = 0.068, ANOVA).
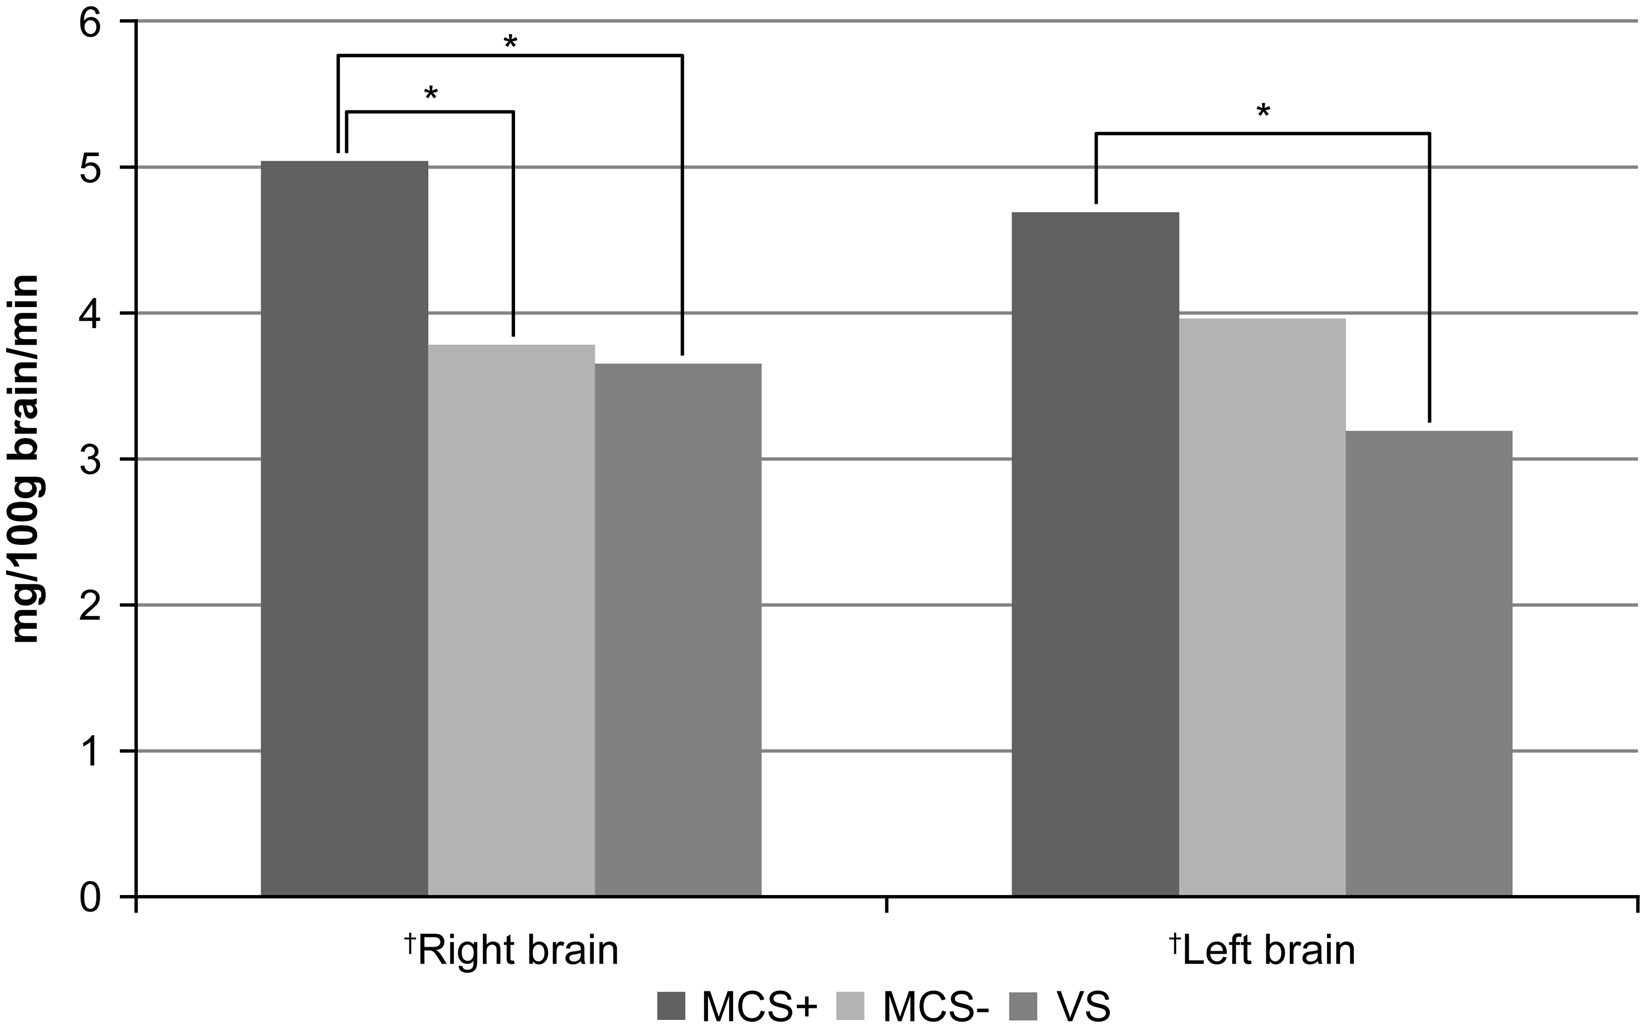
Figure 1: The regional cerebral metabolic rate of glucose (CMRGlu) values in the right and left hemispheres. The regional CMRGlu values were markedly lower in both brain hemispheres in patients with more deteriorated consciousness levels, as assessed using analysis of variance (ANOVA; †). The regional CMRGlu value in the right hemisphere was markedly higher in MCS+ patients than in MCS− patients, as assessed by multiple comparisons using the Tukey method. Conversely, the regional CMRGlu values were similar between both patient groups in the left hemisphere. We observed no significant differences in regional CMRGlu values between MCS patients and VS patients in either the right or left hemispheres after multiple comparisons. *P < 0.01.
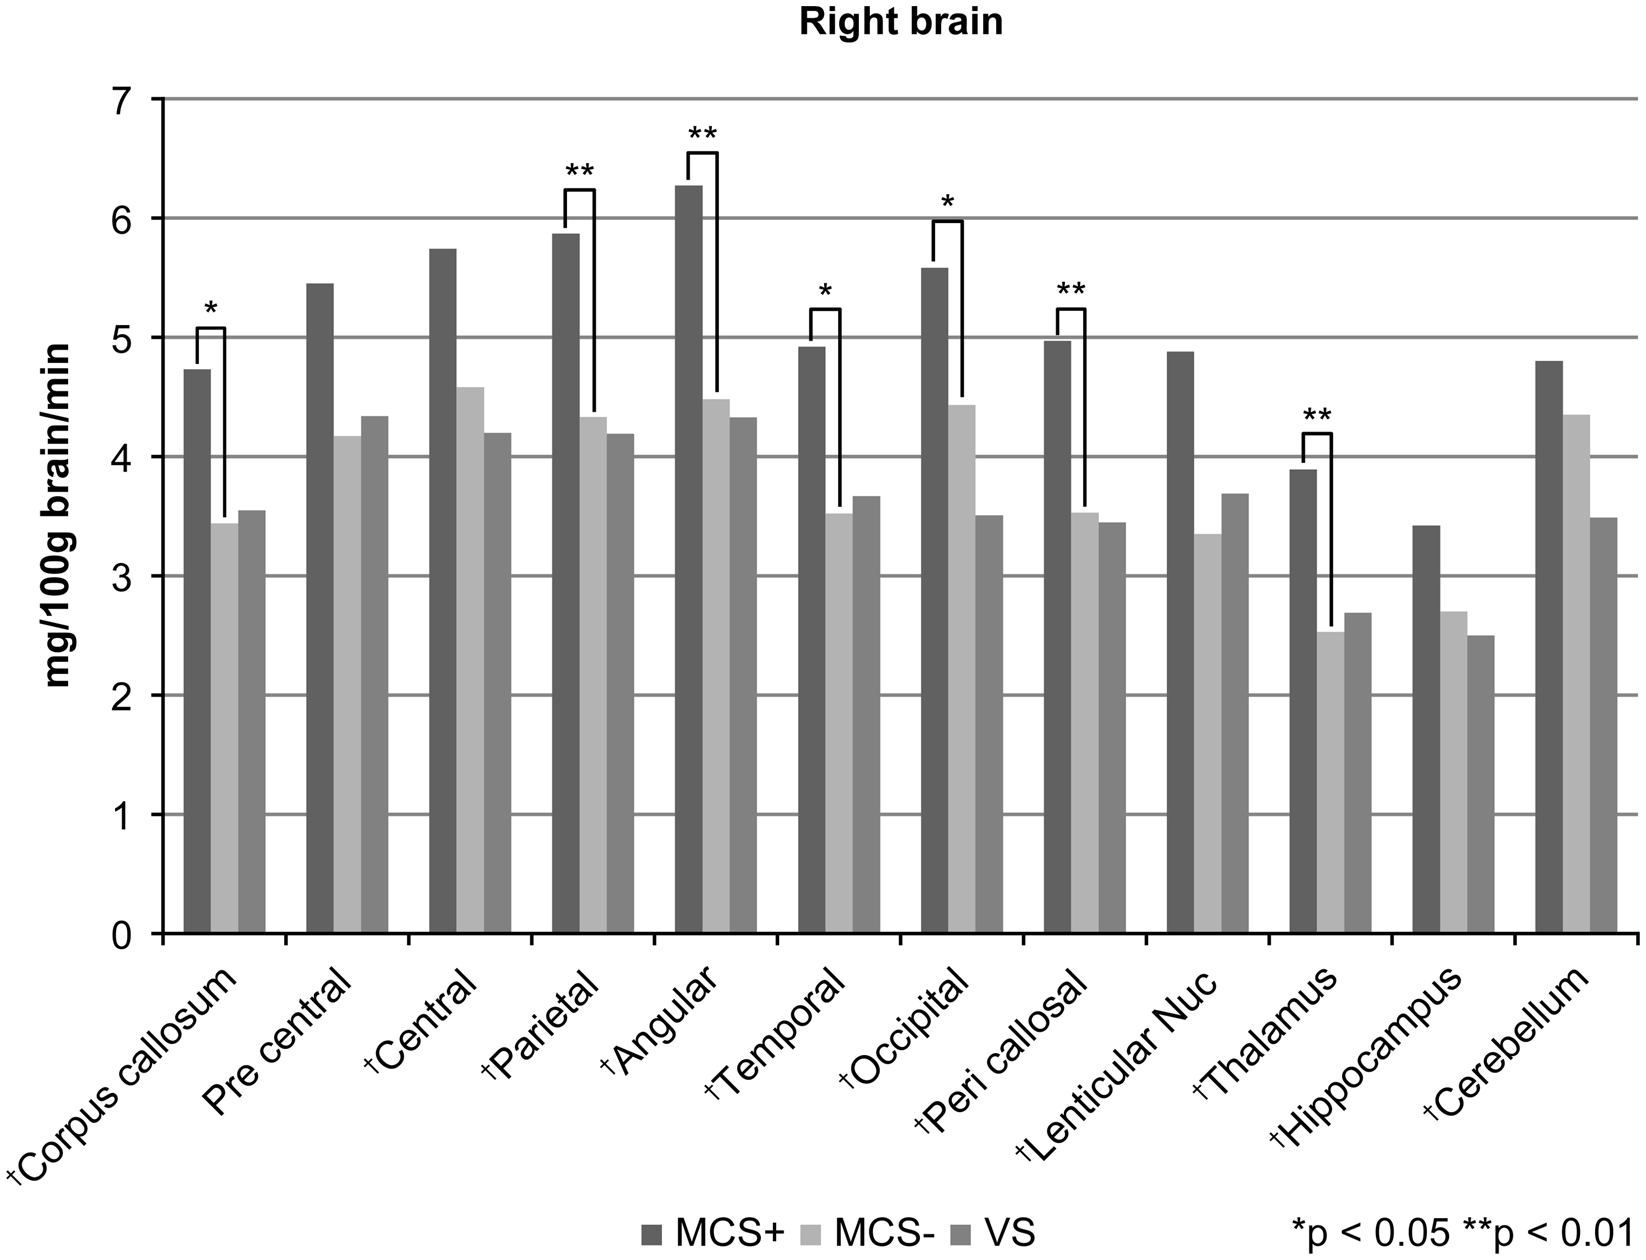
Figure 2: Table regional cerebral metabolic rate of glucose (CMRGlu) values in 12 regions in the right hemisphere. Regional CMRGlu values declined with increased consciousness deterioration in 11 of 12 (91.7%) regions examined, as assessed by analysis of variance (ANOVA)/Welch’s test (†). Multiple comparisons revealed that the regional CMRGlu values were markedly higher in MCS+ patients than in MCS− patients for 7 of 11 regions that exhibited significant differences in the initial analysis. We found no regions with significant differences in regional CMRGlu values between MCS patients and VS patients. Using the Games–Howell method, multiple comparisons were performed in the right lenticular nucleus and left pericallosal region and the Tukey method for multiple comparisons of the remaining 20 regions. *P < 0.05, **P < 0.01.
Table 2: Regional cerebral glucose metabolic rates in each brain hemisphere
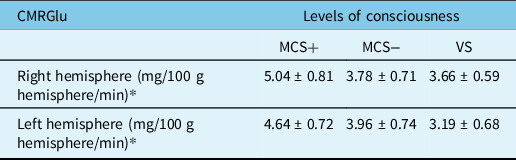
CMRGlu=cerebral metabolic rate of glucose; MCS=minimally conscious state; VS=vegetative state.
* P = 0.002 (ANOVA).
In the left hemisphere, the regional CMRGlu values reduced with increasing deterioration of consciousness in 11 of 12 regions examined, including the corpus callosum (P = 0.024, ANOVA), central region (P = 0.037, ANOVA), parietal region (P = 0.002, ANOVA), angular gyrus (P = 0.040, ANOVA), temporal region (P = 0.012, ANOVA), occipital region (P < 0.001, ANOVA), pericallosal region (P = 0.001, Welch’s test), lenticular nucleus (P = 0.008, ANOVA), thalamus (P = 0.001, ANOVA), hippocampus (P = 0.008, ANOVA) and cerebellar hemisphere (P = 0.005, ANOVA; Figure 3). We observed no significant differences in regional CMRGlu values in the precentral region (P = 0.098, ANOVA).

Figure 3: Regional cerebral metabolic rate of glucose (CMRGlu) values in 12 regions in the left hemisphere. Regional CMRGlu values declined as consciousness levels deteriorated in 11 of 12 (91.7%) regions examined, as assessed using analysis of variance (ANOVA)/Welch’s test (†). After multiple comparisons, we found no regions in the left hemisphere with significant differences in regional CMRGlu values between MCS+ patients and MCS− patients. Nevertheless, the regional CMRGlu value was significantly higher in MCS patients than in VS patients in the left occipital region. Multiple comparisons were performed using the Games–Howell method in the right lenticular nucleus and left pericallosal region and the Tukey method in the other 20 regions. *P < 0.05.
Comparison of CMRGlu Values between the MCS+ and MCS− Groups
The CMRGlu value in the right hemisphere was significantly higher in the MCS+ group than in the MCS− group (P = 0.009); however, no significant difference was observed in the regional CMRGlu value in the left hemisphere between MCS+ patients and MCS− patients (Figure 1). In the right hemisphere, the regional CMRGlu values were significantly higher in the MCS+ group than in the MCS− group in the corpus callosum (P = 0.028), parietal region (P = 0.008), angular gyrus (P = 0.004), temporal region (P = 0.014), occipital region (P = 0.044), pericallosal region (P = 0.005) and thalamus (P = 0.007; Figure 2). We observed no regions with significantly different regional CMRGlu values in the left hemisphere between the MCS+ and MCS− groups (Figure 3).
Comparison of CMRGlu Between the MCS− and VS Groups
We found no significant differences in regional CMRGlu values between the MCS− and VS groups in either the right or left hemispheres (Figure 1). In the right hemisphere, no significant regional differences were observed in CMRGlu values between the MCS− and VS groups (Figure 2). In the left hemisphere, the regional CMRGlu value in the occipital region was significantly higher in the MCS− group than in the VS group (P = 0.013; Figure 3).
Discussion
CMRGlu in Patients with Chronic DOCs
Regional CMRGlu measurements obtained by FDG-PET have been used as indirect neuronal activity indices. In patients with chronic DOCs, CMRGlu values declined with increasing deterioration in the level of consciousness compared with those in healthy individuals. In a separate FDG-PET study, Thibaut et al.Reference Thibaut, Bruno and Chatelle27 demonstrated that VS patients exhibited metabolic dysfunctions in both the thalamus and the wide cortical network that encompasses the extrinsic/lateral (the bilateral posterior parietal and prefrontal areas) and the intrinsic/medial (the precuneus area and adjacent posterior cingulate cortex and the mesiofrontal area and adjacent anterior cingulate cortex) networks compared with the functions noted in healthy controls. Nevertheless, metabolic dysfunction in MCS patients was limited to both the thalamus and the intrinsic/medial network compared with the metabolic function observed in healthy controls.Reference Thibaut, Bruno and Chatelle27 In our study, CMRGlu values in VS patients displayed larger reductions than those in MCS patients relative to standard values. Nakayama et al.Reference Nakayama, Okumura, Shinoda, Nakashima and Iwama26 reported that FDG-PET imaging of patients with diffuse brain injury-induced chronic DOCs presented marked bilateral hypometabolism in the medial prefrontal region and medial frontobasal region, as well as in the anterior and posterior regions of the cingulate gyrus and thalamus. Moreover, VS patients demonstrated more extensive hypometabolism than MCS patients, especially in the medial prefrontal and medial frontobasal regions.Reference Nakayama, Okumura, Shinoda, Nakashima and Iwama26
In an FDG-PET study, Stender et al.Reference Stender, Mortensen and Thibaut32 reported that VS patients, MCS patients and patients emerging from MCS presented mean CMRGlu values that were 38%, 56% and 63% that of the mean CMRGlu values observed in healthy individuals. In other studies, the overall cortical metabolism rate in VS patients was 30%–50% of the standard range for healthy individuals.33–Reference Laureys, Owen and Schiff38 These metabolic levels were comparable with those observed in healthy subjects undergoing deep anaesthesia and those detected during stages II–IV of non-REM sleep.Reference Buchsbaum, Gillin and Wu39,Reference Maquet, Degueldre and Delfiore40
In an FDG-PET study by Hatazawa et al.,Reference Hatazawa, Ito, Matsuzawa, Ido and Watanuki41 the mean CMRGlu values in the cortical grey matter, basal ganglia and centrum semiovale of healthy individuals were 5.17, 4.92 and 2.67 mg/100 g brain/min, respectively. In this study, the mean regional CMRGlu values in the right and left hemispheres were 5.04 and 4.64 mg/100 g brain/min in the MCS+ group, 3.78 and 3.96 mg/100 g brain/min in the MCS− group and 3.66 and 3.19 mg/100 g brain/min in the VS group, respectively. These values corresponded to 89.7%–97.5%, 73.1%–76.6% and 61.7%–70.8, respectively, of the regional CMRGlu values reported in the cortical grey matter of healthy individuals.Reference Hatazawa, Ito, Matsuzawa, Ido and Watanuki41 In our study, the CMRGlu values decreased with increased deterioration in the levels of consciousness, corroborating Stender et al.Reference Stender, Mortensen and Thibaut32 In addition, we observed significant differences in regional CMRGlu values among the three levels of consciousness in both the right and left hemispheres and in 11 of 12 (91.7%) anatomical regions examined in each hemisphere (as revealed by ANOVA or Welch’s test), thereby supporting the validity of the classifications used (MCS+, MCS− and VS) to assess consciousness levels in patients with chronic DOCs.
Differences in CMRGlu Between the MCS+ and MCS− Groups
The clinical discrimination between MCS+ and MCS− depends on the patients’ ability to communicate using linguistic/paralinguistic methods. In MCS+ patients, motivation to engage in communication is paramount and precedes the execution of verbal and motor functions during communication, which involves the left hemisphere. The potential of the right hemisphere to promote communication has been recognised in recent decades, including the motivation to engage in communication, recognition of proverbs, humour and metaphors and recognition of paralinguistic methods of communication, such as body language, gestures, facial expressions, tone and pitch.Reference Moscovitch and Perecman42–Reference Myers44
In this study, regional CMRGlu values were markedly higher in the MCS+ group than in the MCS− group in both the whole brain and 7 of 11 regions in the right hemisphere, supporting the idea that the preserved right hemispheric function, rather than the left hemispheric function, could be essential to initiate attention to verbal stimulation and stimulate communication. Bruno et al.Reference Bruno, Majerus and Boly45 reported that MCS+ patients demonstrated markedly higher metabolism than MCS− patients in Broca’s and Wernicke’s regions and the left premotor, left caudate and post- and precentral cortices. In contrast, we observed no significant differences in CMRGlu values between the MCS+ and MCS− groups in any left hemisphere regions examined. These discordant results are attributable to differences in the statistical and quantitative analyses performed between studies. During communication, regional CMRGlu values in the left hemisphere, which encompasses verbally dominant functions, could be higher than those in the right hemisphere among MCS+ patients, although we did not perform such a functional analysis in this study.
Differences in CMRGlu Between the MCS− and VS Groups
The clinical discrimination between MCS and VS is based on patients’ awareness of the external environment. MCS− patients can recognise the environment using all five senses, and visual function is the most commonly used in this context. The complexity of neural representations increases as visual information passes through the visual hierarchy. Visual information is received and processed into a visual image by the primary visual cortex, located in the occipital lobe. Then, visual images are analysed and recognised, as particular objects or human faces, by neurons in the visual association cortex. Hildebrandt et al.Reference Hildebrandt, Happe, Deutschmann, Basar-Eroglu, Eling and Brunhöber46 reported that patients who recovered from hypoxia-induced VS demonstrated higher perfusion in the visual cortex and precuneus than those with permanent VS using technetium-99 m ethyl cysteinate dimer single-photon emission computed tomography (99 mTc-ECD-SPECT), concluding that occipital and parietal lobe perfusion might represent critical characteristics for distinguishing between VS patients and patients emerging from VS. In this study, the regional CMRGlu value was markedly higher in the left occipital region in MCS− patients than in VS patients. These findings indicate that patients who exhibit preserved visual function in the occipital region are more likely to be aware of their external environments.
Behavioural assessment of each patient is generally performed on the day of admission to our hospital. Because it is a specific examination that requires booking, it was difficult to perform FDG-PET on the same day as admission. The behavioural condition of patients is assumed to be stable within 2 weeks before/after the FDG-PET examination because the patients were in the chronic phase.
Limitations
First, our study sample lacked massive focal brain damage, as assessed by MRI, implying that their principal pathology was severe diffuse brain injury, in which axonal injury is highly likely, occurring at the cerebellar peduncle, brainstem and deep structures of the cerebral hemispheres. The brainstem comprises the reticular activating system, which dominates consciousness. As we did not measure the regional CMRGlu values in the brainstem, further studies should address this limitation.
Second, of the 50 patients enrolled in this study, 4 (8% of the total population) were left-handed. Around 95% of normal, right-handed people and nearly 80% of left-handed people have left hemispheric language dominance.Reference De Oliveira, Marin and Bertolucci47 As 8% is a small proportion of the enrolled patients, we do not believe that the enrolment of these individuals affected the laterality of language dominance in our results. Nevertheless, the possibility that a similar study on left-handed patients exclusively might provide different results cannot be excluded. Hence, further studies with larger cohorts are essential to validate the correlation between the level of consciousness and regional CMRGlu values in patients with chronic DOCs.
Conclusions
In this study, regional CMRGlu values were lower in patients with chronic DOCs than in healthy individuals, corroborating the related literature. In addition, metabolism decreased with increased deterioration in the level of consciousness for most bilateral brain regions examined. Thus, this study suggests that the awareness of the external environment correlates with the preservation of the left occipital function and that the motivation to communicate correlates with the preservation of function in extensive areas of the right cerebral hemisphere among patients with TBI-induced chronic DOCs.
Acknowledgements
The authors would like to thank Mr. Daisuke Ogawa, Mr. Tsubasa Taguchi and Mr. Makoto Matsumoto for their support with FDG-PET. The authors would like to thank Enago (www.enago.jp) for the English language review.
Author Contributions
N.U. and J.S.: Conception and design, analysis and interpretation of data, and drafting the article. N.U.: Acquisition of data and statistical analysis. J.S. and H.Y.: Reviewed submitted version of manuscript. Y.I., Y.Y., H.T. and H.Y.: Administrative/technical/material support. J.S.: Study supervision.
Noriko Usami, the corresponding author of the work, certifies that all authors have participated sufficiently in the conception and design of the work and were involved in the acquisition of data. All authors have also participated in the analysis and interpretation of the data, as well as the drafting of the work. All authors also revised the work and contributed to the final approval of the version for publication. Each author also agreed to be accountable for all aspects of the work in ensuring that questions related to the accuracy or integrity of any part are appropriately investigated and resolved.
Conflicts of Interest
The authors have no conflicts of interest to declare.


 Open access