


Introduction
Wilson’s disease (WD) is an inherited autosomal recessive disorder due to ATP7B gene mutation, resulting in defective copper metabolism and excessive copper accumulation in the brain and liver.Reference Bhattacharya and Thankappan1 The clinical phenotype is variable, including movement disorders (ataxia and dystonia),Reference Shribman, Warner and Dooley2 cognitive impairment,Reference Hu, Xu and Dong3 depression, and generalized epilepsy.Reference Wang, Yu and Yang4 Pharmacological therapy with anti-copper drugs is currently the main treatment method for patients with WD, and most patients correctly treated respond well.Reference Tang, Bai and Hou5 However, the neuropathological mechanisms in patients with neurological manifestations are still unclear, and neurological symptoms persist or even exacerbate.
Histopathological changes in WD have been described, including reactive astrogliosis, demyelination, central pontine myelinolysis, cavitation, and gray matter and white matter (WM) were both affected.Reference Redzia-Ogrodnik, Czlonkowska and Bembenek6,Reference Song, Zou and Zhao7 As a noninvasive tool, diffusion tensor imaging (DTI) observes water diffusion properties in the brain to reveal the histological features of WM. The metrics of DTI which reflect the condition of axons and myelin include fractional anisotropy (FA), mean diffusivity (MD), axial diffusivity (AD), and radial diffusivity (RD). Various alterations in WM microstructural organization have been identified in WD using DTI techniques.Reference Li, Zhou, Xu, Pan and Chen8,Reference Shribman, Bocchetta and Sudre9 However, previous DTI studies have only investigated changes in diffusion measurements of WM, and the categoric location of WM fiber bundle abnormalities remains unclear. Automated fiber-tract quantification (AFQ) can quantify the diffusion characteristics of fiber bundles along with multiple nodes point by point, instead of the average value of the entire fiber bundle, providing effective evidence for the abnormal position of fiber bundles.Reference Carbine, Duraccio, Hedges-Muncy, Barnett, Kirwan and Jensen10 AFQ has been used to study microstructural changes in a variety of neurogenic diseases and shows advantages in processing large amounts of data efficiently.Reference Qu, Wang and Liu11,Reference Deng, Yin and Zhang12 Deng and colleagues had introduced the AFQ method to investigate the impairment and reorganization patterns and characteristics of language-related WM in AVMs located in different brain areas.Reference Deng, Yin and Zhang12 AFQ was also used to study the disruption of WM tracts in a pointwise analysis in patients with trigeminal neuralgia.Reference Li, Sun and Hao13
In this study, AFQ was applied to assess the reproducibility and diagnostic value of microstructural WM in WD patients compared with normal controls. The first goal of our study was to demonstrate the alterations in WM characteristics and the explicit location of WM fiber tract abnormalities in patients with WD. The second goal was to reveal whether abnormal WM integrity correlates with clinical severity in individuals with neuropathic WD.
Methods
Subjects
From April 2021 until August 2021, 99 patients with WD (62 men, 37 women; age, 27.48 ± 7.34 years; age range: 17–47 years) and 91 age- and sex-matched controls (59 men, 32 women; age, 26.01 ± 5.47 years; age range: 17–45 years) were recruited to participate in this study. The diagnosis of WD is based on the clinical extrapyramidal symptom and behavioral problems, Kayser-Fleischer ring, low serum copper, decreased level of serum ceruloplasmin (SC), and increased 24-h urinary copper (24-h UC) excretion.14–Reference Wang, Wu and Xu15 Participants with WD were censored with the Unified Wilson’s Disease Rating Scale (UWDRS) score,Reference Czlonkowska, Tarnacka and Moller16 and the neurological examination (UWDRS-N) score, SC, and 24-h UC excretion were recorded. This study was approved by the local ethical committee, and informed consent for participation was signed. All subjects were right-handed. Detailed information regarding the subjects is presented in Table 1.
Table 1: Clinical and biochemical characteristics of patients with WD

Image Acquisition and Image Analysis
All participants were scanned on a clinical 3.0-T MR imaging system (Discovery MR750, GE Healthcare, Milwaukee, WI, USA) equipped with an eight-channel high-resolution radiofrequency head matrix coil. Sequences of imaging included T1-3D BRAVO and DTI. DTI images were acquired with the parameters as: TR/TE, 4800 ms/minimum; matrix, 128 × 128; FOV, 256 × 256 mm; slice thickness, 3 mm with no gap; 50 axial slices; 64 directions at a b value of 1000 sec/mm2; and 5 non-weighted diffusion images (b = 0 sec/mm2). T1-3D BRAVO images were obtained with: TR/TE, 8.2 ms/3.2 ms; FA, 12°; matrix, 256 × 256; FOV, 256 × 256 mm; slice thickness, 1 mm with no gap; and 166 slices.
The DTI data preprocessing was performed using Software Library (FSL version 5.0; HTTPS://www.fmrib.ox.ac.UK/fsl/). Preprocessing steps for DTI data included image correction for motion, eddy current deformations, skull stripping, and tensor fitting with the tool of diffusion toolbox (FDT) and brain extraction tool (BET). Whole-brain diffusion metrics, including FA, MD, AD, and RD, were calculated by the DTIFIT program at each voxel. Dt6 file was obtained by T1 image aligned to raw B0 with the AC–PC plane for further analysis, and images that failed to align were culled based on the visual evaluation. Then, 20 major fiber tracts of the whole brain were identified using the AFQ toolkit (https://github.com/yeatmanlab/AFQ, version 1.2).Reference Yeatman, Dougherty, Myall, Wandell, Feldman and Beaulieu17 A brief description of the steps for AFQ is as follows: (1) whole-brain deterministic tractography with thresholds of turning angle <30° and FA >0.2; (2) fiber tract segmented using regions of interest (ROIs); (3) the identified fiber tract refinement based on the fiber tract probability maps; (4) fiber tract cleaning by an outlier rejection algorithm; and (5) calculation of the diffusion metrics along each fiber tract at 100 equidistant nodes. However, some fibers failed to track because of the data quality and strict criteria for tract identification. All 20 fiber bundles for each subject could not be recognized, especially the bilateral cingulum hippocampus. Thus, subjects with no more than 16 fiber bundles recognized were culled from the further analysis.
Statistical Analysis
All statistical analyses were conducted with Statistical Package for Social Science software (SPSS, v20.0, Chicago, IL, USA). T tests and χ 2 tests were used to investigate the age and sex difference. Mann–Whitney U test was conducted in group-level pointwise analyses of the diffusion metrics across 100 points of each fiber tract, and mean values were plotted. Spearman’s correlation analysis was used to assess the correlations of diffusion metrics with symptom scores, including UWDRS-N score, SC, and 24-h UC excretion, with a 0.05 significance level adopted. Square root transformation was applied to the UWDRS-N score because of its heavy-tailed shape.Reference Dusek, Lescinskij and Ruzicka18
Results
The demographic and clinical characteristics of the WD patients and controls are summarized in Table 1. There were no differences in age and gender distribution between healthy control and patient groups.
Diffusion Measures Changes in WD Patients
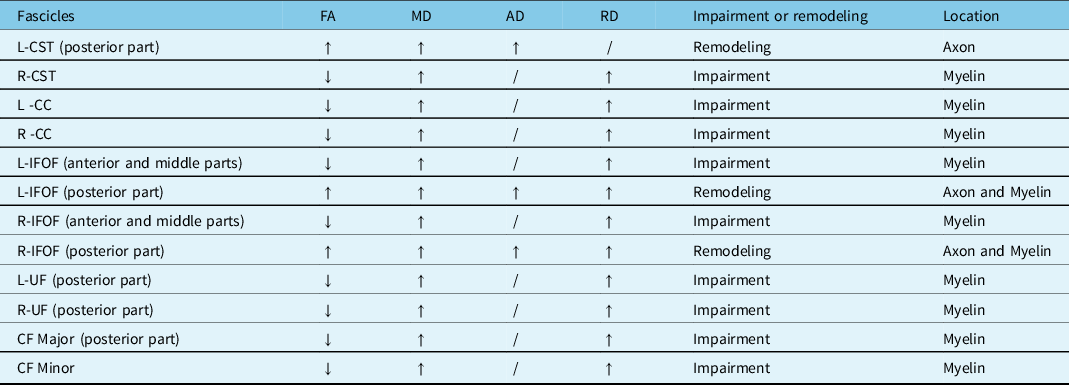
Compared with the controls, the patients with WD showed widespread FA reduction and MD, and RD elevation of identified fiber tracts. The details are as follows: (1) patients with WD showed lower mean FA values in the R-corticospinal tract (R-CST), bilateral cingulum cingulate (CC), bilateral inferior fronto-occipital fasciculus (IFOF) (anterior and middle parts), bilateral uncinate fasciculus (UF) (posterior part), callosum forceps (CF) Major (posterior part), CF Minor and high mean FA values in the L-CST (posterior part), and bilateral IFOF (posterior part) (Figure 1). (2) Patients with WD showed high mean MD values in the bilateral CST, bilateral CC, bilateral IFOF, bilateral UF (posterior part), CF Major (posterior part), and CF Minor (Figure 2). (3) Patients with WD showed high mean AD values in the L-CST (posterior part), L-IFOF (posterior part), and R-IFOF (posterior part) (Figure 3). (4) Patients with WD showed high mean RD values in the R-CST, bilateral CC, bilateral IFOF, bilateral UF (posterior part), CF Major (posterior part), and CF Minor (Figure 4). The main changes in the FA, MD, AD, and RD values of WD patients are summarized in Table 2.
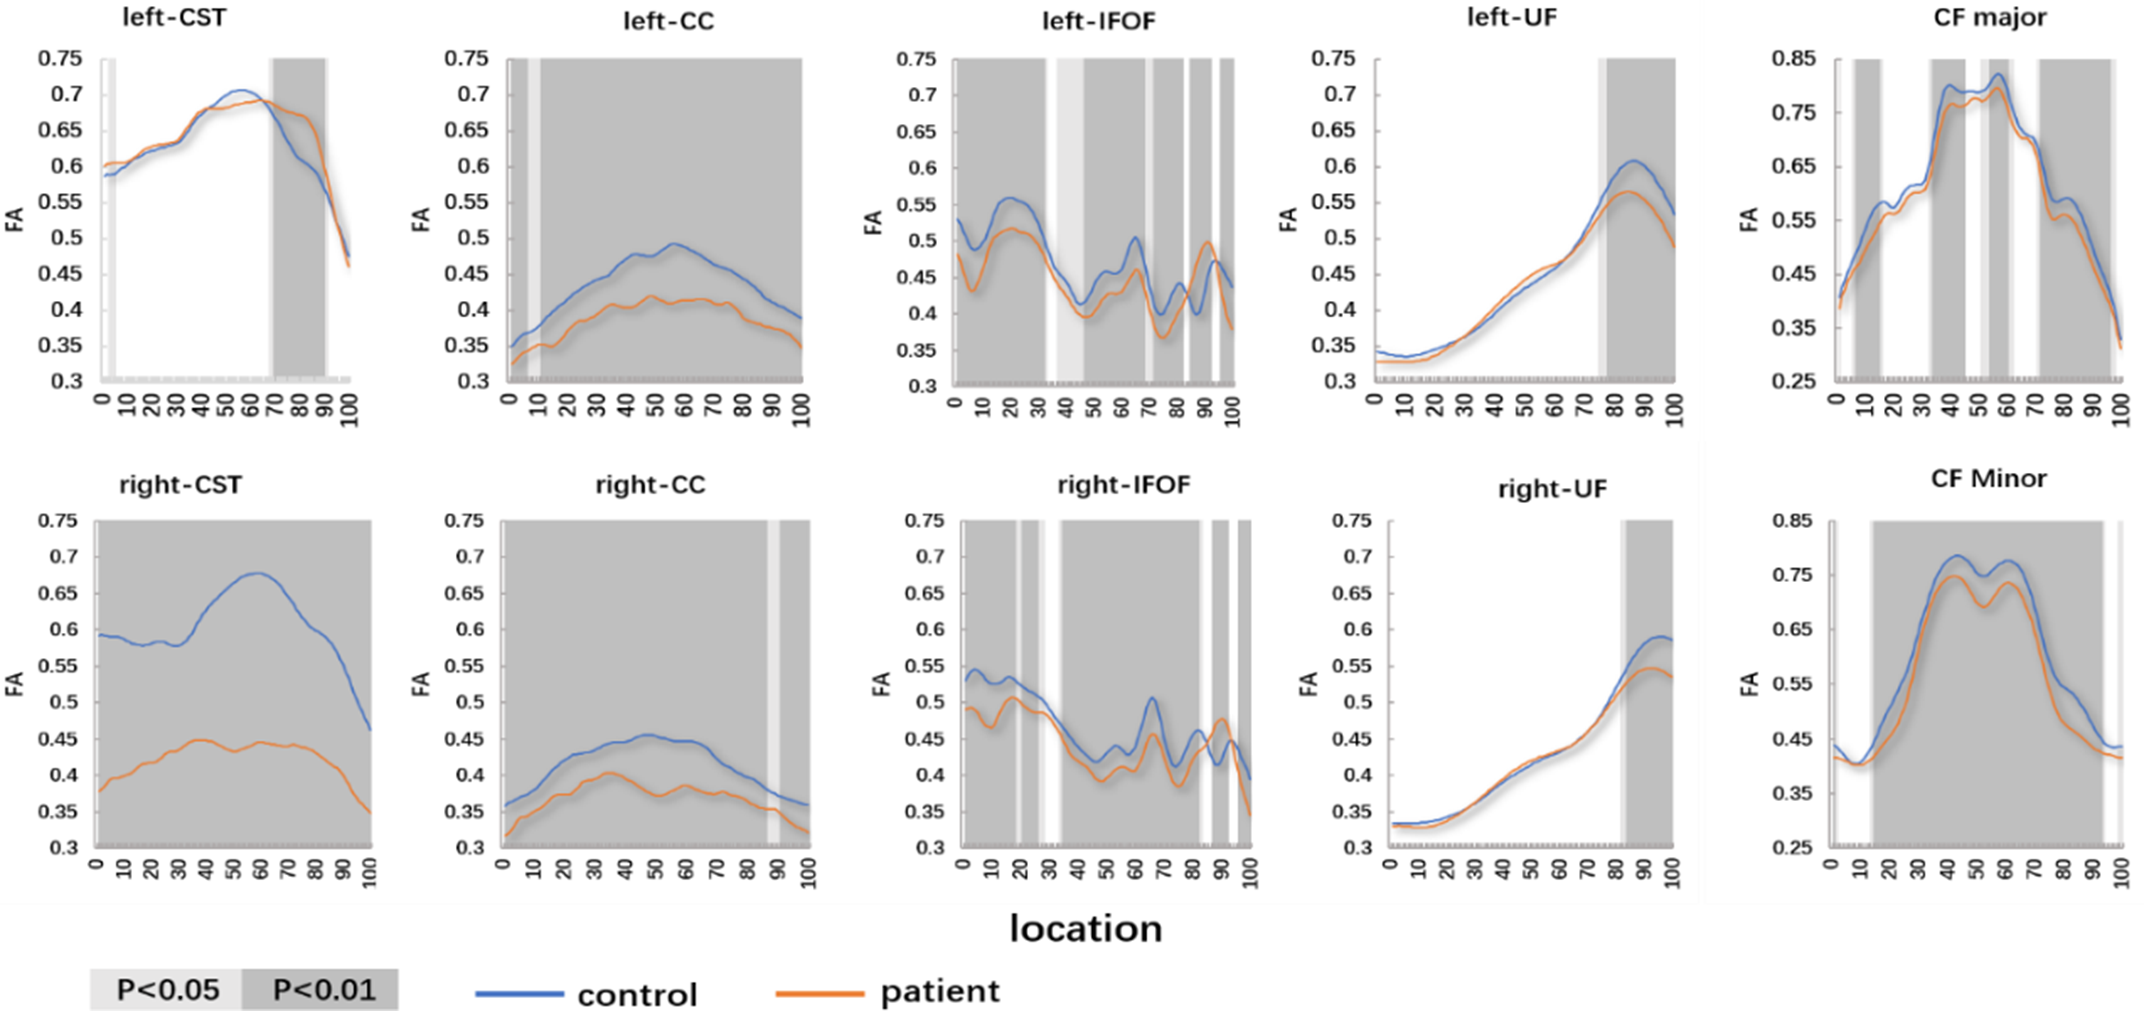
Figure 1: The pointwise comparison of FA profiles along the 10 fiber tracts among patients with WD and controls. Shaded gray background indicates a tract segment where the mean diffusion properties of the patients are significantly different with p < 0.05 and p < 0.01.

Figure 2: The pointwise comparison of MD profiles along the 10 fiber tracts among patients with WD and controls. Shaded gray background indicates a tract segment where the mean diffusion properties of the patients are significantly different with p < 0.05 and p < 0.01.
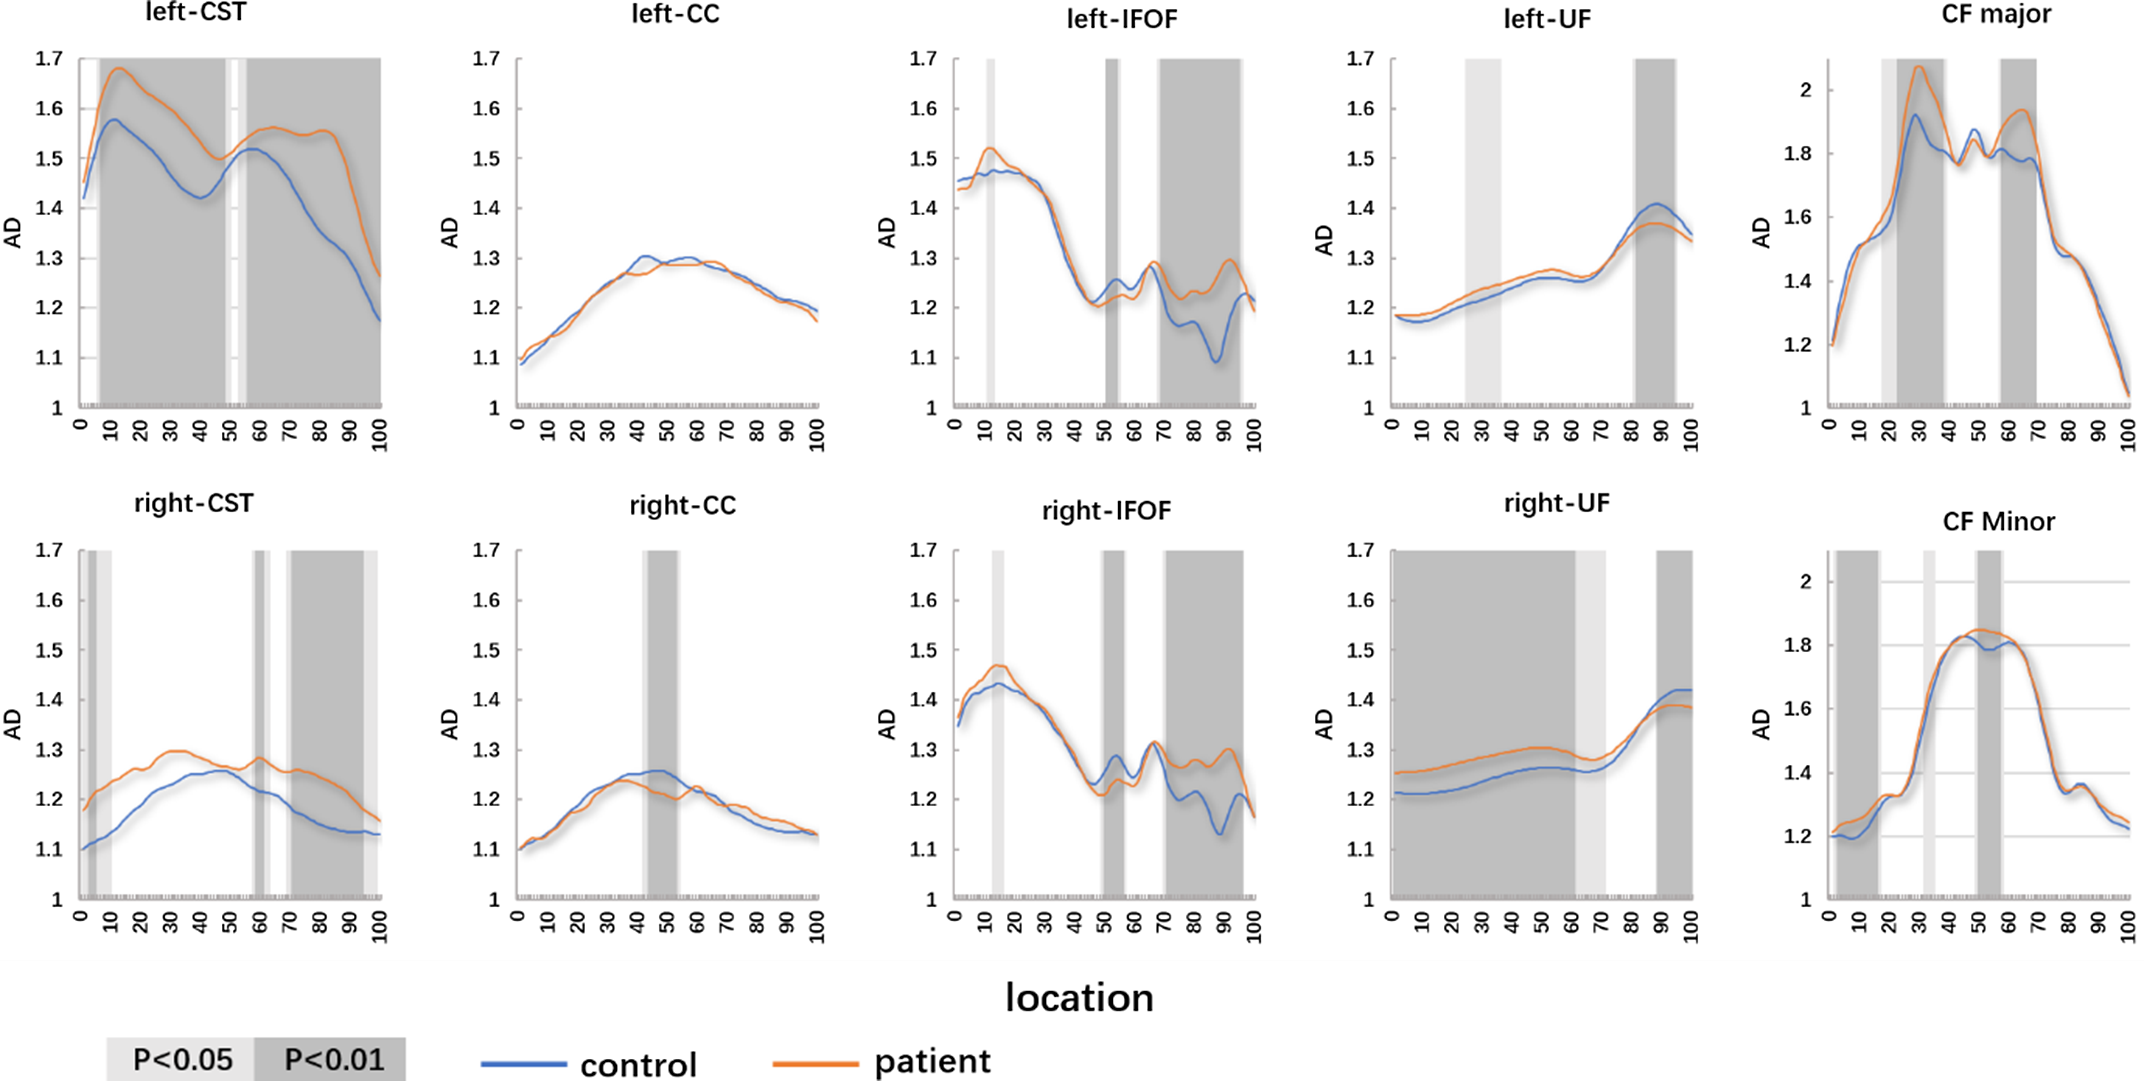
Figure 3: The pointwise comparison of AD profiles along the 10 fiber tracts among patients with WD and controls. Shaded gray background indicates a tract segment where the mean diffusion properties of the patients are significantly different with p < 0.05 and p < 0.01.

Figure 4: The pointwise comparison of RD profiles along the 10 fiber tracts among patients with WD and controls. Shaded gray background indicates a tract segment where the mean diffusion properties of the patients are significantly different with p < 0.05 and p < 0.01.
Table 2: Lesions of the main fiber
Correlation Between the Diffusion Measure and Clinical Features
Significant correlations between DTI parameters and the UWDRS-N score, SC, and 24-h UC excretion were found. The FA values in the R-CST and L-CC were negatively correlated with the UWDRS-N score (r = −0.36, p < 0.05; r = −0.38, p < 0.05) (Figure 5). The MD value in the L-CC was negatively correlated with the UWDRS-N score (r = 0.25, p < 0.05) (Figure 6). There is no significant difference in the correlation between AD values and symptom scores (Figure 7). The RD values in the CF Major, CF Minor, L-IFOF, and R-IFOF were positively correlated with the UWDRS-N score, and RD values in the L-CC and L-UF were positively correlated with the SC (Figure 8).

Figure 5: Correlation analysis between FA of fiber tracts and clinical features. Results of correlation analysis are presented as a correlation coefficient matrix. Positive correlations are shown in red, and negative correlations are shown in blue.
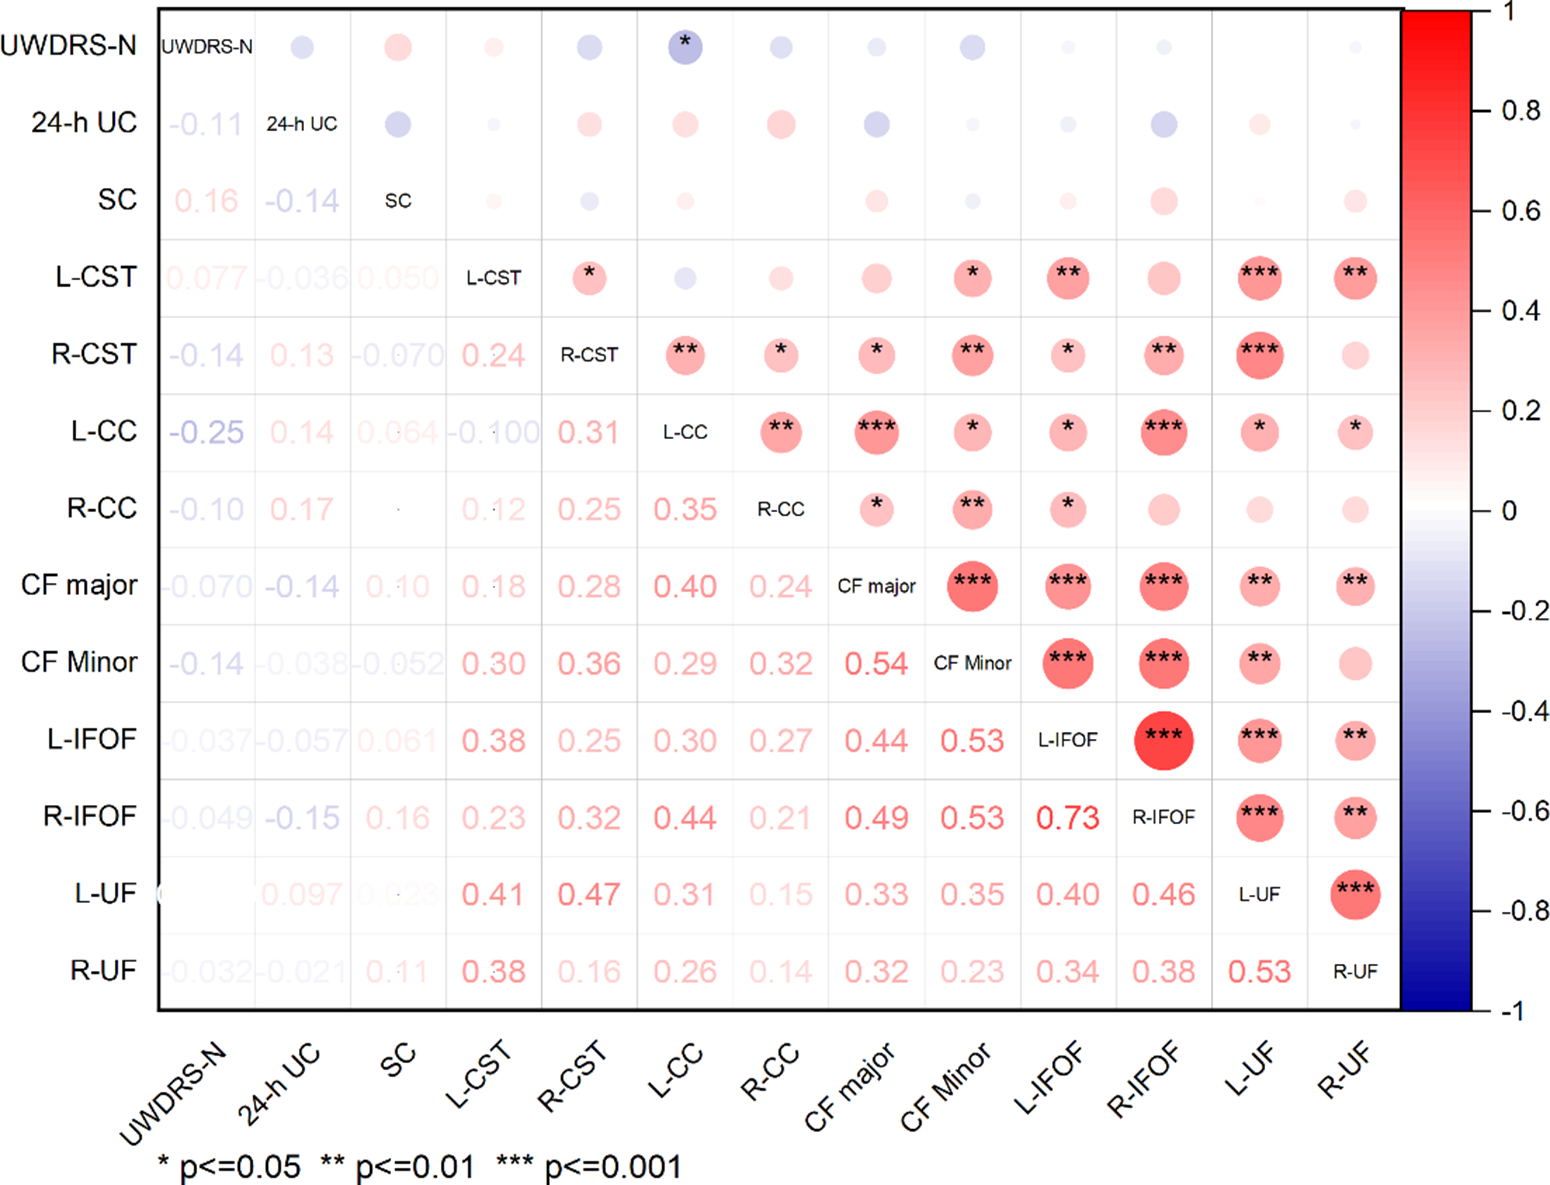
Figure 6: Correlation analysis between MD of fiber tracts and clinical features. Results of correlation analysis are presented as a correlation coefficient matrix. Positive correlations are shown in red, and negative correlations are shown in blue.

Figure 7: Correlation analysis between AD of fiber tracts and clinical features. Results of correlation analysis are presented as a correlation coefficient matrix. Positive correlations are shown in red, and negative correlations are shown in blue.

Figure 8: Correlation analysis between RD of fiber tracts and clinical features. Results of correlation analysis are presented as a correlation coefficient matrix. Positive correlations are shown in red, and negative correlations are shown in blue.
Discussion
Most previous studies have focused on gray matter in patients of WD, atrophy or functional reorganization of the basal ganglia (caudate, putamen, and globus pallidus), thalamus, and red nucleus.Reference Zou, Song, Zhou, Chu and Tang19,Reference Zhou, Li and Chen20 The changes in patients with WD in the WM integrity were confirmed in previous studies.Reference Hu, Xu and Dong3,Reference Morava, Baumgartner, Patterson, Rahman, Zschocke and Peters21 As a new algorithm, AFQ reconstructs tract profiles of WM automatically and quantifies the diffusion properties at multiple nodes along the fiber tract pointwise, improving the detailed level of the analysis.Reference Shu, Yu and Shi22 Diffusion properties (FA, MD, AD, and RD) were extracted for 100 anatomically locations. The characteristics of diffusion properties might be used as diagnostic biomarkers in these diseases of different pathologies. FA is a scalar value representing anisotropic water diffusion, which is associated with the cellular and axonal boundaries that delineate intact WM fibers; low FA values may indicate loss of WM integrity and high FA values may reflect fiber bundle plasticity.Reference Deng, Yin and Zhang12 MD represents the mean water diffusion rate, and high MD values may indicate axonal loss and demyelination. AD describes water diffusivity along the axonal fibers, which is related to axon integrity. RD represents an average of water diffusivities perpendicular to the axonal fibers and provides information on myelination. A high RD level is associated with tract demyelination, and a low RD level may be associated with myelin reorganization.Reference Stone, Ryman and Hartman23 To our best knowledge, this is the first study to explore potential regional WM fiber alterations and WM microstructural integrity in WD patients with the AFQ technique.
In this study, MD increased in the bilateral CST, FA, and RD increased in R-CST, and FA and AD increased in L-CST (posterior part). Besides, FA values in R-CST and L-CC showed a positive correlation with UWDRS-N score. It was suggested that the neurological severity grade of WD correlated with urinary Cu.Reference Kalita, Kumar, Parashar and Misra24 As a motor pathway, the CST controls the movements of the limbs and trunk, originated from the motor regions and somatosensory, and terminates at motor neurons and spinal cord interneurons.Reference Bastin, Pettit, Bak, Gillingwater, Smith and Abrahams25 Previous studies about structural brain imaging have demonstrated that the integrity of the CST relates to residual motor outcomes.Reference Schulz, Koch and Zimerman26,Reference Schulz, Park, Boudrias, Gerloff, Hummel and Ward27 Vuong and colleagues provided preliminary evidence that there was a sensitive clinical correlate of motor and whole-brain WM tract (including the CST and CC) impairment in children with spastic bilateral cerebral palsy, suggesting that anisotropy and myelination in these regions were associated with those selective voluntary motor control.Reference Vuong, Fowler, Matsumoto, Staudt, Yokota and Joshi28 Most WD patients have neurological symptoms, including speech disturbances, dysphagia, autonomic dysfunction, involuntary movements, and gait and balance disturbances. It was reported that associations were between neurological symptom score and increased MD in the anterior limb of the internal capsule and between a measure of disability and increased MD in frontal WM.Reference Jadav, Saini, Sinha, Bagepally, Rao and Taly29 Shribman suggested that the association between increasing neurological severity and decreasing AD seen in chronically treated patients reflects axonal loss and WM atrophy,Reference Shribman, Bocchetta and Sudre9 which is also consistent with our findings. Our results suggest that the neurological symptoms (dysphagia, autonomic dysfunction, involuntary movements, and gait and balance disturbances) of patients with WD might be caused by demyelination in R-CST and axon involvement in L-CST (posterior part).
The corpus callosum is the largest WM bundle responsible for brain lateralization and interhemispheric communication, and the microstructural abnormalities are likely to be associated with impaired interhemispheric interactions.Reference Lin, Bu and Wang30 Zhou and colleagues retrospectively reviewed clinical and biochemical characteristics and MRI findings of nine WD patients with corpus callosum abnormalities. Results indicated that lesions of the corpus callosum are not limited to the posterior (splenium), and that patients with corpus callosum lesions exhibited a longer course of the disease, more severe neurological dysfunction, and more extensive brain lesions compared to WD patients with no corpus callosum lesions.Reference Zhou, Wu and Cao31 In our study, we found that MD and RD increased in CF Major (posterior part) and CF Minor, and FA decreased in the CF Major (posterior part) and CF Minor. Besides, RD values in CF Major, CF Minor showed positive correlation with UWDRS-N score. Thus, it can be demonstrated that lesions of CF are prevalent in patients of WD and correlated with clinical neurological symptoms.
Besides the regions motor, this study also observed microstructural alterations in various extra-motor areas such as the frontal areas (IFOF, CC, and UF). As frontal-temporal association fibers, previous studies indicated that they may be associated with symptoms of cognitive decline.Reference Jiang, Liu and Gao32–Reference Unterrainer, Hiebler-Ragger and Koschutnig34 Studies focusing on neuropsychological impairments in WD have highlighted that patients with WD showing neurological signs present significant deficits in a wide range of cognitive domains.Reference Peyroux, Santaella and Broussolle35 The UF fiber links the anterior temporal lobe to the medial and lateral orbitofrontal cortex and plays a role in episodic memory, language, semantic activities, and social-emotional processing.Reference Zekelman, Zhang and Makris36 While IFOF may contribute to semantic processing. Damage to these fibrous microstructures may potentially correlate with cognitive impairment in patients with WD.
Conclusion and Limitations
Some limitations of this study should be noted. First, WD is a disease with damage to both white and gray matter, while this study only evaluated lesions in the WM. In future work, we need to comprehensively evaluate the physiological mechanisms of WD disease cases, including white and gray matter, structure, and function. Because of the shortage of evaluation of cognitive function in patients with WD, we cannot assess whether lesions with interrelated WM are associated with cognitive impairment in patients.
In summary, the present study has provided evidence that the metrics of DTI could be utilized as a potential biomarker of neuropathological symptoms in WD. Damage to the microstructure of CF and CST may be involved in the pathophysiological process of neurological symptoms in WD patients, such as gait and balance disturbances, involuntary movements, dysphagia, and autonomic dysfunction.
Acknowledgments
This work was supported from the National Natural Science Foundation of China (Grant National Natural Science Foundation of China) and the University Synergy Innovation Program of Anhui Province (No. GXXT-2020-025).
Funding
This work was supported from the National Natural Science Foundation of China (Grant No. 81973825), the Anhui Provincial Natural Science Foundation of China (Grant No. 2108085QH367), the Open Fund Project of Key Laboratory of Xin’An Medicine of Ministry of Education (No. 2020xayx12), and the University Synergy Innovation Program ofAnhui Province (No. GXXT-2020-025).
Conflicts of Interest
The authors declare that there is no conflict of interest regarding the publication of this paper.
Author Contributions
T.H.W., Y.L.Y., Y.F.D., and C.F.Z. have contributed to the collection of experimental data. H.L.W. and Y.W. have contributed to data analysis.


