


The presence of systemic-to-pulmonary collateral flow is common and felt, in some cases, to be of clinical significance in univentricular patients with a partial cavopulmonary connection (Glenn-anastomosis) or a Fontan circulation. Reference Mcelhinney, Reddy, Tworetzky, Petrossian, Hanley and Moore1,Reference Triedman, Bridges, Mayer and Lock2 The most common collaterals are systemic arterial-to-pulmonary arterial collaterals (i.e. aorta-to-pulmonary collaterals) and systemic venous-to-pulmonary venous collaterals (i.e. veno-venous collaterals), see Figure 1. Blood flow via these different types of collaterals will have variable haemodynamic consequences including increased pulmonary flow and volume loading of the systemic ventricle (aorta-to-pulmonary collaterals; left-right shunt) and cyanosis (veno-venous collaterals; right-left shunt). There is currently no consensus whether these collaterals are supportive or detrimental to the Fontan circulation and its clinical outcome. Cyanosis due to veno-venous collaterals is always unfavourable. However, the effect of volume loading due to systemic-to-pulmonary collateral flow can be favourable when there is decreased preload or unfavourable when the ventricle is overloaded. Consequently, there is also no consensus if aorta-to-pulmonary collaterals and veno-venous collaterals should be closed or left intact in patients with a Fontan circulation.
Quantification of these collateral flows and its haemodynamic consequences might be helpful in this discussion. Qualitative assessment of systemic-to-pulmonary collateral flow has been done using angiography, Reference Mcelhinney, Reddy, Tworetzky, Petrossian, Hanley and Moore1–Reference Banka, Sleeper and Atz3 during cardiopulmonary bypass, Reference Ichikawa, Yagihara and Kishimoto4,Reference Bradley, McCall, Sistino and Radtke5 or using lung scintigraphy. Reference Inuzuka, Aotsuka and Nakajima6 However, true quantification of systemic-to-pulmonary collateral flow in order to assess its haemodynamic significance is shown to be hazardously difficult. Several reports have proposed two-dimensional phase contrast MRI for quantification of systemic-to-pulmonary collateral flow, using different formulas resulting in a wide range of systemic-to-pulmonary collateral flow, varying between 0.78 and 1.65 l/min/m2 for Glenn patients and 0.3–1.03 l/min/m2 for Fontan patients. Reference Odenwald, Quail and Giardini7,Reference Whitehead, Harris and Glatz8,Reference Wang, Liang, Huang, Liu, Deng and Yang17–Reference Whitehead, Gillespie, Harris, Fogel and Rome20,Reference Latus, Gummel and Diederichs9–Reference Whitehead, Sundareswaran, Parks, Harris, Yoganathan and Fogel16 As a consequence of the heterogeneous methodology for calculation of systemic-to-pulmonary collateral flow, it is difficult to interpret the true amount of systemic-to-pulmonary collateral flow based on these previous studies. Moreover, it is important to note that it has not been possible to discriminate between aorta-to-pulmonary collaterals and veno-venous collaterals using these formulas. Four-dimensional (4D) flow MR has the potential for comprehensive haemodynamic assessment including quantification of S systemic-to-pulmonary collateral flow. Reference Valverde, Nordmeyer and Uribe21 We aimed to compare the reported formula’s that have been used for the calculation of systemic-to-pulmonary collateral flow to assess their consistency and to quantify systemic-to-pulmonary collateral flow in patients with a Glenn and/or Fontan circulation using 4D flow MR.

Figure 1. Schematical overview of the Fontan circulation including different types of collateral flow.
Legend: Colour coding: red; highly oxygenated blood, purple; transition between oxygenated and deoxygenated blood, blue: deoxygenated blood. The black box represents collateral blood flow measured using the pulmonary and systemic estimator. The black bars represent the location of the performed 4D flow MR measurements.
Materials and methods
Study population
Adult patients status-post a Glenn or Fontan procedure who had undergone 4D Flow MR acquisition at the Stanford University Medical Center between January 2011 and February 2016 were retrospectively selected from the institutional 4D MR database. All studies had been obtained as part of the patients’ routine clinical care. Ten additional control subjects without any structural or functional cardiovascular abnormalities who had undergone 4D flow MR scan, as screening of cardiac abnormalities (e.g. patent foramen ovale) were included. Clinical medical records were used to collect clinical variables. Exclusion criteria included significant artefacts in the MR data prohibiting suitable analysis, and fat-suppressed MR data making background phase correction and the flow data unreliable. The study was approved by the institutional review board from Stanford University Medical Center and was carried out with Health Insurance Portability and Accountability Act (HIPAA) compliance and in accordance with the principles of the Declaration of Helsinki.
4D flow MR acquisition and data processing
The 4D flow scanning sequence was performed at the end of a clinical scan using a 1.5T MR scanner (GE Health Care, Waukesha Wisconsin, USA). A clinical scan included a standard 2D steady-state free precession cine sequence (FIESTA) for cardiac examination (short-axis, long-axis, four-chamber, inlet-outlet views). Magnetic resonance angiography was thereafter performed by standard first-pass contrast-enhanced magnetic resonance angiography technique using gadofosveset (Ablavar, Lantheus Medical, Billerica, Massachusetts, USA) at a dose of 0.03 mmol/kg. Finally, the 4D flow scanning sequence was performed because its signal strength benefits from residual contrast after the magnetic resonance angiography. Phase-contrast images were acquired with a ECG-gated, respiratory compensated, 3D phase-contrast sequence with velocity encoding in all directions. The imaging volume covered the thorax. The scan parameters included: flip angle 15°, repetition time 3.65–4.72 ms (range), echo time 1.32–2.28 ms (range), acquired spatial resolution of 1.09–1.82 x 1.46–2.19 x 2.6–3.0 mm (range). One velocity encoding range (VENC) was used for each acquisition and was typically 150–300 cm/s (range), which has been shown to be reliable for both venous and arterial flows. Reference Tariq, Hsiao, Alley, Zhang, Lustig and Vasanawala22 Using segmented k-space technique, 4–6 phase-encoding lines were collected per heartbeat, depending on heart rate. This yields a temporal resolution of 60–110 ms. Data acquisition was accelerated in the spatial domain using compressed SENSE technique. Acceleration factor, ranging from 1.7 to 10, was adjusted to achieve a 10-minute scan. Raw MR data were transferred to a cloud-based 4D flow MR application (Arterys Inc., San Francisco, CA, USA) for post-processing, as has been described elsewhere. Reference Chelu, van den Bosch and van Kranenburg23,Reference Chelu, Wanambiro and Hsiao24 Post-processing included correction for Maxwell phase effects and encoding errors related to gradient field distortions. Background phase correction was executed by manual segmenting of the stationary voxels in the volumetric data after which the software automatically corrected the phase off-set caused by Eddy currents.
Flow measurements
In patients, blood flow was measured in the following locations: Ascending aorta at the level of the left pulmonary artery junction, right superior caval vein (below the entrance of the azygos vein if present), left superior caval vein (if present), inferior caval vein (between hepatic vein confluence and right atrium/conduit), Fontan conduit (distal and proximal to fenestration, if present), right pulmonary artery (if not possible the upper and interlobar branch were measured separately), left pulmonary artery (between the cavopulmonary shunt and the first left pulmonary artery branch), all left and right pulmonary veins before the confluence to the left atrium (Fig 2). In the control group, the aorta, pulmonary, and caval veins were assessed on the same locations as described above. The pulmonary arteries were measured between the pulmonary bifurcation and the first side branch. A dynamic cross-sectional plane perpendicularly on each vessel of interest was manually chosen using the three-dimensional magnitude data and the flow vector arrows across the cardiac cycle. Flow was quantified by manually segmenting the cross-sectional area of the vessel based on the anatomical magnitude data for each temporal frame throughout the cardiac cycle (Fig 3). All flow measurements were performed by one investigator (FR). In addition, to assess inter-observer variability, flow measurements were also performed by a second investigator (TW) in 10 control and 10 Fontan subjects. Cardiac index was defined as aortic ascending flow divided by body surface area. Pulmonary arterial flow was the sum of left and right pulmonary artery. Pulmonary venous flow was the sum of left and right pulmonary venous flow. Caval flow was the sum of superior and inferior caval venous flow (below the fenestration). Total venous return to the left atrium in control patients was defined as pulmonary venous flow and in Fontan patients as the sum of pulmonary venous flow and fenestration flow if present. Fenestration flow was measured as the difference between flow superior and inferior of the fenestration in the Fontan tunnel. Total venous return to the left atrium and aortic ascending flow should be equal in normal physiology and was used as a measure of internal consistency in the control group. Pulmonary to systemic flow ratios were calculated using pulmonary artery/aortic flow (Qpulmonary artery/Qsystemic) and pulmonary venous/aortic flow (Qpulmonary venous/Qsystemic). Left/right pulmonary venous and arterial flow distribution (e.g. left pulmonary/total pulmonary venous flow, right pulmonary/total pulmonary venous flow and left pulmonary artery/total pulmonary artery flow, and right pulmonary/total pulmonary artery flow) were expressed as percentages. All flows (Q) were indexed for body surface area (L/min/m2). Reference Haycock, Schwartz and Wisotsky25
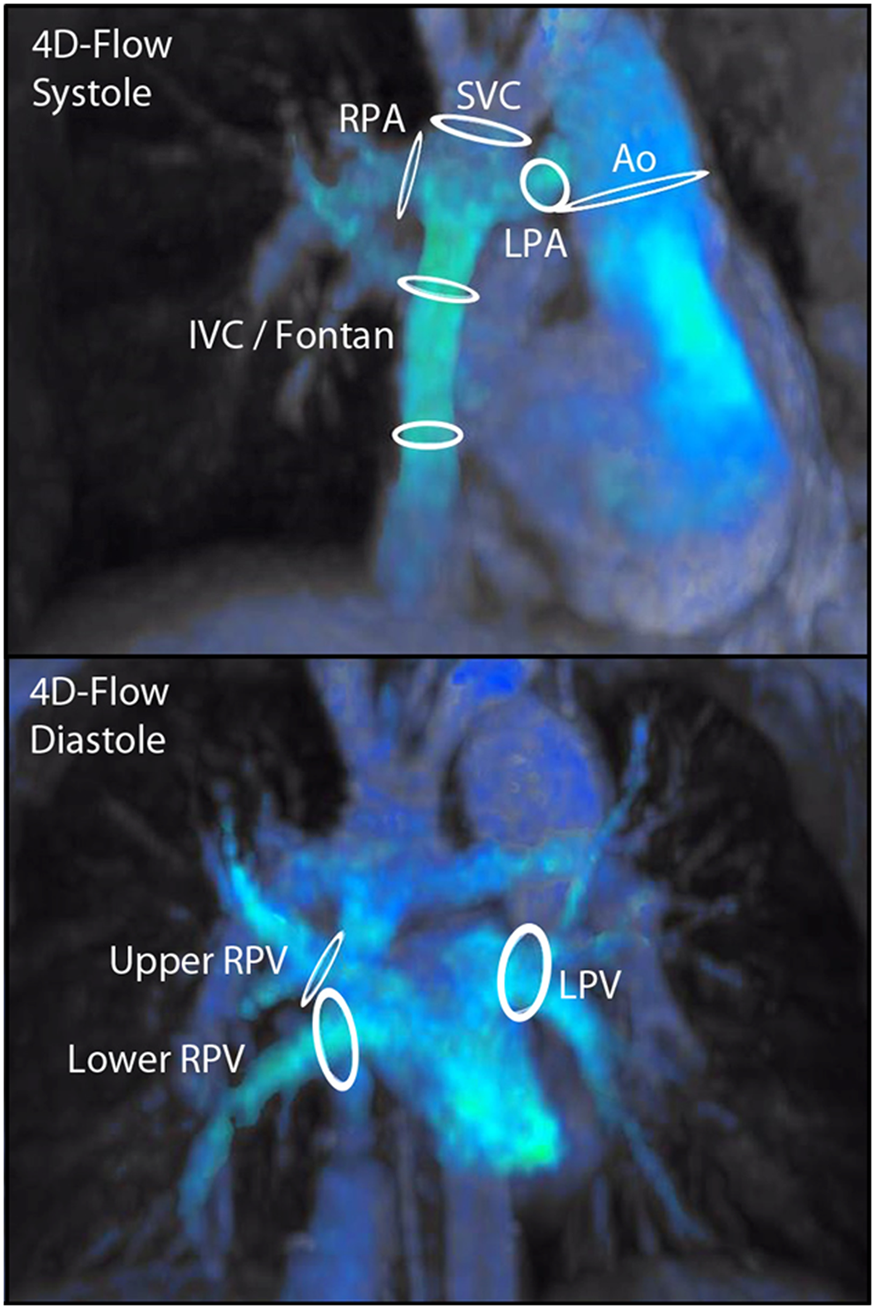
Figure 2. 4D flow MR overview of flow measurements in a Fontan patient.
Legend: Overview of all performed flow measurements in a Fontan patient. Ao; ascending aorta, IVC; inferior vena cava, LPA; left pulmonary artery, LPV; left pulmonary vein, RPA; right pulmonary artery, RPV; right pulmonary vein, SVC; superior vena cava.

Figure 3. Example of single 4D flow measurement.
Legend: Right pulmonary artery measurement in a Fontan patient. Panel A: coronal view. Panel B; cross-sectional (perpendicular) view of RPA measurement location. Panel C; longitudinal view of the RPA measurement location. Panel D; cross-sectional phase-contrast view of the RPA measurement. Ao: aorta, AoD: descending aorta, LA: left atrium, RPA; right pulmonary artery, RPV: right pulmonary vein, SVC; superior vena cava.
Calculation of SPCF
Systemic-to-pulmonary collateral flow was calculated using two different formulas that have been previously reported. Reference Whitehead, Harris and Glatz8,Reference Latus, Gummel and Diederichs9,Reference Fogel, Li and Wilson26,Reference Grosse-Wortmann, Al-Otay and Yoo10,Reference Glatz, Rome and Small11,Reference Grosse-Wortmann, Drolet and Dragulescu14–Reference Glatz, Harrison and Small19 Formula 1‘the pulmonary estimator’; systemic-to-pulmonary collateral flow[pulmonary estimator] = pulmonary venous – pulmonary artery flow. Formula 2); ‘The systemic estimator’; flow[systemic estimator] = ascending aortic - (superior and inferior caval venous) flow. systemic-to-pulmonary collateral flow values were normalised to body surface area. Reference Haycock, Schwartz and Wisotsky25 Systemic-to-pulmonary collateral flow values were also expressed as percentage of cardiac index and total pulmonary flow. To discriminate between aorta-to-pulmonary collaterals and veno-venous collaterals qualitatively, the anatomical 4D image set was used to screen for visible aorta-to-pulmonary collaterals and veno-venous collaterals.
Statistical analysis
Data are presented as median and interquartile ranges [25th–75th percentiles]. Categorical variables are expressed as a frequency distribution and percentages. Flows are expressed as l/min/m2 unless mentioned otherwise. The Mann–Whitney U test was performed for comparison of the continuous variables between the groups. The Wilcoxon signed-rank test was used to assess differences for repeated measurements within patients. Spearman rank correlation was calculated to assess the strength of relationship between quantitative variables. Bland–Altman analysis was performed to assess internal consistency between the flow measurements and to assess inter-observer variability, presented as mean difference (with 95% limits of agreement). Intra-class correlation analysis was performed to assess inter-observer variability, additionally the coefficient of variation was calculated. A p-value < 0.05 was considered to be significant. Statistical analysis was done using IBM SPSS Statistics 24.0 (IBM Corp.).
Results
Baseline characteristics
Thirty-eight adult patients with a Glenn-anastomosis or Fontan circulation were identified in the institutional 4D flow MR database. Twenty-four patients were excluded because of limiting susceptibility artefacts (n = 9) due to implanted metal material (n = 5 embolic coils, n = 1 stent in Fontan conduit, n = 3 due to sternal wires and/or metal clips) or unsuitable MR acquisition datasets (due to a fat-suppression technique making phase-contrast data unreliable) (n = 15). Fourteen adult patients were included (11 Fontan patients and 3 Glenn patients). The baseline characteristics of the patient group (n = 14) are shown in Table 1. Ten additional control subjects (age 31.2 [15.1–38.4] years) were included from the 4D MR flow database with confirmed absence of any structural or functional cardiovascular abnormalities. There were no significant differences in age and body surface area between the control and patient group.
Table 1. Patient group baseline characteristics (n = 14)
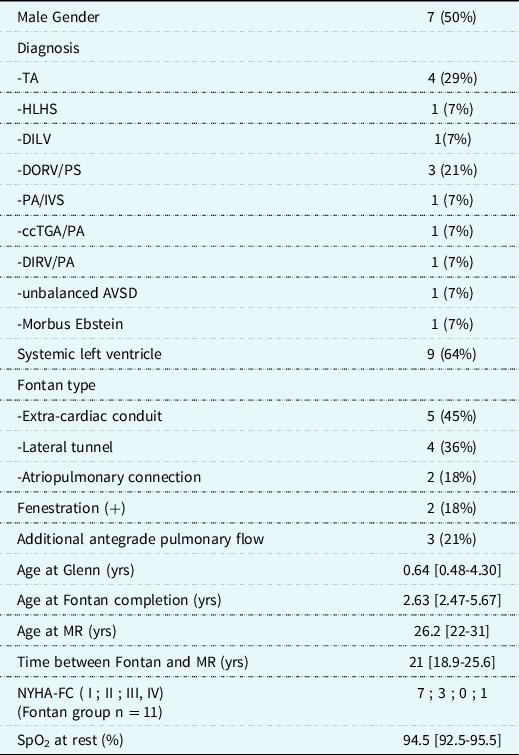
All data are expressed as frequency (%) or median [25th -75th percentiles]. AVSD; atrioventricular septum defect, ccTGA/PA; congenital corrected transposition of the great arteries with pulmonary artresia, DILV; double inlet left ventricle, DIRV/PA; Double inlet right ventricle with pulmonary atresia, DORV/PS; double outlet right ventricle with pulmonary stenosis, HLHS; hypoplastic left heart syndrome, MR; magnetic resonance, NYHA-FC; New York Heart Association-Functional Class, PA/IVS; pulmonary atresia with intact ventricular septum, SpO2; systemic peripheral oxygen saturation, TA; tricuspid atresia,.
MR-derived flow and systemic-to-pulmonary collateral flow results
Table 2 summarises the flow measurements for both groups. Cardiac index was significantly lower in the patient group, 2.57 [2.14–2.93] l/min/m2 versus 2.97 [2.72–3.56] l/min/m2 in the controls (p = 0.019). Essentially all measured flows were different between the patients and controls. Table 3 summarises the systemic-to-pulmonary collateral flow measurements. Systemic-to-pulmonary collateral flow[pulmonary estimator] was significantly higher in the patient group compared to the control group, both in absolute volume and relative percentage of either pulmonary venous or aortic flow (0.28 [0.09–0.5] versus 0.04 [−0.06-0.21] l/min/m2 (p = 0.036), 16% versus 1% of pulmonary venous flow (p = 0.007), 13% versus 1% of aortic flow (p = 0.022)). Similarly, SPCFSE was higher in the patient group compared to the control group (0.67 [0.24–0.88] versus −0.07 [−0.16-0.08] l/min/m2 (p < 0.001), 31% versus −2% of pulmonary venous flow (p < 0.001), 26% versus −2% of aortic flow (p < 0.001)).
In the control group, there was no significant difference between systemic-to-pulmonary collateral flow[systemic estimator] and systemic-to-pulmonary collateral flow[pulmonary estimator] calculations (p = 0.139). Systemic-to-pulmonary collateral flow was however, significantly higher in the patient group (p = 0.038) using systemic-to-pulmonary collateral flow[systemic estimator] (0.67 l/min/m2) when compared to systemic-to-pulmonary collateral flow[pulmonary estimator] (0.28 l/min/m2).
Table 2. Flow measurements results

All data are expressed as median [25th–75th percentiles]. *; considered statistically significant.
BSA; body surface area, IVC; inferior vena cava, LPA; left pulmonary artery, LPV; left pulmonary vein, MR; magnetic resonance, PCPC; partial cavopulmonary connection, Qpa; pulmonary arterial flow, Qpv; pulmonary venous flow, Qs; aortic flow, RPA; right pulmonary artery, RPV; right pulmonary vein, SVC; superior vena cava.
Table 3. Systemic-to-pulmonary collateral flow (SPCF) results

All data are expressed as median [25th -75th percentiles]. AoA; aortic ascending, PCPC; partial cavopulmonary connection, PV: pulmonary venous, SPCF; systemic-to-pulmonary collateral flow, PE; pulmonary estimator (=PV-PA), SE; systemic estimator (=AoA-[SVC + IVC]).
The mean difference between systemic-to-pulmonary collateral flow[systemic estimator] and systemic-to-pulmonary collateral flow[pulmonary estimator] was 0.32 (−0.56-1.19) l/min/m2 for the patient group. Mean difference between aortic ascending flow and total venous return to the left atrium was 0.35 (−0.32-1.01) l/min/m2 for the Fontan group. Between the Glenn (n = 3) and Fontan (n = 11) subgroups, no statistically significant differences were found in systemic-to-pulmonary collateral flow, regardless of calculation method ([pulmonary estimator] versus [systemic estimator]). In Fontan patients, when systemic-to-pulmonary collateral flow was included in the Qpulmonary venous this resulted in a significant higher Qpulmonary/Qsystemic ratio expressed as the difference between the ratios of Qpulmonary artery/Qsystemic (Qpulmonary without systemic-to-pulmonary collateral flow) and Qpulmonary venous/Qsystemic (Qpulmonary with systemic-to-pulmonary collateral flow): 0.70 [0.66–0.77] versus 0.85 [0.73–0.90]; p = 0.003. Regardless of systemic-to-pulmonary collateral flow, both Qpulmonary venous/Qsystemic and Qpulmonary artery/Qsystemic ratios were significantly lower in patients compared to controls (Qpulmonary venous/Qsystemic; 0.82 versus 0.97; p < 0.01 and Qpulmonary artery/Qsystemic; 0.71 versus 0.94; p < 0.001). In the control and Glenn groups, no statistical significant differences between Qpulmonary artery/Qsystemic and Qpulmonary venous/Qsystemic were found. None of the two systemic-to-pulmonary collateral flow formulas correlated with oxygen saturation at rest in the Fontan group. The left/right pulmonary arterial flow distribution in the control group was not different from that in the patient group (48%/52% versus 44%/56%; p = 0.403). Similarly, the left/right pulmonary venous flow distribution did not differ between controls and patients (49%/51% versus 46%/54%; p = 0.154). In the patient group, left/right systemic-to-pulmonary collateral flow distribution was 54%/46%.
Internal consistency and reproducibility
Mean difference between aortic ascending flow and total venous return to the left atrium was 0.08 (−0.45-0.6) l/min/m2 for the control group. Inter-observer agreement was good for all measurements as shown in Table 4.
Table 4. Inter-observer variability

AoA; Aortic ascending, CI; confidence interval, IVC; inferior vena cava, LoA; level of agreement, LPA; left pulmonary artery, LPV; left pulmonary vein, RPA; right pulmonary artery, RPV; right pulmonary vein, SVC; superior vena cava.
Qualitative assessment of systemic-to-pulmonary collateral flow
No evidence of aorta-to-pulmonary collaterals in our patient group was found but visible veno-venous collaterals were detected in seven Fontan patients. These veno-venous collaterals originated from both the lower and upper mediastinum (the innominate vein and superior vena cava) and they drained to either the inferior and/or superior pulmonary veins on either sides or drained directly into the left atrium, see Figure 4 for illustration. A sub-analysis between two subgroups based on the presence/absence of visible veno-venous collaterals did not show any significant differences in systemic-to-pulmonary collateral flow.

Figure 4. 4D flow MR images of systemic-to-pulmonary collateral vessels.
Legend: Examples of 4D flow MR images illustrating systemic-venous-to-pulmonary venous collaterals (i.e. veno-venous collateral, VVC) in two different Fontan patients. Anterior-to-posterior view. Panel A) VVC with infra-diaphragmatic origin with a tortuous course draining directly into the left atrium. Panel B) VVC originating from the upper mediastinum draining into the left pulmonary vein. Ao; aorta, AoD; descending aorta, L; left, LA; left atrium, LPA; left pulmonary artery, LPV; left pulmonary vein, R; right, RPV; right pulmonary vein, SV; single ventricle, SVC: superior vena cava. The arrows indicate a VVC.
Discussion
In this study, we quantified systemic-to-pulmonary collateral flow with 4D flow MR in Glenn and Fontan patients and showed that systemic-to-pulmonary collateral flow is significantly higher in this population compared to control subjects. Visible veno-venous collaterals were found in seven Fontan patients and no aorta-to-pulmonary collaterals were detected. The type of formula used for systemic-to-pulmonary collateral flow calculation did not change the amount of systemic-to-pulmonary collateral flow in the control group, however in the patient group systemic-to-pulmonary collateral flow did vary significantly depending on the formula used. The Glenn subgroup did not have significantly higher systemic-to-pulmonary collateral flow as compared to the Fontan subgroup in contrast to previous studies in children (Table S1). This might be attributed to the older age of the Glenn subgroup and the additional antegrade pulmonary flow that most of these patients still had. With 4D flow MR, it is possible to measure flow through multiple vessels of interest off-line, which is especially suited in patients with complex congenital cardiovascular anatomy for a comprehensive flow analysis. We showed that multiple 4D flow MR measurements are reproducible with good inter-observer agreement. This technique is of added value because in patients with complex congenital cardiovascular anatomy it is known that especially multiple pulmonary arterial and venous flow measurements are cumbersome using conventional MR phase-contrast imaging. Based on the current spatial resolution and phase-contrast signal-to-noise ratio in smaller collateral vessels, we did not deem it feasible to measure flow through these vessels directly, although this certainly could become possible in the near-future when the technology improves and would become an advantage of 4D flow MRI.
Currently, different formulas have been proposed for the calculation of systemic-to-pulmonary collateral flow with heterogeneous results as shown in Table S1. The systemic-to-pulmonary collateral flow[systemic estimator] formula has the advantage that only three measurements are necessary in large vessels which usually can be measured without much difficulty. This method has been used most frequently (Table S1). The systemic-to-pulmonary collateral flow[pulmonary estimator] formula has the advantage that systemic-to-pulmonary collateral flow can be expressed for each lung. The disadvantage is that all the pulmonary veins and both pulmonary artery branches need to be measured, especially measuring the right pulmonary artery in Fontan patients can be difficult with 2D phase-contrast MR. Reference Robbers-Visser, Helderman and Strengers27 We have shown that different approaches to quantify systemic-to-pulmonary collateral flow are consistent in the control group, however in the patient group there was a discrepancy among the two formulas used. Only three studies have described an agreement between the systemic-to-pulmonary collateral flow[systemic estimator] and systemic-to-pulmonary collateral flow[pulmonary estimator] formulas. Reference Odenwald, Quail and Giardini7,Reference Whitehead, Harris and Glatz8,Reference Valverde, Nordmeyer and Uribe21 Odenwald et al. showed frequent differences of 0.5–1.0 l/m/m2 between the pulmonary estimator and systemic estimator formulas. Reference Odenwald, Quail and Giardini7 Whitehead et al. reported a mean difference of 0.02 ( −0.6 – 0.6) l/min/m2 and Valverde et al. reported a mean difference of 0.01 (−1.52 to 1.54) min/m2). Reference Whitehead, Harris and Glatz8,Reference Valverde, Nordmeyer and Uribe21 In comparison, our results show a mean difference of 0.32 (−0.56 to1.19) l/min/m2 in the patient group.
There are a few explanations for our higher systemic-to-pulmonary collateral flow[systemic estimator] results compared to the systemic-to-pulmonary collateral flow[pulmonary estimator] formula. A potential limitation of the systemic-to-pulmonary collateral flow[pulmonary estimator] approach is that when veno-venous collaterals drain directly in the left atrium they are not included in the calculation (as in Fig 4A), which will lead to underestimation of systemic-to-pulmonary collateral flow[pulmonary estimator]. This could also explain the measured difference between total venous return to left atrium and ascending aortic flow in the Fontan group. Especially in older Fontan patients veno-venous collaterals are known to be more prevalent and this may explain the higher difference between systemic-to-pulmonary collateral flow[systemic estimator] and systemic-to-pulmonary collateral flow[pulmonary estimator] because our cohort was older compared to the three described studies which included more young Glenn patients (Table S1). Reference Odenwald, Quail and Giardini7,Reference Whitehead, Harris and Glatz8,Reference Valverde, Nordmeyer and Uribe21 Despite the possibility of not measuring veno-venous collaterals adequately with the systemic-to-pulmonary collateral flow[pulmonary estimator] formula, measurements of the pulmonary arteries and pulmonary veins are useful to appreciate the distribution of pulmonary flow better. Potential limitations of systemic-to-pulmonary collateral flow[pulmonary estimator] include underestimation of inferior vena cava flow, sometimes due to the inability to perform optimal segmentation or the presence of a suboptimal flow signal. This is likely to be related to anatomical variations in hepatic venous drainage, surgical variations in the conduit anastomosis, and the presence of a dilated inferior vena cava in older patients with an atriopulmonary connection. Finally, technical differences in the used MR acquisitions, post-processing, and differences in selection bias and sample sizes could account in part for these differences. We did not compare the 4D flow measurements directly with 2D phase-contrast measurements which can be considered a limitation. Technical limitations inherent to 4D flow MRI (such as the use of single velocity-encoded value [VENC]) could also have contributed to measurement errors. In our opinion, both the systemic-to-pulmonary collateral flow[pulmonary estimator] and systemic-to-pulmonary collateral flow[systemic estimator] formulas have their added value and we propose that both should be used in tandem as there is currently no consensus for a gold standard. When significant differences between systemic-to-pulmonary collateral flow[systemic estimator] and systemic-to-pulmonary collateral flow[pulmonary estimator] are found, the described limitations should be considered.
It is important to note that systemic-to-pulmonary collateral flow quantification using the described methods potentially includes multiple types of collateral flow: aorta-to-pulmonary collaterals, veno-venous collaterals, and systemic arterial-to-pulmonary venous shunts, see Figure 1. Intra-pulmonary arterial-to-pulmonary venous malformations (PAVM) can also be present; however, these cannot be measured separately using MR due to their intrapulmonary peripheral location.
Aorta-to-pulmonary collaterals form a left-to-right shunt, increase pulmonary blood flow, and may lead to volume loading of the heart. Potential beneficial effects include the promotion of pulmonary vascular growth, and pulsatility from aorta-to-pulmonary collaterals have been suggested to have positive effects on the endothelial-dependent vaso-relaxation response in the pulmonary vascular bed. Reference Zongtao, Zengwei, Hongyu, Renfu, Huishan and Xinmin28–Reference Kurotobi, Sano and Kogaki31 Furthermore, increase in pulmonary blood flow leads to increase of the ventricular preload that is assumed to be relatively reduced in the Fontan circulation. Unfavourable effects of aorta-to-pulmonary collaterals occur when the systemic-to-pulmonary collateral flow is haemodynamically significant and include chronic ventricular volume overloading which may result in ventricular failure and reduction of ‘effective cardiac output’ to the systemic circulation. Reference Ait Ali, Cadoni, Rossi, Keilberg, Passino and Festa15 Also, pulsatile aorta-to-pulmonary collateral flow in proximal pulmonary arteries may result in competitive flow with power loss in the cavopulmonary flow. Reference Ascuitto and Ross-Ascuitto32
Veno-venous collaterals bypass the pulmonary capillary bed and therefore cause right-to-left shunting resulting in systemic desaturation. Increased systemic venous pressure due to conduit obstruction or increased pulmonary vascular resistance may lead to development of veno-venous collaterals as a compensatory mechanism in attempt to relieve systemic venous pressure, and to maintain sufficient systemic venous return to the heart and thus cardiac output (‘natural fenestration’), however at the cost of oxygenation.
Currently, there are no clinical guidelines available regarding the management of systemic-to-pulmonary collateral vessels for patients with a partial cavo-pulmonary connection or Fontan circulation, resulting in heterogeneity of the used indications for catheter closure between centres. Reference Banka, Sleeper and Atz3 Considering aorta-to-pulmonary collaterals, the centres that do perform aorta-to-pulmonary collateral catheter occlusion have been using qualitative invasive criteria to grade the severity of aorta-to-pulmonary collaterals such as the size of aorta-to-pulmonary collaterals, oxygen step-ups in the pulmonary arteries and angiographic filling defects. These methods however cannot identify peripheral collaterals and are not quantitative. There is currently little evidence available if aorta-to-pulmonary collateral closure leads to improved outcome in the long-term, and while beneficial short-term effects of closure have been reported, Reference Dori, Glatz and Hanna33 this may be only a temporary solution, Reference Brown, Gauvreau and Powell34 or do not have a significant effect at all on systemic-to-pulmonary collateral flow. Reference Odenwald, Quail and Giardini7,Reference Prakash, Rathod, Powell, McElhinney, Banka and Geva13
Considering veno-venous collaterals, there is limited retrospective data available on the incidence and the effects of closure and there is no prospective outcome data. Reference Sugiyama, Yoo, Williams and Benson35–Reference Poterucha, Johnson and Taggart37 Decreased survival has been described in Fontan patients after a veno-venous collateral embolisation. Especially patients with heterotaxy, atriopulmonary connection, and a Fontan pressure above 18 mmHg had a high mortality and might had taken advantage from the natural fenestration that veno-venous collaterals provide. Reference Poterucha, Johnson and Taggart37 With comprehensive non-invasive 4D flow cardiac MR quantification, it is possible to assess more precisely for each patient whether systemic-to-pulmonary collateral flow is haemodynamic relevant, and in combination with clinical variables may aid in the selection and management of patients who may benefit from aorta-to-pulmonary collateral or veno-venous collateral closure.
Limitations
This study has limitations inherent to the use of MR which include a non-physiological imaging situation (supine position) and the exclusion of patients with implanted pacemaker devices. The 4D flow MR measurements were not compared directly to traditional 2D phase-contrast MRI measurements. This can be considered a limitation as 2D phase-contrast MR is still considered the gold standard for MR-derived flow measurements. The use of a single velocity-encoded value for both arterial and venous flows is a limitation that could affect precision of flow measurements. The acquired temporal resolution was generally higher than the consensus value which is a limitation and could influence the accuracy of flow measurements; however, the 4D flow data was interpolated to a temporal resolution of 40 ms or less which is sufficient for flow measurements, while the double integration with the 4D flow velocity field reduces the effects of high frequency events. There are limitations inherent to the retrospective cohort study design which includes a possible referral and selection bias and the impossibility to detect casual relationships. A significant amount of patients had to be excluded due to imaging artefacts (mainly metallic artefacts) or due to unsuitable MR acquisition data sets (due to a fat-suppression technique making phase-contrast data unreliable). Although these reasons for exclusion are predominantly of technical nature, a potential selection bias cannot be excluded. The small sample size limits the possibility to assess risk factors for systemic-to-pulmonary collateral flow or correlations with systemic-to-pulmonary collateral flow and clinical outcome parameters.
Conclusions
Increased systemic-to-pulmonary collateral flow can be detected and collateral vessels can be visualised with 4D flow MR in Glenn and Fontan patients. However, the amount of measured systemic-to-pulmonary collateral flow in Glenn and Fontan patients varies with the formula employed. Currently, none can be considered the gold standard for clinical application. Therefore, further research is necessary before it may support clinical decision-making to guide the management of systemic-to-pulmonary collaterals in these patients.
Supplementary material
To view supplementary material for this article, please visit https://doi.org/10.1017/S1047951122002840
Acknowledgements
None.
Financial support
FR received personal travel grants for this work from the Scholtes-Cordes Foundation, the Netherlands, from the Ministry of Education, Culture and Science, the Netherlands, and from the Graduate School of Medical Sciences, University of Groningen, the Netherlands. The other authors have no funding to report.
Conflicts of interest
None.
Ethical standards
The authors assert that all procedures contributing to this work comply with the ethical standards of the relevant national guidelines on human experimentation (Health Insurance Portability and Accountability Act [HIPAA]) and with the Helsinki Declaration of 1975, as revised in 2013, and has been approved by the institutional committee (the institutional review board from Stanford University Medical Center).


 Open access